Twitter is one of the most popular social media platforms in the world. This simple, but effective sharing channel has:
It’s no wonder so many companies want to tap into the potential of Twitter for their own social strategies. The fast-paced nature of this platform means that it’s a great way for brands to start building a stronger online presence. The trouble is, most companies don’t know how to get the most turnaround for their Tweets.
Learning how to track the right twitter metrics could help you make insightful decisions about your future marketing campaigns. The more you learn about your audience, the more you can transform every interaction into an actionable strategy for success.
So, which metrics should you start with?
1. Average Tweet Performance
Keeping track of your social media success isn’t always as simple as it seems. While you might be everyone’s favorite company on Twitter one day, you could lose their attention the next. This means it’s challenging for many brands to compare performance on the platform from one week to the next.
Having a solid benchmark in place is great for when you want to highlight the potential of your Twitter campaign to executives and shareholders. With that in mind, when it comes to measuring Twitter metrics, start by looking at averages.
If you evaluate your average engagement rate, average shares and average re-tweet number, it becomes much easier to smooth over the fluctuations in your performance. All you need to do to check your average performance is go to your Tweets page on your Twitter analytics dashboard.

2. Audience Type
Success on Twitter is all about being social. That means getting to know the people who follow you. Twitter metrics that indicate the kind of audience member you’re attracting to your page are useful for future campaigns. Your audience insights give you a general overview of who you should be tailoring your messages toward.
This data will make sure you’re producing relevant content for the right audience, based on important demographics like:
- What’s the primary gender of your audience?
- Where are your followers from?
- What kind of lifestyle do they lead?
- What are their interests/hobbies?

Keep an eye on these insights over time, as they may change as your business evolves.
3. Engagement Rate
Engagement is easily one of the most important social media metrics any company can track. The whole point of being active on social media is that it helps you build connections with your audience. A quick glance at your engagement rate should be enough to tell you whether your efforts are successful or not.
The great thing about Twitter is that there are dozens of ways for your audience to engage with your brand. For instance, the channel will assess engagement every time someone:
- Uses your branded hashtag
- Clicks on a link
- Favorites your page
- Follows you
- Links back to you
- Replies to your post
- Retweets
There’s much more to discover, but to find your overall engagement rate, go into your Tweets dashboard on Twitter analytics and click on Engagement Rate.

4. Type of Engagement
While it’s important to know how much engagement your posts receive, it’s equally necessary to understand what kind of actions your posts inspire. A like is great, but a retweet or comment shows a lot more commitment from your audience.
While likes are a sign that your customers appreciate what you have to say, a retweet shows that your followers really value your input. If you’re hoping to turn your customers from everyday followers into brand advocates, then you need the most in-depth engagement possible.

You can access a breakdown of your engagement activity by going to your Twitter Analytics dashboard. Click on the Tweets tab in the navigation bar, then View tweet activity. You can also look at the little bar-chart icon on a Tweet outside of the analytics platform too.

5. Content Performance
Great marketing is all about saying the right things, to the right audience, at the right time. Fortunately, by looking at your twitter follower stats and analytics information, you can figure out exactly what you need to post to get in your market’s good books.
On the Tweets tab of your Twitter Analytics page, you should see the engagement rate for each post, represented as a percentage, the engagements and the number of impressions. You can also click on a specific tweet to get an in-depth view of the tweet’s performance.

While a high number of impressions might look exciting, you should be looking for a good impression to engagement ratio. After all, if you got 20,000 impressions and only one like, there’s a chance you’re not saying the right thing. Evaluating the performance of your content will help you to determine which types of post get the most valuable responses.
Applying those insights to your future Tweets will make it easier to establish deep, long-lasting relationships with your audience.
6. Brand Follower Growth
Everyone wants to be popular–particularly if you’re a business on social media. While quality over quantity is an important consideration when you’re looking at follower growth, the more people you have in your network, the better chance you’ll have to make a sale.
With Twitter analytics, you can track how quickly (And effectively) you’re growing your follower base. The system allows you to look at your performance on a week-by-week basis, and it goes all the way back to the day you started your account.
If you notice your follower count suddenly starting to go down after a period of sustained growth, this could be a sign that you need to do some reputation management. A bad Tweet, inconsistency with your posting strategy or even a rumor could send your Twitter metrics off the rails.
Watching your follower growth means you can recognize the impact of a bad Tweet before it becomes too serious. However, it also means that you have a great set of numbers to show your boss the next time you need to advocate for your social media campaign.

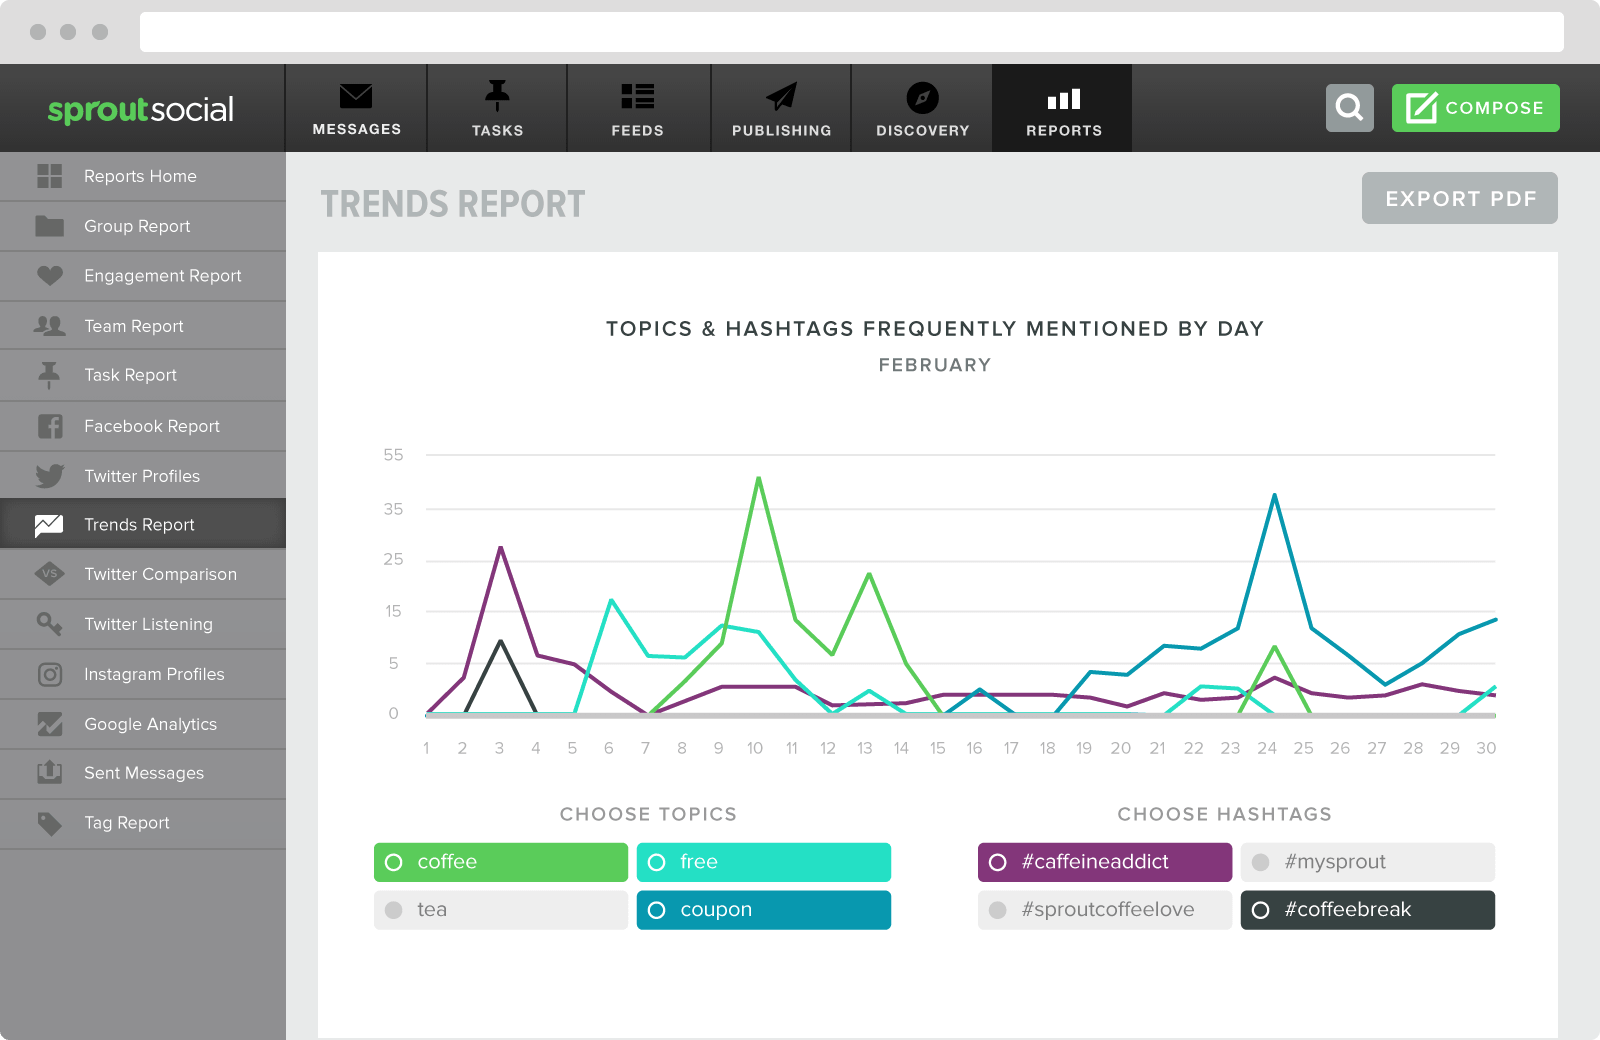
Powerful Twitter Analytics for Social Business
![]()
Powerful Twitter Analytics for Social Business
Powerful Twitter Analytics for Social Business
7. Impressions
While your Twitter follower stats and engagement metrics show you how many people are interacting with your brand, your impressions demonstrate how many people see your account each day. This is a complicated metric to make the most of for several reasons.
Although a high number of impressions and a low number of engagements could indicate that you’re not producing the right content, it could also simply mean that you’re appealing to a very niche audience. Additionally, Twitter counts an impression anytime someone has your Tweet delivered to their stream. However, just because your tweet appears on someone’s timeline, doesn’t mean they’ve read it.

While looking at your impressions can give you a good idea of how many people you can reach, it’s important to take this metric with a pinch of salt.
8. Video Completion Rate
Videos are one of the most popular forms of content. As today’s customers are increasingly drawn to visuals, solutions like Facebook Live and Instagram Stories are drawing more eyes than ever before. While Facebook might be the king of Live video right now, that doesn’t mean you should be ignoring the way your audience responds to your Twitter video campaign.
Video views on your Twitter Analytics page will show you how many people have seen and played your content. On the other hand, Completion rate offers an insight into the number of customers who stuck around for the whole video.
Looking at your completion rate in comparison to your overall number of views will help you to see whether your videos are having the desired impact on your audience. You can also compare completion rate to other engagement metrics like shares, and retweets.

To find your completion rate, go to the More tab on the analytics dashboard. Click on Videos then go to the far-right column where you’ll see video completion rate displayed in a percentage.
9. Hashtag Performance
Ah, the hashtag–Twitter’s most popular creation. Today, it’s almost impossible to run any kind of social media campaign without a hashtag marketing plan in your toolbox.
While you might need to stick to a few specific branded tags over time to help generate more attention for your company, you’ll also need to A/B test some of your hashtags to see which generate the best results. Sprout Social’s outbound hashtag performance analytics can give you a complete insight into your most used hashtags, and most engaging terms.

By learning which tags your customers respond to best, you can ensure that your next campaign is tailor-made to give you the highest levels of engagement. Combine this with your customer insight data, and your information about content preferences, and you’ve got everything you need for a killer campaign.
10. Return on Investment
Finally, the most important Twitter Metrics for some companies will always be the insights that demonstrate how valuable their campaigns really are. Ultimately, you want to make sure that the money you’re putting into your Twitter campaign is coming back to you in the form of new customers, leads and conversions.

The Twitter Analytics tool has its own insight into ROI which you can access by going to the Tweets tab and clicking on the chart at the top for an overview of your organic and paid tweet performance. The chart is interactive, so you can hover over different parts to see your results in any given month.
If your organic impressions are much greater than your paid impressions, no matter how much money you plow into your campaign, this could be a sign that you need do some tweaking.
While there’s no one-size-fits-all guide to the perfect Twitter campaign, when it comes to social media marketing, knowledge is power. Tracking your Twitter metrics will give you the resources you need for measurable social media success.