The new Google Search Console is out! Since the beginning of this year, more and more users have gotten the pleasure of the new functionalities in Google Search Console. After you get used to the totally new interface, you see all the cool stuff it has to offer. One of those awesome features is the 16 months of data in the Search Analytics report. Curious about where you can find this bunch of data? Well, read on then.
16 months of Search Analytics data, where?
The new Google Search Console dashboard looks completely different and uses other words than the ‘old’ Google Search Console does. So first, let’s find out where you can find your precious 16 months of data.
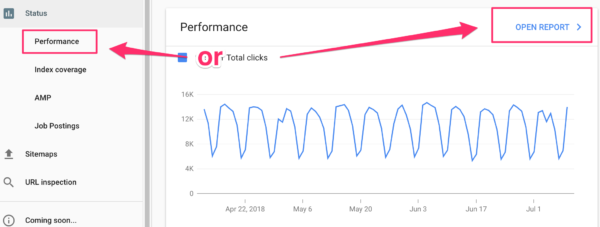
You need to go to the performance dashboard, which used to be Search Analytics. When you get there, you’ll see a cool bunch of stuff already. Like total clicks, impressions, Click Through Rate and your average position. And there are filter types possible, at the top of the page. You can even add new filter options. I’d recommend you play with that – just a little pro tip. One of the filter options is Date, set by default to 3 months.
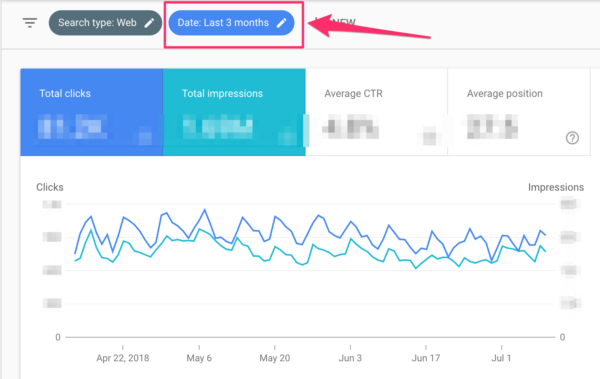
If you click on that Date filter, you can see all the date options available:
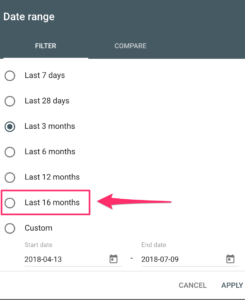
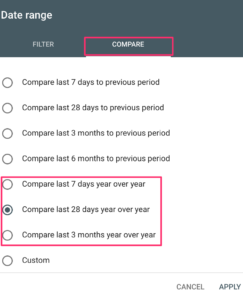
Next to seeing 16 months of data, you can also compare dates. For instance, the last 7 days compared to the same 7 days last year. And at the bottom of all options, you can customize your date range. Clicking on the ‘Last 16 months’ filter will give you an output that looks a bit like this:
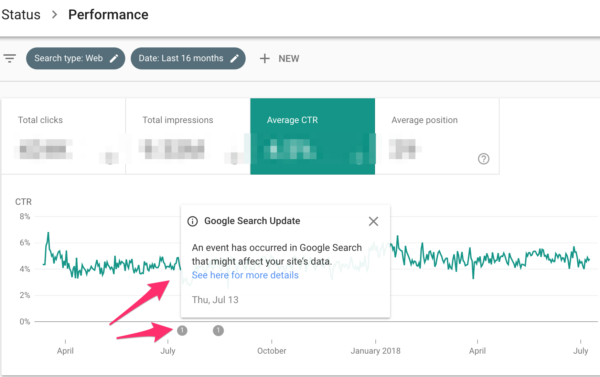
To get something like the screenshot above you need to select the Average CTR only. You can click on all four of the items to see all four in the graph. Now another thing I noticed is these little small grey balls near the x-axis. These are messages from Google Search Console that something happened on a particular date. For this particular website, an event occurred that could’ve affected the data. Now, this is very valuable information because you then know that the data before this date is less precise. And that knowledge is especially useful when you want to compare dates because you now know that you can’t compare a recent date range with a date range before this event.
What to do with 16 months of Google Search Console data
The first thing that comes to mind is that it resolves a lot of frustration. In the ‘old’ Google Search Console, the oldest data you could get was 90 days old. People then just downloaded months old data every month and created their own Google Search Console database. But now, there’s no hassle anymore with getting a lot of data in your dashboard by exporting data sheets and adding it to your main Google Search Console data sheet. If you work for clients who want to see how the website’s done over the year, because they want to know if it’s in line with their KPI for example, that data is now just a few clicks away. Saving you a lot of time – time you can spend on actually optimizing websites – and making them better.
When it comes down to the actual data, having over a year of data means you can do year-over-year comparisons and see if you can spot a trend. Are you doing better than last year? Have your efforts been successful? Analyzing year-long trends in your data in just one click. Looking for things like seasonality is now easier, for example: is April a month in which you get more clicks than in other months? Or how is this June doing compared to last year’s June?
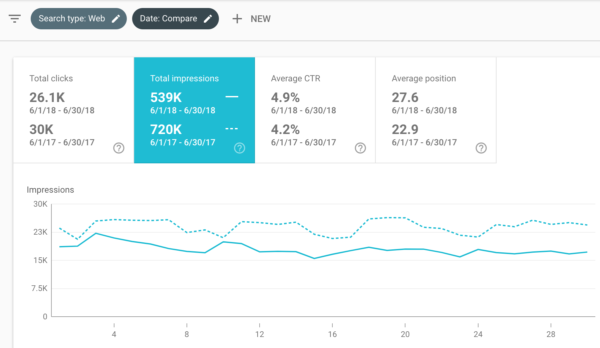
As you can see in the screenshot above, June 2018 had fewer impressions than June 2017 had. June 2018 also had fewer clicks, a lower average position. The only thing that went up was the Click Through Rate (CTR). Looking at a wider time frame will give you more context and can tell you if June 2017 perhaps was an above average good month or if this website is performing worse than it did last year. Those are signs for you to work on your SEO more or that your SEO efforts aren’t taking any effect.
In the Performance report in Google Search Console, you can see more information than just this graph. I’ve set the data comparison to the last 3 months compared to the same months in 2017. If you scroll down you can see more specifics about where your possible drop or rise is coming from.
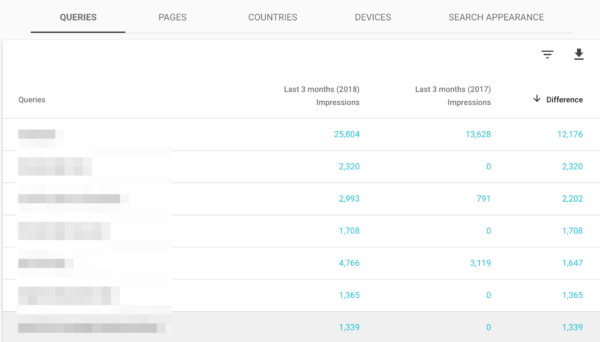
I’ve sorted this grid on where the biggest difference between the last 3 months in 2018 and the same time period 2017 is. Enabling you to quickly identify the difference between the 3 months. If you notice important keywords having fewer impressions now than in 2017, that might be a reason to act. Time to work on your SEO!
You can see Queries, Pages, Countries, Devices and Search Appearance in this grid, and you can add Clicks, CTR and Position to the grid as well. Making it very informative for you to check where your priorities should lie, which keywords and pages to tackle first.
Be critical about the data you’re seeing
Please think about the time frame you’re using when comparing dates. Sometimes it doesn’t make any sense to compare June 2018 to June 2017. Perhaps it makes more sense to compare June 2018 with May 2018. You know your website best, you know when you started optimizing for a certain keyword for instance. Think about what questions you want answered before diving into this bunch of Google Search Console data. Those questions will be the answer to what to look at when you open the Performance dashboard.
At the beginning of this post, we noticed Google Search Console is showing notifications about things that occurred that can affect data:
If you see something similar, please do not compare data with data before these notifications because your data isn’t reliable anymore and you might be drawing the wrong conclusions.
Conclusion
The Performance dashboard in the new Google Search Console lets you analyze 16 months of data. This wider time frame prevents a lot of hassle and there’s no longer need for shoestring solutions to create your own useful Google Search Console database. Making it so much easier to do your reporting. 16 months of data also allows you to make meaningful comparisons and to spot trends. But as always, think about the questions you want answered before diving into a big dataset. Otherwise, you might be drawing conclusions that don’t make any sense.
Read more: How to connect Google Search Console to Yoast SEO and fix errors »