
What began as a way for college students to connect has grown into one of the world’s largest social networks. In turn, it has become one of the best marketing resources too. But in order to be successful on Facebook, you have to dig below the surface and familiarize yourself with the ins and outs of the platform and analytics.
Here are some important Facebook stats—broken down by multiple dimensions—to help guide your social media strategy. Click on the jump links below to skip to each section:
General Facebook Stats
First, let’s start off with some general Facebook stats to paint a picture of why the social network is so important:
1. Facebook Has More Than 2 Billion Daily Active Users
As of June 30, 2017, there are:

Although many social media marketers assume this number will plateau, it’s probably safe to say that Facebook will continue to grow until they run out of new users to sign up. Only a couple more billion to go!
To put these numbers into context, here are the number of monthly active users on other top social media platforms, according to statistics from TechCrunch:
- Youtube has 1.5 billion monthly active users
- WeChat has 889 million monthly active users
- Instagram has 700 million monthly active users
- Twitter has 328 million monthly active users
- Snapchat has an estimated 255 million monthly active users
Facebook Demographic Stats
Over 2 billion users is a lot of people. In order to get a better understanding of who you can potentially reach on the platform, here are some Facebook stats on their audience demographics:
2. 83% of Women & 75% of Men Use Facebook
Overall, Facebook’s gender demographics are pretty evenly split with women slightly more active. According to Pew Research, 83% of women use the network compared to 75% of men.
This is a clear indicator that no matter who you’re trying to reach, they’re likely active on Facebook.

3. People Aged 18-29 Are the Most Prevalent Facebook Users (65+ Is the Least)
The age groups on Facebook break down by use as such:
- 88% of those 18-29
- 84% of those 30-49
- 72% for those 50-64
- 62% for those 65+
Despite being the smallest age group on the platform, Facebook seems to be the best option for reaching older users on social media when compared to other networks. Here’s a breakdown of social media usage of 65+ year olds on other networks:
- 8% use Instagram
- 10% use Twitter
- 20% use LinkedIn
- 16% use Pinterest
- Less than 10% of 50+ year olds use auto-delete apps like Snapchat
If your brand targets an older audience, make Facebook marketing a priority.
4. 82% of Facebook Users Have Attended at Least Some College
Facebook initially started as the brainchild of then-college student Mark Zuckerburg. Before it became the social network we know it as today, it was actually called “Coursematch.” It was developed to allow people to create profiles listing out which classes they were taking.
Perhaps because of this, it’s interesting to consider Facebook use in terms of the highest level of education of users. This use breaks down as such:
- 79% of users are college graduates
- 82% have taken some college
- 77% finished high school or less

Facebook Geo Stats
Facebook’s audience is diverse, which makes it perfect for global brands outside of North America. Here’s a look at some important Facebook stats your brand should know:
5. 85% of Facebook’s Daily Active Users Come from Outside the US/Canada
As some of the above Facebook stats have already hinted at, Facebook is huge internationally. In fact, 85% of Facebook’s daily active users come from outside the US and Canada. India, Brazil and Indonesia have the largest Facebook audiences after the US.
Use this as an opportunity to explore expanding your target audience outside of your core, if it makes sense.
6. More Than 70 Facebook Translations Are Available
In order to support its global audience, Facebook has more than 70 languages available thanks to a framework that lets community members translate text on the platform. At this time, more than 300,000 people have contributed translations for different languages and dialects.
Global brands need to take this into consideration. Use analytics to help you understand the demographics of your audience, and keep an eye out for where large fan bases live. From there you can target your Page posts by location or language.
For example, if you limit the language of your post’s audience to Spanish, it will only be visible to people who:
- Have Spanish set as their language on Facebook
- List Spanish as one of their languages on their profile
People who don’t fit one of those criteria won’t be able to see your post on your Page, their News Feed or search.
Facebook Usage Stats
It’s important to understand how people use Facebook. This data can inform your publishing behavior, ad targeting and other pieces of your strategy. Take a look at these Facebook stats related to how people engage with the platform:
7. 40% of Facebook Users Have Never Liked a Facebook Page
More than 60 million businesses have a Facebook Page. Additionally, 39% of users like or follow a Facebook page to receive a special offer.
Some other Facebook stats that related to Facebook pages include things like:

All of this data leads back to the fact that Facebook Pages are a useful tool for your business. This is especially true in getting the word out and providing quick customer service. People equate quick responses to good customer service, so plan your social media customer service strategy accordingly.
8. People Spend an Average of 35 Minutes on Facebook Each Day
According to data from Nielsen, Americans spend an average of 10 hours and 39 minutes consuming media across their devices. Specifically, five hours per day are spent on mobile devices.

While content consumption is on the up-and-up, it might surprise you to find that the amount of time spent on Facebook per day has actually decreased. The current average amount of time spent on Facebook is 35 minutes per day.
That number is down from 40 minutes recorded just three years ago. This is supported by findings by SimilarWeb, a marketing intelligence firm which claims that people are generally spending less time on social media now than they did before.
With less time spent on Facebook, you have to learn to make the most of every opportunity to get in front of your audience. Think carefully about what you post and have a purpose for all the content you share.
9. People Access Facebook an Average 8 Times Per Day
According to comScore, Facebook is accessed at an average of eight times per day, followed by Instagram (six), Twitter (five) and Facebook Messenger (three).
So while people may not spend as much time on Facebook as they used to, they do tend to check it pretty frequently. One way to maximize your exposure is to schedule your Facebook posts to publish throughout the day, at times when your audience is most likely to be engaged. Not sure when the optimal time is? You can use our ViralPost feature to automatically schedule your posts to publish at the times your followers are most active.

10. 400 New Users Sign up for Facebook Every Minute
Every 60 seconds on Facebook, there are:
- 317,000 status updates
- 400 new users
- 147,000 photos uploaded
- 54,000 shared links

Compared to data from other popular social networks, every minute there are:
- 448,000 Tweets
- 66,000 Instagram posts
- 29 million WhatsApp messages sent
The numbers don’t lie—Facebook truly is the largest social network around, especially because they own two of the aforementioned three companies. So while there have been reports of Facebook no longer being as valuable for marketers as other channels, the user base continues to grow.
11. Everyone on Facebook Is No More Than 3.5 Degrees Separated
Facebook’s own research found that everyone is no more than 3.5 degrees separated. This is far less than the proposed six degrees of separation originally set out by Frigyes Karinthy. As many people use Facebook to keep in touch with friends and family, it’s interesting to see how this use scenario has literally brought the world closer together.

The closeness of users is beneficial for marketers trying to overcome Facebook’s algorithm, which is notorious for slashing organic reach for brands. Instead of trying to get in front of every single user yourself, let your audience do some of the work. Ask people to share your posts with their audience or to like your content. This will give you exposure to their audience which increases your organic reach. If enough people share it, you could even create a viral effect.
Facebook Mobile Stats
It’s no secret that social media (and the internet in general) is primarily accessed on mobile devices. And if the Facebook stats below are any indicator, it’s time for brands to start thinking of content and marketing from a mobile-first perspective:
12. Facebook’s Messenger Has Over 1.2 Billion Monthly Active Users
Facebook’s standalone Messenger App has a cool 1.2 billion monthly active users. And on the topic of mobile data, as of December 2016, Facebook has:
- 74 billion mobile monthly active users
- 55 billion mobile–only monthly active users
- 15 billion mobile daily active users
What this means for brands is you need to get active on Facebook Messenger. The numbers show consumers are all-in, so you should be too. One creative way some brands are using Facebook Messenger is by creating chatbots to facilitate their social customer care efforts.
Not sure how to start? We created our very own Facebook Messenger Bot builder that’s integrated into Sprout Social. So you can create your own bot with ease, and without the need for any complex coding and development.
13. 19% of Time Spent on Mobile Devices Is on Facebook
As we alluded to earlier, the average consumer spends five hours per day on their mobile device. But what’s even more interesting is how that time spent breaks down. As you can see in the chart below, Facebook is the clear leader with 19%.

What is your brand doing to take advantage of the mobile trend?
You can start by creating a seamless mobile experience across all your web properties whether it’s Facebook, Messenger, your website or anywhere else online. Unless you have data to the contrary, you can anticipate most of your social media traffic will be from a mobile device, so prepare accordingly.
Facebook Video Stats
In the past five years, video content has seen tremendous growth. But it’s not just YouTube that’s experiencing an upward shift. Facebook has grown to become a video giant of its own. Here are some stats you need to keep in mind for Facebook video marketing:
14. 44% of SMB Marketers Plan to Spend Money Promoting Facebook Video Content in 2017
One of the most telling signs that marketers are getting serious about Facebook video is that 44% of SMB marketers plan to put money behind their Facebook video content in 2017.
If your brand isn’t invested in video on Facebook, there’s a good chance your competitors are, which puts you at a significant disadvantage.
15. Facebook Gets Over 8 Billion Average Daily Video Views
This Facebook stat illustrates exactly why you’re doing your brand a disservice by ignoring video on the platform. With over 8 billion average daily views and 100 million hours of video watched every day, Facebook has become a top player in the social media video landscape.
Greatist is a popular brand that uses video to boost organic engagement and stand out in feeds filled with text and images.
Follow in their footsteps and jump on the Facebook video train.
16. 85% of Facebook Users Watch Videos With the Sound Off
It would be remiss to end this discussion of Facebook stats without getting into details regarding the use of video on the platform, and how it’s shaking everything up. Some of the most important Facebook stats relating to video include:
The takeaway here is make sure your videos don’t need sound in order to be understood. Taking a little time to add captions could mean the difference between whether or not your Facebook videos get viewed.
17. People Are 5 Times More Likely to Watch Facebook Videos on a Phone
Based on all the Facebook stats we’ve mentioned thus far, this shouldn’t come as a surprise. People are five times more likely to watch video daily on a smartphone than on desktop.
Ensure that your videos are optimized for mobile viewing. Take a look at our always up to date social media video specs guide to get the correct dimensions.
Related Article
Always Up-to-Date Guide to Social Media Video Specs
Staying relevant and capturing your audience’s attention is a constant challenge for marketers. And now that brands rely on video
Read More …
18. 20% of Facebook Videos Are Live Streams
With Instagram Live, Periscope and other services, live video has been bubbling for a while. In fact, 20% of videos are Live Broadcasts. And in June 2016, businesses were streaming six times more live videos on their Facebook Pages than they were in January when live video was first introduced.
Another important statistic to understand is the live element is what’s most appealing to viewers. After your broadcast is finished, the recorded video lives on your page. However, Facebook found that live videos are watched three times longer during the actual stream than the replay.
Facebook Advertising Stats
The key to Facebook’s tremendous growth over the years has been their advertising platform. Marketers spend billions every year to reach their target audience with Facebook Ads. Thanks to low costs and a huge database of user data, Facebook Ads is appealing to businesses of all sizes. Here are some stats to keep in mind for Facebook advertisers:
19. 93% of Marketers Use Facebook Advertising Regularly
Most people have a lot of questions about Facebook advertising. Getting it right can result in some of the best ROI in all forms of advertising. So needless to say—the stakes are high. These Facebook stats shed light on some interesting quirks of advertising on Facebook:
20. Images Account for 75-90% of Facebook Advertising Performance
When it comes to Facebook advertising, in order to be effective, consider the following:

21. 47% of the Value of Facebook Video Ads Happens in the First 3 Seconds
While Facebook video ads can be very effective, you don’t have a ton of time to capture your viewer’s attention. In fact, research from Facebook discovered nearly half of the value from your ads is attained in the first three seconds of the video.

When you create videos for ads, try to capture the viewers attention immediately. That way they’ll be compelled to stick around and see your entire message.
22. 93% of Social Media Advertisers Use Facebook Ads
Facebook is by far the most popular social media advertising channel. According to Social Media Examiner’s 2017 Social Media Industry Report, 93% of social media advertisers use Facebook Ads. The next network that’s even close is Instagram with 24%, but that’s also a part of the Facebook platform.

This is just more proof of how popular and in-demand Facebook Ads are for B2B and B2C brands.
23. 20% of Facebook’s Mobile Ad Revenue Is From Instagram
As you saw in the previous Facebook stat, Instagram is contributing quite a bit to Facebook’s overall advertising numbers. In fact, it makes up 20% of Facebook’s mobile ad revenue, up from 15% last year.
As Instagram continues to grow, this number could potentially increase even more. If you’re currently running Facebook Ads on mobile, consider giving Instagram a try.
24. The Average CPC for Facebook Ads Is $1.72
Curious about whether or not you’re paying too much for your Facebook Ads? The team at Wordstream conducted research to reveal some benchmarks for Facebook Ads.
While other companies have attempted to gather this type of data before, we like Wordstream’s data because it’s broken down by industry. As you can see from the graph below, there are significant differences in CPC for different industries.
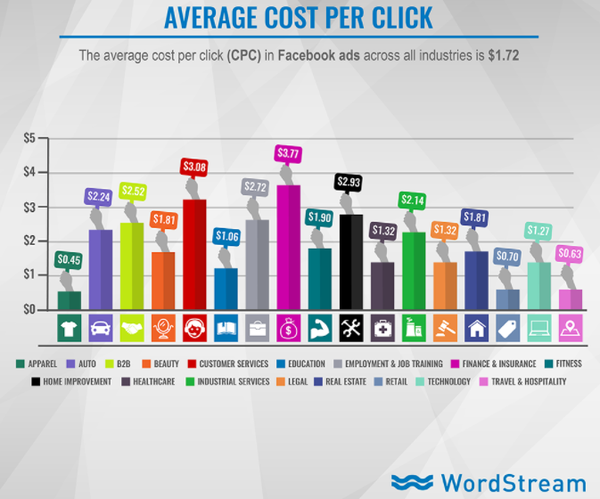
If your average CPC is much higher than your industry average, it could be a sign you need to make some tweaks to your campaigns. If you’re on the low end, you’re probably on the right path.
25. The Average CTR for Facebook Ads Is 0.9%
Wordstream also looked at the average CTR of Facebook Ads by industry. Overall, they found the average CTR to be 0.9%. But similar to CPC, you should look at your industry average rather than the overall.

Facebook Publishing Stats
If you want to improve your brand’s organic reach, a good place to start is by analyzing your publishing behavior. Here are some Facebook stats about publishing that’ll get you on the right track:
26. Organic Reach for Branded Facebook Pages Is 2% on Average
We’ve been hinting at it throughout this entire post—Facebook organic reach is not what it used to be. But just how bad is the situation? Well, one study found Facebook organic reach for brands is 2% on average. The key word being average. There are plenty of brands experiencing even lower levels of reach.
Use Sprout Social’s Facebook Analytics tools to get an idea of how much reach your posts receive. Once you know where you stand, you can take steps to improve it. Check out this article for tips to boost your reach and engagement.
Related Article
6 Essential Steps to Increase Facebook Organic Reach & Grow Your Audience
Far too often, brands spend days devising a Facebook marketing strategy only to see their post go live and ultimately
Read More …
27. Brands Post an Average of 8 Times on Facebook per Day
How many times should you post on Facebook per day? Well according to the SME report, brands post eight times per day on average. How does your posting frequency stack up?
If you’re not getting the reach or engagement you’d like, consider increasing your posting frequency a bit. The same SME report found that 39% of marketers planned to increase their Facebook posting frequency over the next 12 months. Just monitor your analytics to make sure posting more often is helping rather than hurting your brand.
28. The Best Time to Post on Facebook Is Weekday Afternoons
A burning question on every marketer’s mind is when is the best time to post on Facebook? With so many conflicting studies out there, we decided to roundup the data from as many credible sources as we could find and average out the data. Here’s a chart that outlines our findings:

As you can see, weekdays have a significantly stronger correlation than weekends. And afternoons between 1 p.m. and 3 p.m. tend to be the preferred times.
While this data gives you a great starting point, you ultimately need to rely on your brand’s own analytics. You can use our Facebook reporting suite to identify your most engaged posts and the time they were published. Then you can start to schedule more of your content to be shared around those times.

20 Powerful Facebook Stats Your Brand Can’t Ignore in 2017
Knowing how to use a platform is just as important as actually making use of it. By keeping these up-to-date Facebook stats in your arsenal, you’ll be better prepared to create an effective Facebook marketing campaign.
Are there any particularly interesting Facebook stats we missed? Tweet at @SproutSocial with your insights, and we’ll share the best ones!