
As you plan your Instagram marketing strategy for 2020, it’s important to know the latest facts about this very popular social network. To make sure you’re working with the right information, we’ve compiled all the most important Instagram statistics you need to be aware of this year.
Fast stats for Instagram
1. Instagram is the second-most downloaded free app in the Apple app store
Only YouTube had more downloads in 2018 (2019 statistics are not yet available). That’s a good indication that Instagram is continuing to attract new users—as verified by the Instagram user statistics you’ll see later in this post.
2. Instagram is the 10th most popular Google query
About half of the top 10 searches are generic terms like weather, news, and videos. But Facebook, Google, YouTube, and Amazon also feature in the top 10, and all ahead of Instagram.
However, since Instagram is not primarily used through a web interface, the app’s high download rank is a more relevant figure.
3. Instagram is currently hiding like counts and video views in 7 countries
Instagram started hiding like counts in Canada in April, and in six more countries in July.
Those countries are:
- Australia
- Brazil
- Canada
- Ireland
- Italy
- Japan
- New Zealand
However, that doesn’t mean that Likes no longer matter. In fact, since 41% of Canadian content creators said engagement dropped after like counts were hidden, it means it’s more important than ever to create powerful Instagram content that inspires engagement.
Instagram user stats
Who exactly is using Instagram? These Instagram user statistics reveal the details of Instagram’s audience right now.
4. 1 billion people use Instagram every month
That makes Instagram the second-ranked traditional social network in terms of active users, behind Facebook. When considering all social platforms, Instagram ranks fifth – behind Facebook, YouTube, Whatsapp, FB Messenger, and WeChat.
5. 500 million people use Instagram Stories every day
In the three years since its launch, Stories has become a huge part of what makes Instagram so popular.
With half a billion people using Stories every single day, it’s clear that Stories are an important channel for brands. (You’ll find more Instagram Stories stats throughout this piece that further emphasize this point.)
6. 89% of users are outside the U.S.
Of Instagram’s one billion users, only 110 million are located in the United States. Americans are the largest Instagram audience, but they’re very far from the majority. Rounding out the top five countries for Instagram users are:
- Brazil: 70 million users
- India: 69 million users
- Indonesia: 59 million users
- Russia: 40 million users
This is important information when thinking about how to define your target audience on Instagram, and what kind of content to create.
7. Instagram will reach 112.5 million U.S. users in 2020
That’s a 5.4% increase over 2019, as estimated by eMarketer, which also predicts the network will reach 117.2 million U.S. users in 2021.
Sure, we just told you that the U.S. audience represents only 11% of all Instagram users. But it’s still an important audience that’s growing consistently.
8. Instagram is the fastest growing social media platform in Canada
Instagram’s growth numbers in Canada are even more impressive. The social network saw 20.4% growth in Canada in 2018, and 7.3% growth in 2019. eMarketer predicts further growth of 6.1% in Canada, to 12.6 million users, in 2020.
9. The country with the highest Instagram percentage reach is Brunei
Brunei might not have the most Instagram users, but it is the country where Instagram reaches the highest percentage of the population: 60%, to be precise. Compare that to 37% of people in the U.S. (see below).
Rounding out the top five countries with the highest%age reach are:
- Iceland: 57%
- Turkey: 56%
- Sweden: 55%
- Kuwait: 55%
If you’re marketing to people in these countries, Instagram could be an especially effective platform for both organic content and paid Instagram posts.
10. 37% of American adults use Instagram
That’s a slight increase from 35% in 2018. Keep in mind that the%age of people using Instagram varies substantially by age group, as the network is far more popular with younger users:
- 18–29: 67%
- 30–49: 47%
- 50–64: 23%
- 65+: 8%
Again, you’ve got to do your research to determine the age breakdown of your own followers, but these Instagram user statistics provide a good starting point for thinking about your buyer personas.
11. Instagram is the most popular traditional social network among U.S. teens
Only YouTube is more popular with teens, and there’s some debate about whether to classify the video-sharing site as a social network. Seventy-two percent of U.S. teens say they use Instagram, compared to 69% for Snapchat and 51% for Facebook.
However, teens say they use Snapchat more often.
12. The gender mix on Instagram is pretty even: 52% female and 48% male
However, in the U.S., a substantially higher percentage of women (43%) use Instagram than do men (31%).
This discrepancy shows that you can’t make assumptions about demographics on Instagram—or any other social network. And you definitely can’t make assumptions about the demographics of your own followers. Instead, use social media analytics tools to get detailed information about your own audience, for a better content strategy and ad targeting.
For more details, check out our post that breaks down all the key Instagram demographics for social media marketers.
Instagram usage stats
Now that you know who’s using Instagram, let’s look at some Instagram usage stats to reveal how they’re using the network, and how often.
13. 63% of Instagram users log in at least once per day
And 42% check multiple times per day. Only 16% log in less than once per week.
You’ll need to do some research to figure out exactly when your particular audience is likely to be online, so you can figure out the best times to post.
14. Instagram users will spend an average of 28 minutes per day on the platform in 2020
eMarketer predicts this minor increase from 27 minutes in 2019. In comparison, time spent on Facebook is slightly decreasing. Instagram saw more time spent per day than Snapchat for the first time in 2019.
15. 200 million Instagram users visit at least one business profile daily
So, what are Instagram users doing during those 27 minutes? A large portion of them are checking out business profiles. Is yours one they might want to visit?
16. 62% of people say they have become more interested in a brand or product after seeing it in Stories
If you’re not using Stories yet, this is one of those Instagram stats that strongly suggests you might want to start. Not sure what to post on Stories? We made a list of 20 Instagram Stories ideas to get you started.
17. 11% of U.S. social media users shop on Instagram
Not surprisingly, the top reasons for using Instagram are looking at photos and videos. But more than one in ten users are using the platform specifically to shop or find new products.
Earlier in the buying cycle, people are using Instagram a lot. Fully 81% of people use Instagram to help research products and services.
18. 130 million Instagram users tap on shopping posts every month
Like the Instagram stat above, this shows that people are making purchases directly from Instagram.
Shoppable posts are still a relatively new feature on Instagram, and the even newer checkout feature makes it possible to buy products without even leaving the Instagram interface. If you’re not using shoppable posts yet, check out our post on how to sell products on Instagram.
19. More than 50% of Instagram accounts use Explore every month
The Explore tab is a place for Instagram users to discover new content and new accounts to follow. Getting your content featured on Explore is a key way to expose your brand to new followers.
20. For back to school, Instagram users posted twice as many red apple emojis as green
Why should marketers care? It’s true this is a pretty random Instagram statistic. But it shows that even small differences can affect how well people connect with something.
There’s no logical reason why people should prefer red apple emojis to green apple emojis, but they do. Could this extend to their preference for apple color in Instagram posts or ads? Only testing can tell you for sure—just like testing is the only way to know for sure what colors, words, and content types connect best with your audience.
Trend alert! #BackToSchool is upon us, which means ????????????????????????????????????. pic.twitter.com/V9JsHuJiT7
— Instagram (@instagram) September 13, 2019
21. The heart love sticker is the most popular Giphy sticker in Stories
And the most used face filter is heart eyes. Meanwhile, the red heart emoji was used 14 billion times in 2018.
22. 14% of U.S adults use Instagram as a news source
That’s nowhere near the percentage of people who get news from Facebook (52%), but it’s still worth considering when thinking about how to roll out new product launches and other brand announcements. Women make up the majority (62%) of news consumers on Instagram.
Instagram ad stats
23. Instagram’s potential advertising reach is 849.3 million users
That’s 14% of adults aged 13 and over. This represents a 5.9% quarter-on-quarter increase in advertising reach in Q3 2019.
24. Instagram advertisers can reach a youth audience of 52.9 million
To be specific, this Instagram stat refers to users aged 13 to 17. That makes Instagram third in terms of youth advertising reach, behind Facebook (113.3 million) and Snapchat (66.9 million).
25. Brands pay Instagram influencers between $100 and $2,085 per post
On average, of course. For videos, brands pay an average of between $114 and $3,138, and for Stories they pay between $43 and $721.
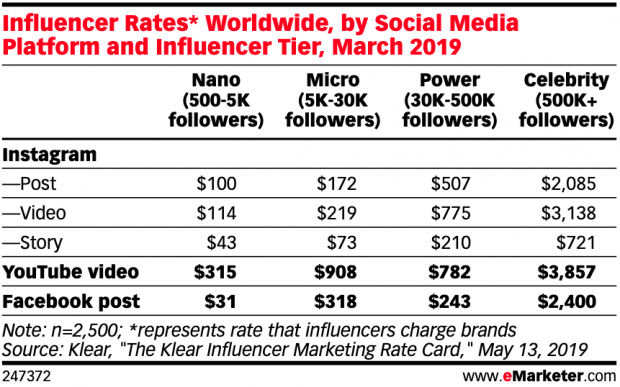
Of course, this information is just a starting point to consider when thinking about how much to pay Instagram influencers for your own campaigns.
26. U.S. Marketers spend 69% of their influencer budgets on Instagram
That’s way more than on any other network. YouTube comes in second at just 11%. If you’re planning to incorporate Influencer marketing into your strategy, Instagram is the best place to start.
Why do brands work with influencers? And how effective is this strategy? Get the details in our post on how to make the most of influencer marketing.
27. U.S. marketers spend 31% of their Instagram ad budget on Stories
They spend the other 69% on newsfeed. That’s a mix of about ⅓ Stories and ⅔ newsfeed. It’s a good balance to consider when planning your own Instagram advertising mix.
28. Instagram will earn $12.32 million in ad revenue in 2020
According to predictions by eMarketer. That’s a big jump from $9.08 million in 2019 and just $6.18 million in 2018. Instagram’s ad revenue growth is outpacing that of its parent company, Facebook. That indicates brands are feeling more confident in Instagam’s ability to convert.
29. 73% of U.S. teens say Instagram is the best way for brands to reach them about new products or promotions
That’s significantly higher than the next-best options, Snapchat (49%) and email (37%). If you’re marketing to Generation Z, Instagram is your go-to platform.
Instagram publishing stats
Here are some fast brand publishing stats for Instagram.
30. 75.3% of U.S. businesses will use Instagram in 2020
That’s the prediction from eMarketer. They suggest only Facebook will beat out Instagram, with 87.1% of U.S. marketers using that network. If your business is not yet on Instagram, you should know that your competition is likely already using this powerful tool.
31. Brands post an average of 2.5 Stories per week
If you’ve been feeling overwhelmed by the idea of incorporating Stories into your Instagram mix, this stat may provide some relief. To stay on par with other brands, you don’t need to be posting Stories every day.
32. One-third of the most viewed Stories are from businesses
Stories are a more laid-back and intimate form of content on Instagram, but they can be very powerful for businesses.
However, you can’t just repurpose your Instagram newsfeed posts for Stories. We’ve got seven tips to help you build a powerful Stories strategy that can help you catch up to other brands.
33. 60% of businesses on Instagram Stories use an interactive element every month
That includes location tags, @-mentions, polling stickers, and so on.
They’re using these interactive features for good reason. The polling sticker increased three-second video views in 90% of beta campaigns, and Dunkin’ Donuts saw a 20% lower cost-per-view when they used the sticker.
34. Brand Stories have an 85% completion rate
That’s a big year-over-year jump from 69%. This may be because brands are using shorter Stories now, with an average of 5.2 frames in 2019 compared to 6.9 in 2018.
However, longer Stories have greater reach. That means the ideal length of a Story depends on your specific goal.
35. Instagram represents 10.7% of social referral share to ecommerce sites
That’s way less than Facebook’s 80.4%, but more than any of the other social networks.
Instagram video stats
36. Stories stickers enhance video performance 83% of the time
However, for photo Stories, using two stickers actually reduces performance. Instagram’s parent company, Facebook, recommends using stickers when they “help communicate key information about your brand or product,” but avoiding them if they “contribute to visual clutter.”
37. How-to tutorials are the most popular form of Instagram video content
Followed by behind-the-scenes posts, interviews, and news coverage. Buzzfeed’s Tasty videos may be the best known example of how-to videos on Instagram. Think about what kind of fun, quick, easy-to-implement instructions related to your business or niche you could convert into a short Instagram video.
With these stats in mind, it’s time to put a successful Instagram strategy into action. Use Hootsuite to schedule and publish Instagram posts, engage with your community, and track the success of your efforts. Try it free today.
Learn More
