It’s easy to have a love/hate relationship with Google Analytics reports.
On one hand, it presents every single of piece of information needed at one’s fingertips.
On the other hand, it’s even easier to go down a rabbit-hole when presented with too much information.
As marketers, we only have so much time in a day.
We are tasked with moving quicker and making faster decisions.
When making strategic decisions in PPC campaigns, these five reports help get me information faster.
My favorite go-to Google Analytics reports will help:
- Expand audience targeting in PPC campaigns.
- Expand PPC keyword selection.
- Create additional converting Display Placement audiences.
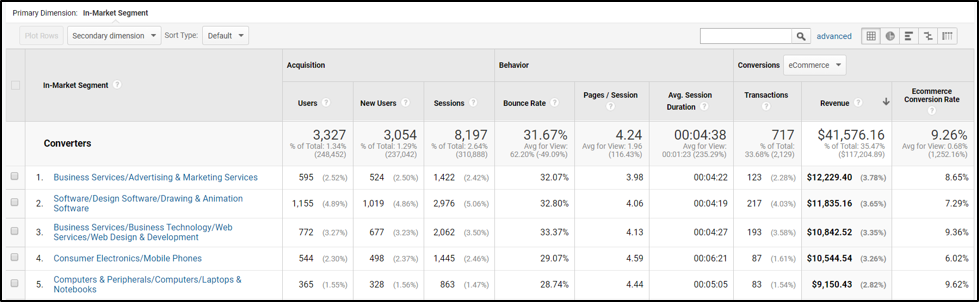
1. Interest: In-Market Segments Report
With the recent update of Google’s match types, close variations have taken over campaigns.
As a result, targeted keywords are more loosely managed.
Because of this, the importance has shifted to understanding the behavior of our target audiences.
This report in Google Analytics shows exactly that.
To find this Google Analytics report, navigate to: Audience > Interests > In-Market Segments.

This report shows the types of In-Market segments (for Google Ads) of users who have been on your website and purchased.
The key features of this report include:
- Segment by past purchasers to understand how these In-Market segments behave.
- Sort by highest revenue or conversion rate.
- Layer these converting audiences into PPC campaigns.
- Create new campaigns targeting these users.
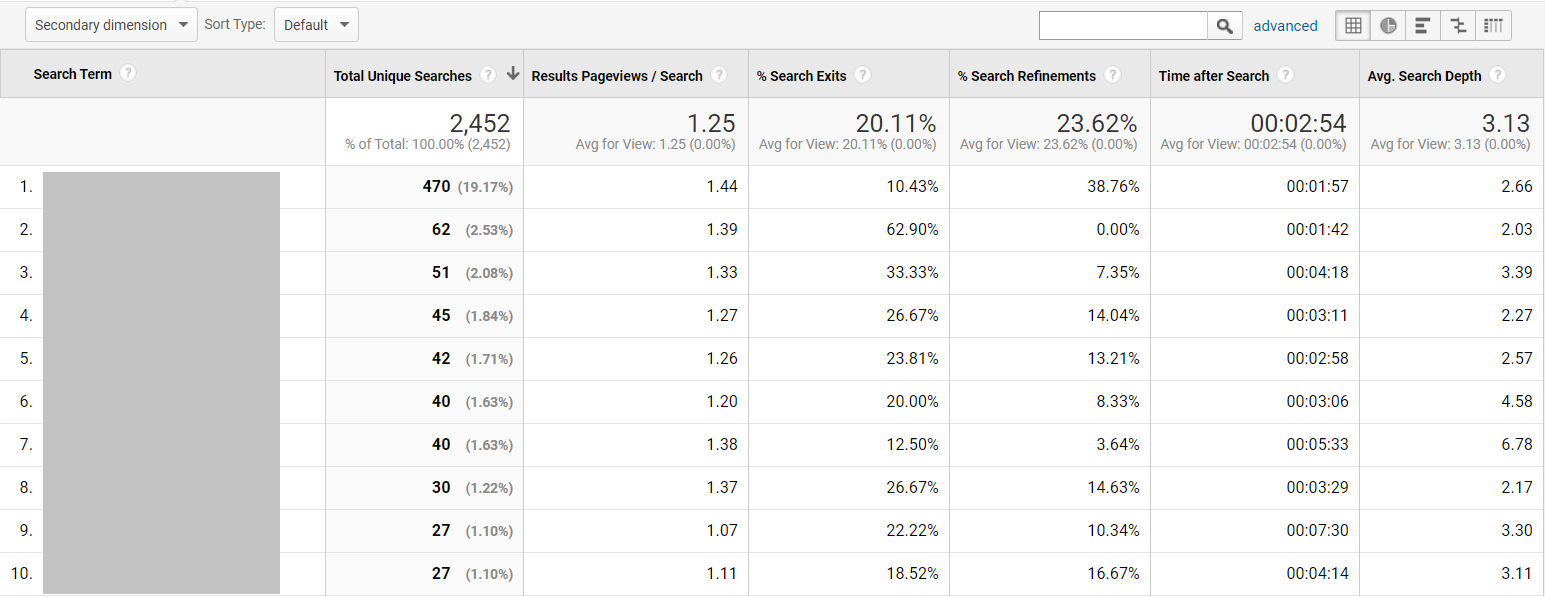
2. Site Search Report
This report is useful for many reasons aside from PPC.
By utilizing this Google Analytics report, you can understand how users are searching to find what they need on the website.
By using Site Search, it can help inform keyword strategy or expand keyword list based on real user behavior.
You’d be surprised how large of a gap there can be of how we feel a user searches vs. how they actually search.
The Site Search report can also help the overall branding team to understand if there are gaps in products offered.
For example, say you have a wedding invitations website that has a decent product assortment for different themes.
When using the Site Search report, there is an influx of searches for “rustic” – but none of the website designs have that rustic feel!
This can inform product marketing that there is a demand for this type of product.
Now, you’re on your way to expanding product assortment to meet a user’s needs.
A win-win for everyone!
To find this report, navigate to: Behavior > Site Search > Search Terms
3. Referrals Report
This report is highly underrated.
The Referrals report shows the top websites that have sent traffic to a website and if a user eventually purchases.
To find this report, navigate to: Acquisition > All Traffic > Referrals
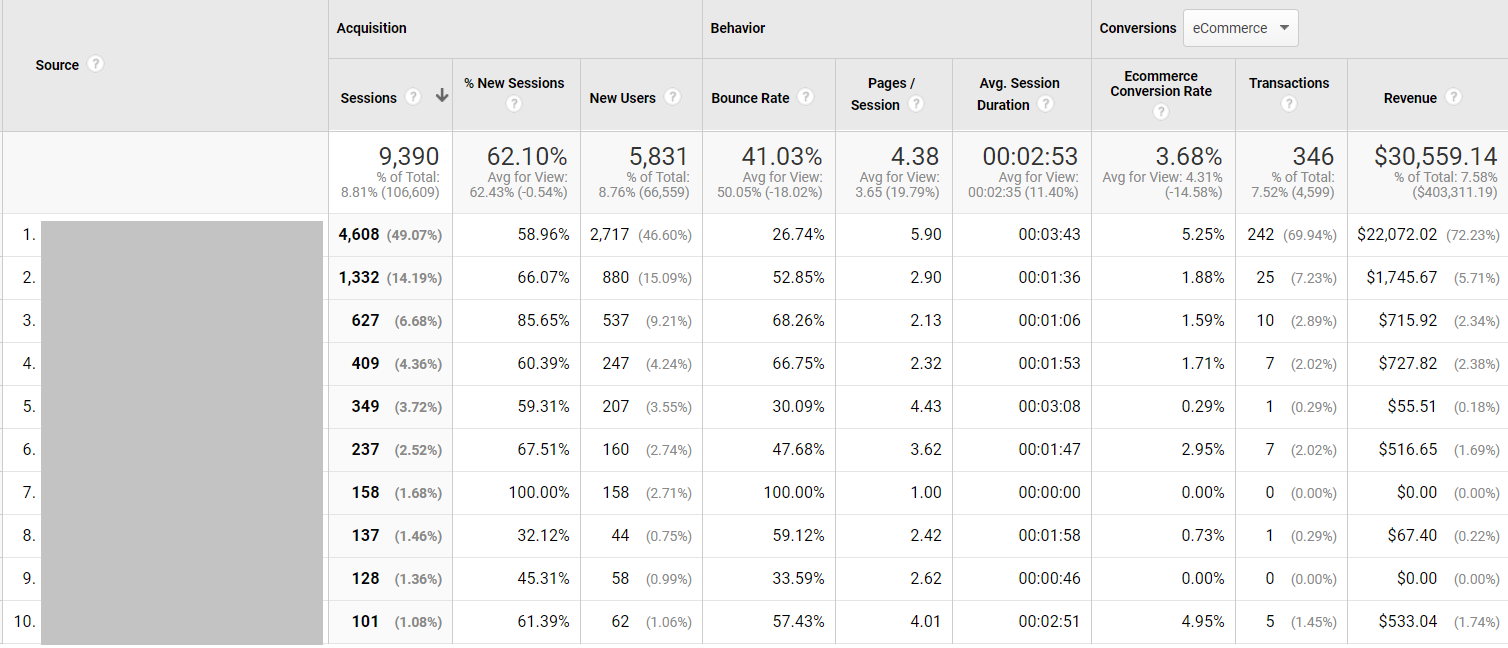
By analyzing this report, you can get a better understanding of how users are finding the brand.
To take it one step further:
- Create a list of top referral websites.
- Create a “Placements” audience for a Display campaign in Google Ads.
This is a great way to expand PPC efforts responsibly because the referral websites that are known to have quality traffic to your website.
4. Top Conversion Paths
As marketers, we often get asked how “Top of Funnel” campaigns are doing.
Leadership wants to make sure the dollars are being sent efficiently – and rightfully so.
This Google Analytics report helps analyze and understand “Top of Funnel” behavior.
Because YouTube and Display campaigns have different goals and objectives than Search campaigns, having a holistic view of how long it takes a user to eventually make a purchase after seeing one of these ads is beneficial.
With this report, I recommend the following:
- Sort by “Source/Medium” path.
- Add a secondary dimension of “Campaign Path”.
- Filter by “CPC” and also “Campaign Name” specific to the YouTube or Display campaigns in question.
To find this report, navigate to: Conversions > Multi-Channel Funnels > Top Conversion Paths
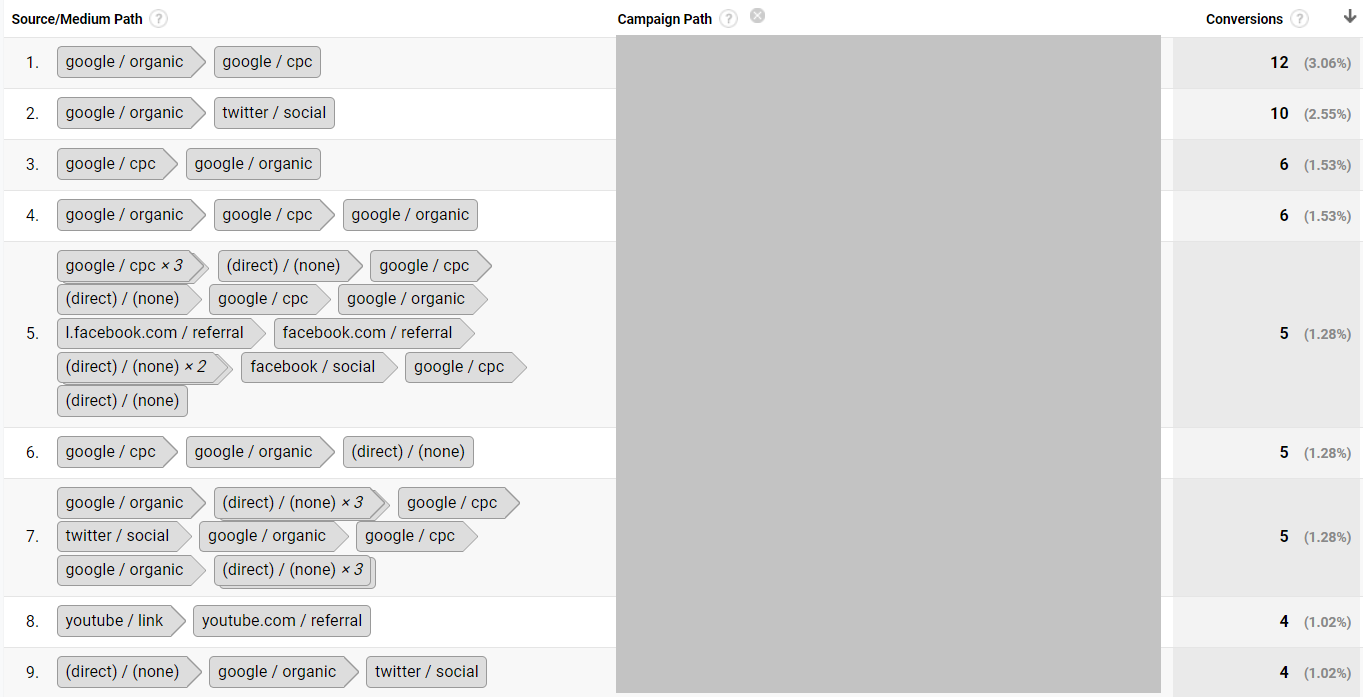
In the example above, we found that our YouTube campaigns were generating not only assisted conversions, but direct transactions as well.
By providing clear evidence, we were able to support the ask for additional dollars in Upper Funnel tactics.
Another win-win for all parties involved!
5. Geo-Location Report
This one may be a no-brainer, but surprisingly an overlooked report that can help your PPC performance.
Oftentimes, once a target location is set, we let it sit.
Location performance is an easy setting to overlook.
If campaigns are performing well, what’s the point of changing anything, right?
Wrong!
The Locations report will show top users by city, but also revenue and conversion rate.
This is a crucial step in optimizing and maintaining performance in PPC campaigns.
What I typically look for is the ratio of users by area vs. the amount of revenue and conversion rate in that same area.
If there is a large influx of users in a state but low revenue, do I want to continue to spend money in a place that’s not converting?
Of course not!
Consider bidding down on those areas or potentially exclude them altogether.
To find this report, navigate to: Audience > Geo > Location
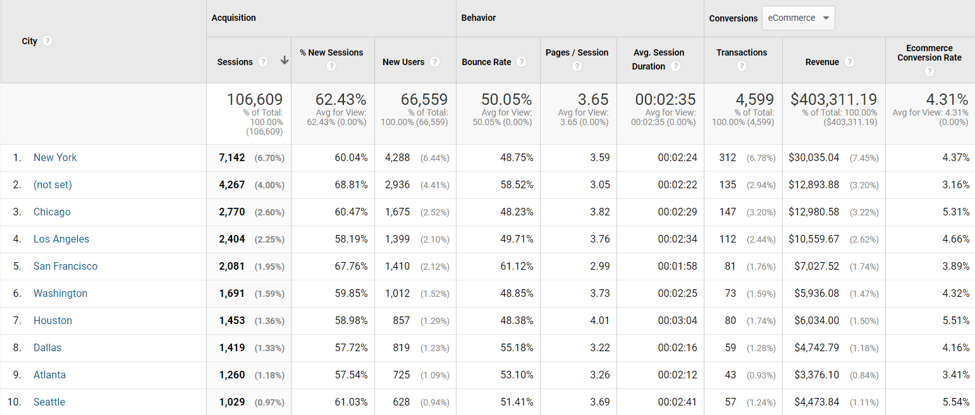
In the example above, I see that New York has the highest amount of sessions, as well as highest amount of overall revenue and high conversion rate.
This indicates that I should, at minimum, test increasing bids in that area because of historical high performance.
I may decide to test increasing bids in the top 10 areas that convert overall.
Use this report as a guide to cross-reference where your PPC campaigns are showing to users and if there are gaps in performance.
Simple optimizations such as location bid adjustments can make significant impacts over time in PPC performance.
Conclusion
Do I look at these reports every day or every week?
Honestly, no.
The Google Ads platform has built out its own additional robust reporting features and when I’m making daily and weekly optimizations, I have a lot of useful information at my fingertips there.
By utilizing these five Google Analytics reports on a monthly or quarterly basis, performance can be looked at from a holistic view.
It’s always important to take a step back from the “day to day” optimizations in Google Ads to have a better understanding of how PPC fits into overall channel performance.
By reviewing other reports not necessarily made for PPC, you’ll have the upper-hand in making strategic improvements that can supercharge your campaign performance.
More Resources:
Image Credits
Featured Image: Pexels
Screenshots taken by author, February 2020