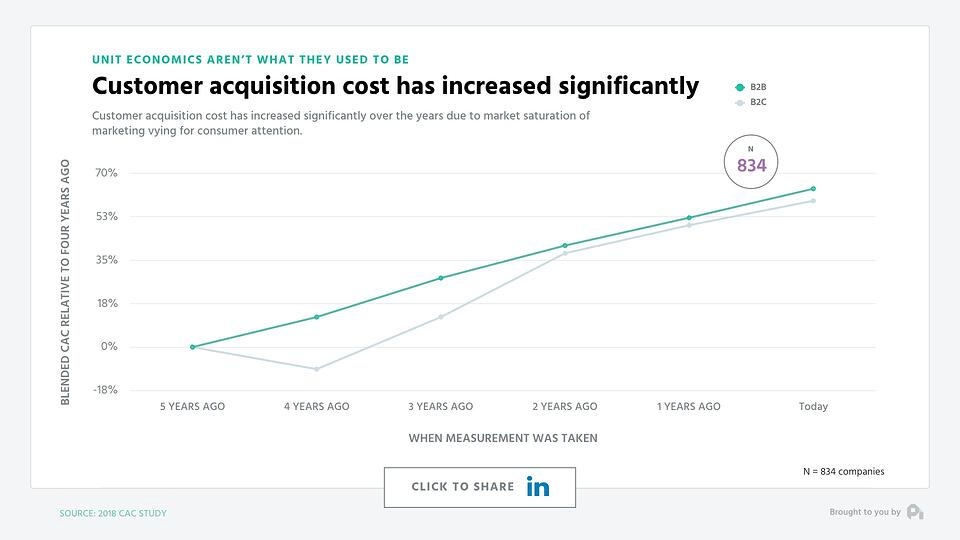
Let’s face it, marketing online isn’t easy. New competitors are springing up every day, and customer acquisition costs are rising for both B2C and B2B companies as a result.
Here’s data from ProfitWell that shows just how significantly customer acquisition costs have risen in recent years.

In this increasingly competitive digital landscape, a lot of marketers are turning to conversion rate optimization to let them do more with what they have, and A/B testing is a core part of this.
What is A/B testing?
A/B testing in digital marketing, also known as split testing, is the process of displaying different versions of a page (in an email, app or website) to various segments of your audience to see which page performs better based on certain metrics.
For example, if you were A/B testing a product description in your eCommerce store, you’d create two variations of the page and only change the description in one version.

After showing your audience segments these two separate pages, you can then calculate which version has a higher conversion rate. That page becomes your champion or control.
Why do A/B testing?
How many times have you created a newsletter using so-called “best practices”? Are you sure that your newsletter is the best possible version to drive conversions?
A/B testing removes all the guesswork and replaces it with data. This systematic approach of continuous testing means that your campaigns are always improving, and you’ll see your success metrics boosted as well.
We A/B test because there’s always room for improvement. It allows us to cover all our bases because when there’s a bottleneck, it affects the entire system.
Testing is so important because a lift in your conversion rate can have cascading benefits for your entire company.
This diagram from Conversion Rate Experts shows how just doubling your conversion rate can affect so much down the line:

A/B testing allows you to clear bottlenecks in your funnel, which boosts conversions, decreases cost, and increases revenue.
Let’s look at how A/B testing works.
How A/B testing works
A/B testing allows you to fine-tune elements of a page, driving you towards predetermined objectives. This process of observation and reiteration are the pillars of A/B testing.
There are two main aspects of a standard A/B test:
- The Control: Also known as the champion, this is your current/winning version of a page. It can either be a version of a page that outperforms all the others or just the version you start with.
- The Challenger: Also known as the treatment. This is a version of the control, but the only difference is the element you’re testing.For example, if you were A/B testing a subject line, the only difference between the control and the challenger would be the subject line. The challenger can also be called a variant. A variant is any version of a page included in the test.For instance, if you make three versions of a page with different CTA colors, then you have four variants. In this case, there are three challengers and the control you’re comparing them against.
The winning version of a page is selected when it’s been statistically proven to outperform the other variants.
For instance, let’s say you’re testing whether a long or short email newsletter leads to a higher click-through rate for your campaigns. You wouldn’t be able to prove that one is better than the other, by just comparing their conversion rates from a single test.
This is where a lot of A/B tests, that start out with good intentions, fail. You can’t be certain that a variation is better from that test alone because there are too many factors at play.
Some of these factors that can affect the result of your test include: the time the email was sent, what day of the week it was, and how many people have seen the email.This is why we rely on statistical analysis to increase our level of certainty in our test results.
Statistical significance and confidence intervals
When running A/B tests, two terms you’ll run into often are statistical significance and confidence interval.
Statistical significance is the probability that a variant of your test outperformed others for reasons other than luck. When an A/B testing tool tells you that a variant has a 95% chance of beating the original (95% probability of statistical significance), it means that your test results aren’t random.
Confidence intervals, show you with a level of certainty, where your result will fall between a range of values. It’s important to know your confidence interval because it accounts for the uncertainty present in all A/B tests.
Most tools express confidence intervals with a 95% certainty by default, because this means that the true value is more likely to be within the interval range.
Here’s an example that shows how confidence intervals affect an experiment:

Here, the results show that there’s a 95% chance that the conversion rate for a variant will fall at 3.26% (give or take 0.39), and the original conversion rates fall at 1.23% (give or take 0.24).
What this means is both conversion rates have an upper and lower confidence limit. Look at the same conversion rates with their limits displayed:

Since the upper limit of the original (1.47%) is less than even the lower limit of the variation (2.87%), we can be confident that variation 1 will outperform the original.
But even statistical significance and confidence intervals can fail if you don’t have enough data, which brings us to the importance of having adequate sample sizes.
Sample sizes
The sample size is the number of observations made in any statistical setting. That is the number of units pulled from a population through which assumptions about that population can be drawn.
For example, if I was trying to figure out what the average yield count was in an apple orchard of 1,000 trees, but I only used two trees in my calculation. In this case, I’d have a very small sample size, and wouldn’t be able to accurately predict the true average yield.
As a rule, the smaller your sample size, compared to the population size, the less accurate your experiment is.
Sample size can make or break your test, which is why it’s best to come up with an adequate sample size before getting started.
For example, take a look at this diagram:

In this test, where the variation had only been exposed to 110 visitors and converted once. It’s clear that the variation failed and the original should be kept. However, ten days later:

As the sample size increases to 620 visitors who converted 106 times, the results changed significantly.
The lesson learned is to always make sure your sample size is large enough before concluding your experiments. There are tools like ConversionXL’s A/B testing calculator to help you determine the sample size you need, before running an accurate test.
How does A/B testing compare to multivariate testing?
The main difference between the two is that an A/B test compares which version converts better by changing a single element on the page. Meanwhile, multivariate testing works by checking what combination of elements converts better.
For instance, if you were trying to figure out which combination of a headline and widget would convert better, you’d do a multivariate test like the one below:

By the end of the test, you should know with a degree of certainty which combination will increase conversions.
Now that we’ve covered the mechanics of how an A/B test works, let’s look at how we can actually run one.
How to implement an A/B test
A/B tests can be tricky to implement because you have to decide what tests to prioritize, and also have to watch out for errors in your experiment.
Tal Raviv, a senior product manager at Patreon, recommends that every growth team uses what he calls an experiment doc for testing.
“An experiment doc is a set of short sections that force us to think through why we’re doing an experiment, what we think will happen, how we’re going to measure it, and whether it’s even worth doing,” says Tal.
Even though experiment docs aren’t strictly for A/B tests, it fits perfectly with our need to prioritize, reduce error, and iterate fast.
It all starts with a hypothesis.
1. The Hypothesis:
This is where all growth experiments should begin. It’s the reason the experiment is being run in the first place.
In this section, you need to think through and write down the purpose of the test:
“What do you believe about your users’ behaviors/feelings/motivations?” “What makes you think this?” Essentially, write down your hypothesis: “What is the experiment trying to confirm?”
For example, a valid hypothesis could be: “I believe that our pricing page has too many different pricing plans, which confuses users when they’re trying to make a choice. I believe this because I’ve spoken with customers who said they felt confused prior to picking a plan.”
2. Prediction:
In this section, you answer the question: “If your idea is implemented, what do you think will happen?”
For the example above, that answer could be:
“We predict that by reducing pricing plans to just two, we could drive up the rate of new paid users because it would greatly increase the ease of choosing a plan.”
3. Predicted impact:
This is where you prioritize what to test. You do this by answering two questions:
- Is this experiment worth running?
- In the best case scenario, how would this impact our company’s metrics?
To get these answers, you should create a table with your metrics today and the predicted change after your idea is implemented.
Here’s a predicted outcome table from Patreon:

In this experiment, Patreon modified the checkout page for their pledge flow and calculated that even a small lift would justify the change.
If a predicted change has a big enough impact on business metrics, then you should test it. If it doesn’t, you should move onto predicting the impact of another test.
4. Experiment Design
This section is where you cover your bases to ensure your findings will be statistically valid. Remember what we mentioned earlier about statistical significance, confidence interval, and sample sizes?
You have to make sure your test is designed in an error-free way. There are a lot of tools that can help you run valid experiments on any platform, such as:
Optimizely
Google Optimize
A/B test calculator
Vero, for newsletters and workflows
Tal advises that when it comes to sample sizes, you should go for the highest percentage you can, a 50/50 split if possible.
However, you can use a lower percentage, if the area of the product is high-risk (payment-related), or if you happen to have multiple experiments running in parallel and want to minimize saturation effects.
5. Instrumentation
This part covers all the KPIs and metrics relevant to your test. It’s the place where you note what events and properties you want to track.
You can always exclude tracked data after a test, but you can’t go back to collect something that hasn’t been tracked.
Tal suggests being explicit about what it’s going to take to measure your results. It should cover UTM parameters and what you’re going to call them, events, and even the platforms that data will be found in.
You’ll be using this section to QA your analytics once you launch your experiment.
6. Learnings
After the test, this is where you collect everything you’ve learned about your hypothesis and user model. You’ll evaluate in this section if a test had a positive and statistically significant improvement on your metrics.
Did your hypothesis fail or succeed?
7. Next steps
The experiment is wrapped up and you’ve learned from it.
What you do now depends on your result, and it goes one of three ways:
- If your hypothesis was correct and there were statistically significant gains from your experimentation, then it’s time to set up the variant as the champion.
- If it was wrong, you’ve learned from it and now know more about your users and product. This can be the basis for further experimentation down the line.
- If your results are still uncertain, then you should continue your test and get a larger sample size over a longer time period.
No matter the result though, testing should never end. As you keep improving and learning about your users, it forms the groundwork for more experiments that can make your campaigns even more effective.
Growth is less about one time tactics and strategies, and more about a process of continuous improvement.
A/B tests can help remove the bottlenecks in your campaigns and is a powerful way for any growth-focused company to boost business metrics and KPIs.