Google Data Studio is definitely a Seer Interactive favorite in terms of free data visualization tools. Ask someone on our team how they got their report visuals to look that good, and you’ll likely hear all about Data Studio.

The premium version, Google Data Studio 360, is exclusive to Google Analytics 360 Suite customers and provides enhanced analytics capabilities vs Google Data Studio (BETA).
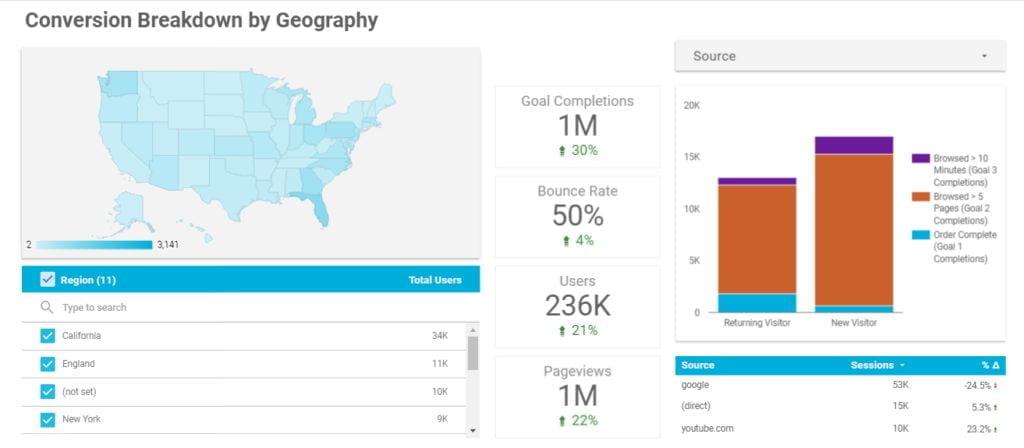
So, why exactly is it our favorite free data visualization tool? Data Studio integrates data from a variety of sources for reporting and analysis. It makes it easy to turn data into insightful, interactive, and shareable visualizations.
Initially, it may be difficult to move towards a more visual, interactive layout of your business and marketing data. This is especially the case if you’re coming from using data aggregators (e.g. Acquisio, Marketo) or in-platform report builders (e.g. Google AdWords, Google Analytics) for reporting and analysis.
You may be tempted to simply replicate the dashboard you already use into Data Studio and report on the data the same way in Data Studio.
This is a big missed opportunity. Why? Because Data Studio’s real benefits lie within its interactivity, integration, and collaboration. It is not meant to be a default layout of metrics for every type of dimension in the interface. Rather, think of a Data Studio dashboard as a one-stop source of truth for marketers, analysts, and stakeholders alike, to get a real idea of how business is performing both holistically, and from an ad hoc perspective.
Keep reading for a beginner’s guide and tutorial to Google Data Studio.
It’s incredibly difficult to build any type of Data Studio dashboard or report without knowing the metrics you will be including. In addition, there are still many limits to the capabilities of Google Data Studio and certain dimensions and metrics will cause errors if blended together unwillingly.
We highly recommend creating a strategic reporting matrix FIRST, in order to identify the business questions your dashboard should answer.
Make a Copy of This Google Sheet

If your Data Studio dashboards and reports don’t answer specific questions directly related to your business goals, they lose their value.
Once you can determine the dimensions and metrics required in the reporting matrix, move on to sketching out your dashboard.
Check Out This Data Studio Dashboard Wireframe

Even if it doesn’t seem relevant to you or you are short on time, skipping the wireframing process can add tons of dead hours to your project timeline.
If you skip wireframing, you’ll likely spend the bulk of your time just moving charts around and playing with the layout. Sketching a rough layout of how the charts and visual elements will be arranged and where they will be on your dashboard makes the final build easier and quicker to get through. Check out Moqups and Wireframe.cc, free and easy to use wireframing tools that can definitely help out in this process.
Once you’ve completed your Data Studio reporting matrix and dashboard wireframe, it’s time to start building!
Open This Data Studio Dashboard Example
In order to ensure consistency across pages and reports, make sure you set a dashboard theme upfront. Trust me, it’s incredibly smart to get a theme out of the way before you start adding elements to each page. It can save you tons of time and effort in the end because the theme you choose carries across the whole-report.
- Add a New Image to the top-left of the page, set it as your businesses’ or agencies’ logo.
- Add a Date Range to the top-right of the page, set it to automatically be the ‘Last 30 Days’ (you can change this at any time but 30 days is typically a good baseline for most dashboards).
- Add a Data Control to the top-middle of the page (this particular step is optional, to be used if necessary). Select the applicable data source you wish to control upon placement.
- Add a Line Break below the header, make it a decent-size and standout color. The line break serves to differentiate to the user which elements are unchanging and consistent (i.e. essential to the functionality of the dashboard) and which are fluid (i.e. change with the page/report/etc).
Report-Level Themes: Brand Color Palette, Font Selection
- Choose your Color Palette (your brand colors are a good place to start!)
- Set your Font Family (your brand’s font family is ideal!)
- Select an optimal Font Size (consider text readability and scale of importance!)
Page-Level Elements: Canvas Size, Chart Filters, Shape Layouts
- Choose ‘Screen (16:9) Portrait’ as the Canvas Size for best results in terms of scannability and digestibility.
- Use shapes to section the page layout, simple rectangles work best for differentiating between data sets.
- Group data filters with charts (optional, to be used if necessary), if you want to allow users to further drill down on specific data sets. Chart-level filtering is most useful if the end-user (ex. a digital marketing manager) who actively uses Data Studio’s wide range of interactive features in the ‘View’ mode. This is oftentimes because group filtering replaces and/or adds to filters set at the chart-level within ‘Edit’ mode.

Building a Google Data Studio dashboard can be a long process, save yourself the time and energy by following the tips I provided in this strategic guide.
If you want to use your data to make decisions, but don’t even know where to start, get to know the Seer Analytics Team (@SeerAnalytics) and how we can help you achieve your 2018 marketing goals.