What reports do you look at in Google Search Console?
- Is it the backlinks to your site?
- Or, your crawl errors to see if you need to implement any 301 redirects?
- Do you think of adjusting your URL parameters at all?
You can use Google Search Console for pretty much everything.
Known as Google Webmaster Tools for nearly a decade, Google rebranded its suite of tools as Google Search Console in 2015.
With every new year, Google has given us new tools, analytics, and data to track in Google Search Console.
The new version of Search Console, announced in January, is now officially out of beta.
So that meant it was time for a refresh of our complete guide to the Google Search Console.
Let’s face it, between the excess of AMP errors and the fear of Google algorithm updates; Google Search Console can become a system of copy/paste without any actions.
To offer a helping hand, below I break down the basics of Google Search Console.
From Fetch as Google to the Index Coverage report, you’ll be giving your SEO reports a mini upgrade on the regular. Plus, I share my monthly SEO health checklist.
Read on – the HTML improvements are calling your name.
What You’ll Learn about Google Search Console
To make reading easier, this article is divided into four sections; each is a central area within Google Search Console:
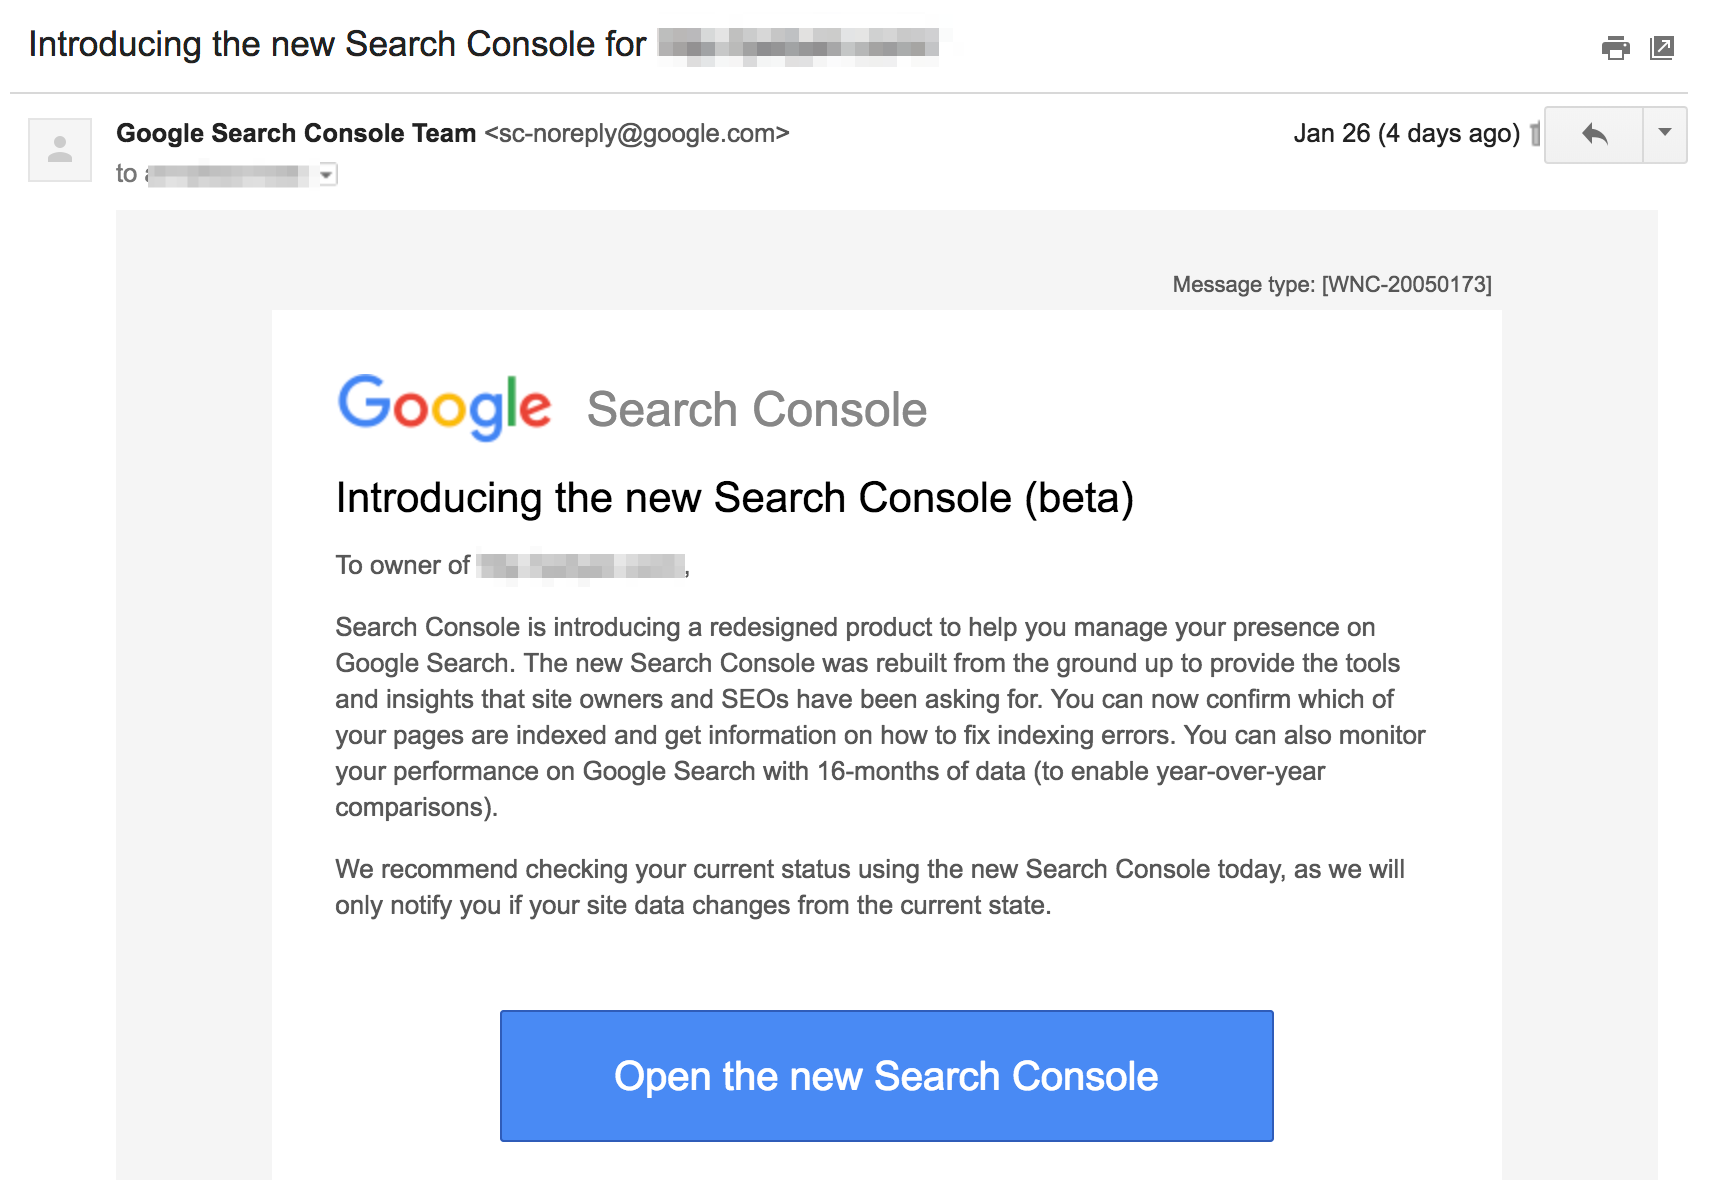
Also, by now, you should have received a notice in your Messages in Google Search Console or an email from Google. It should look something like this:
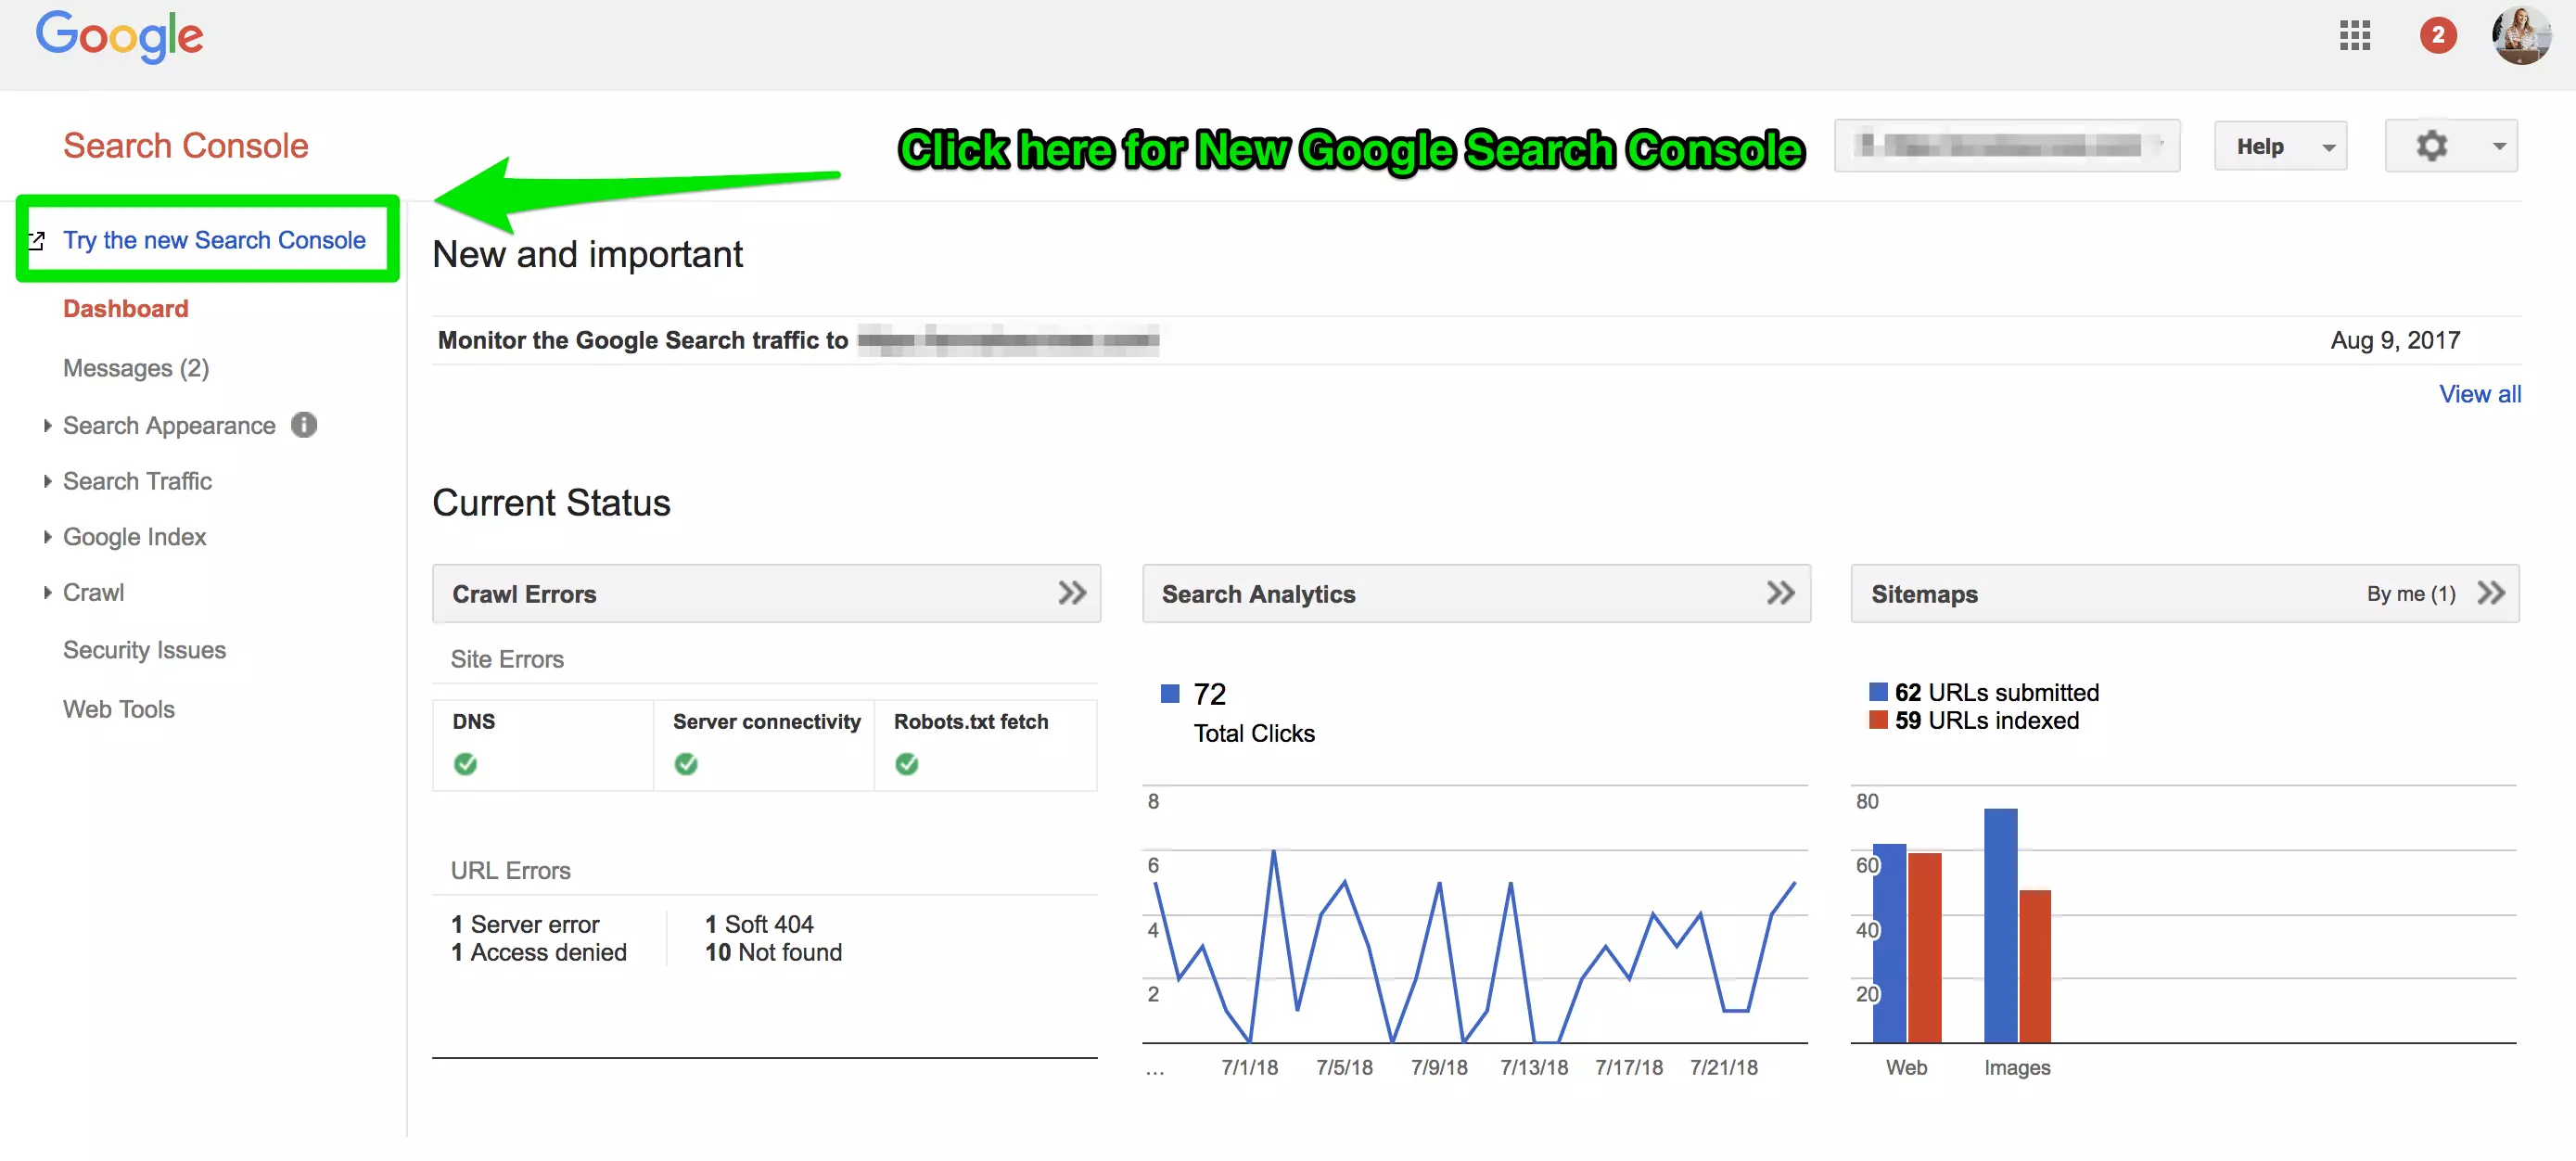
To find the new Google Search Console, log in the same way you previously did.
In the upper left corner, you will see “Try the new Search Console.”
And, if you’re interested in how both the old Google Search Console and the new Google Search Console compare, I walk you through that in this video.
Search Appearance
As an SEO professional, I use the Search Appearance section in Google Search Console to do a lot.
You want it to tell you the secrets to getting your structured data working and if your AMP pages are active. You love it when they say you have no error codes.
Just tap the Search Appearance tab in the left menu bar to view the all the reports and tools. Let the nerding out begins!
Structured Data
What does Structured Data in Google Search Console tell us?
Any website owner, local business, or organization can understand the woes of implementing structured data. You add the code to your site, but it’s still not showing in the SERPs.
Luckily, Google has done all the hard work for us.
After you’ve added the code to your website, pop into Google Search Console > Search Appearance > Structured Data to check for errors.
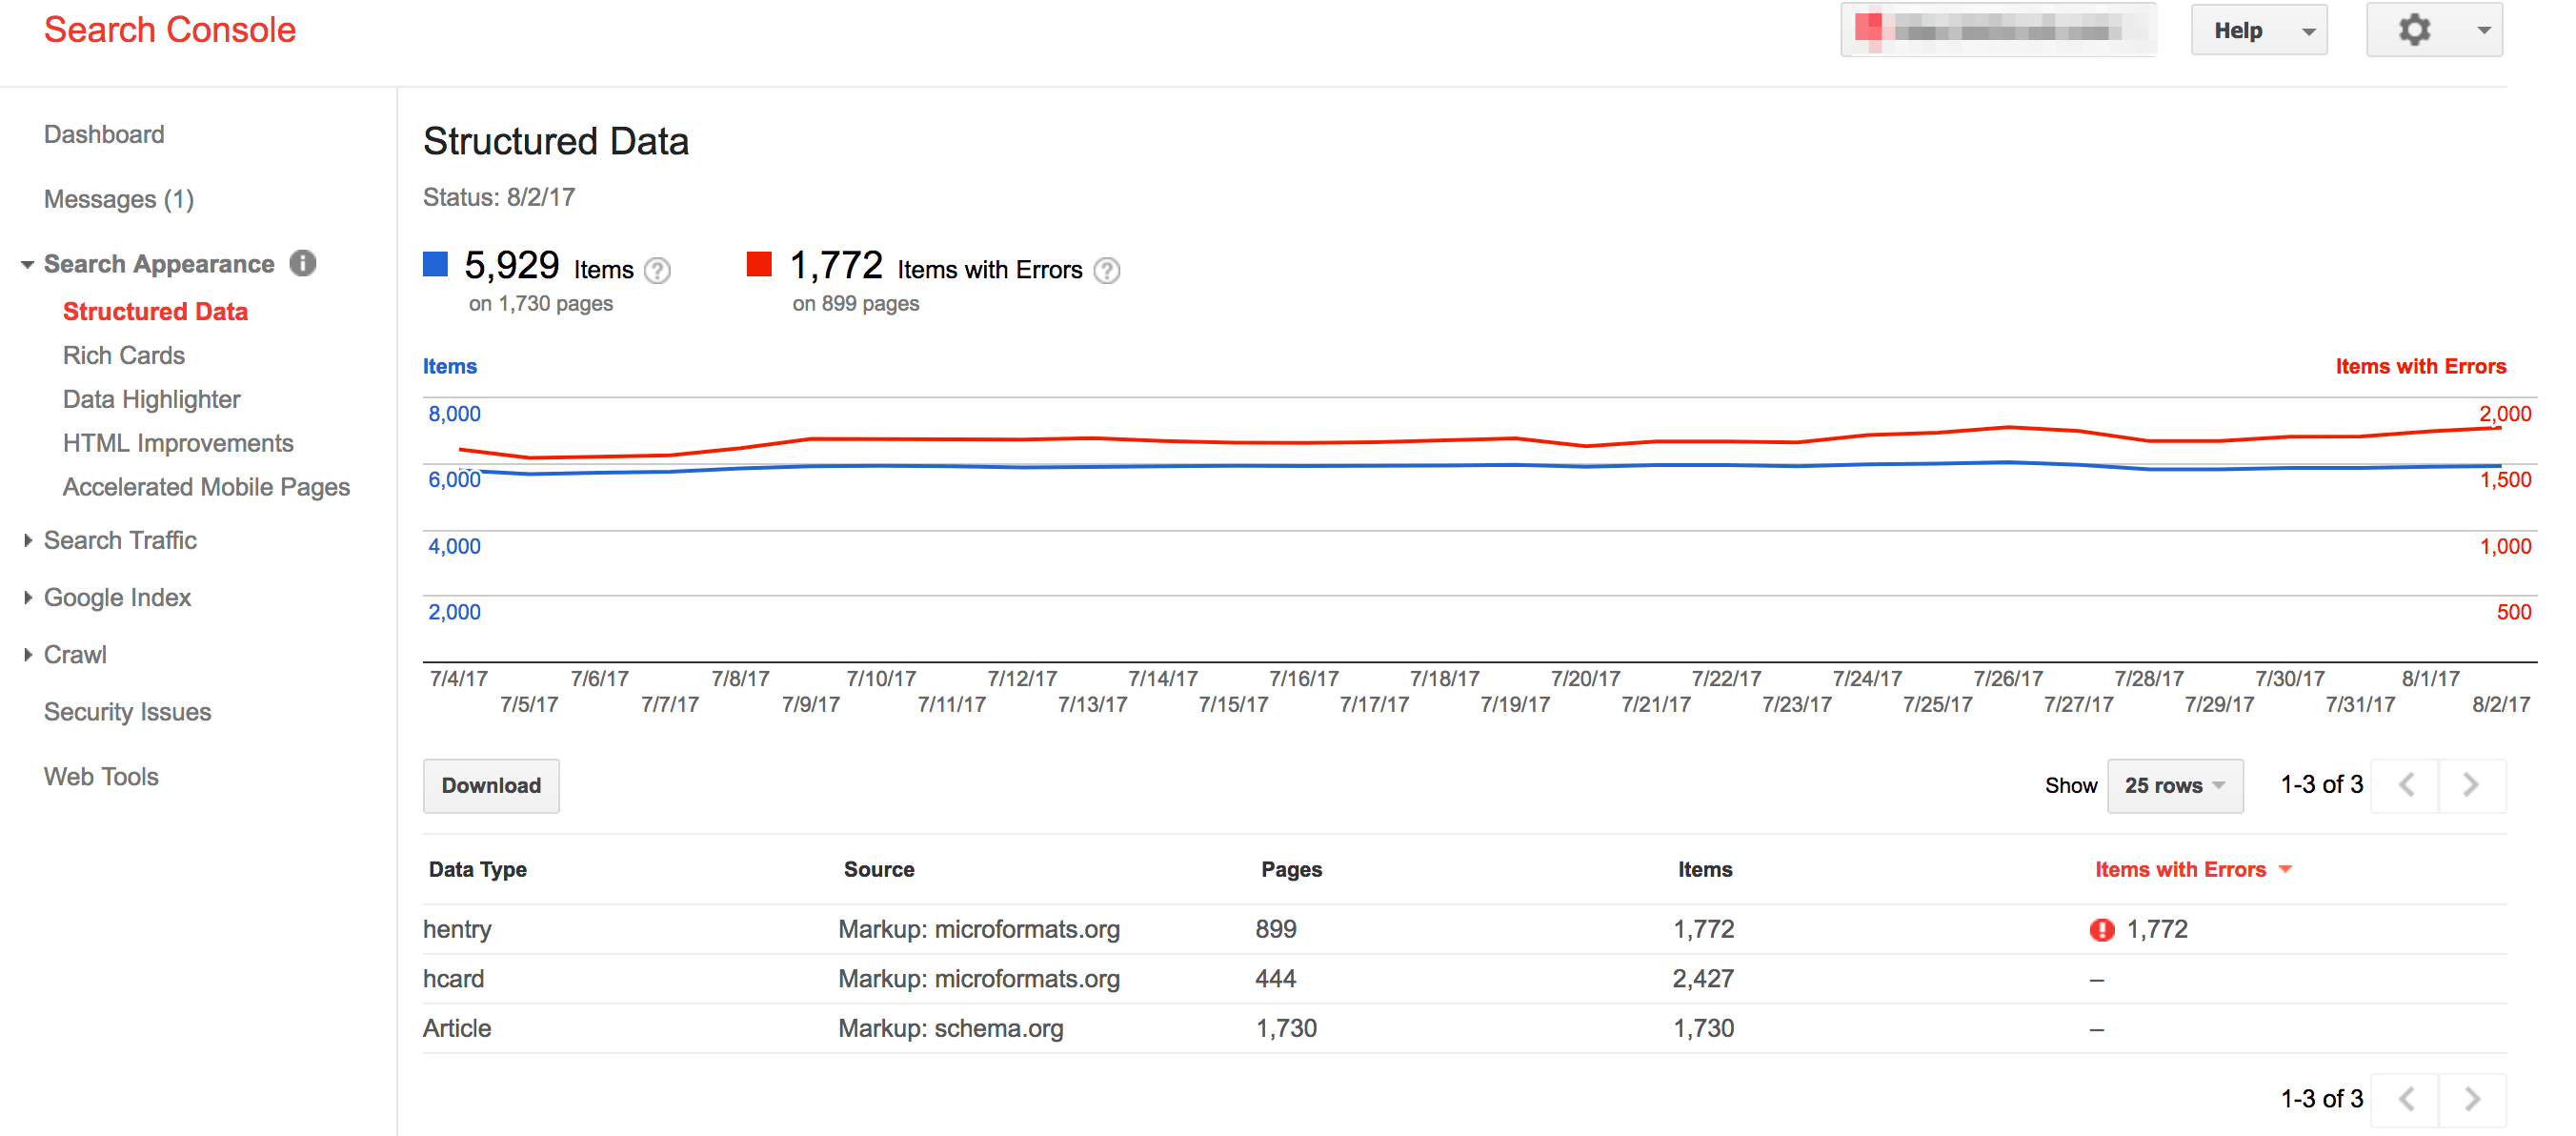
You might see something like this:
How do I fix Structured Data in Google Search Console?
No matter what structured data you’ve used (local business, blog posts, author, organization, etc.), there’s something in this report for you. If you use this report, you may even begin to see increased CTRs, and pages indexed in your future.
Even though structured data isn’t a ranking factor and your site won’t lose rankings if you leave these errors, it is better for the user experience if you fix these errors.
To fix structured data in Google Search Console, you’ll want to analyze each error individually. You can use the Structured Data Testing Tool to help work through these errors.
Let’s use the example above. This site has 899 pages with 1,772 hentry errors.
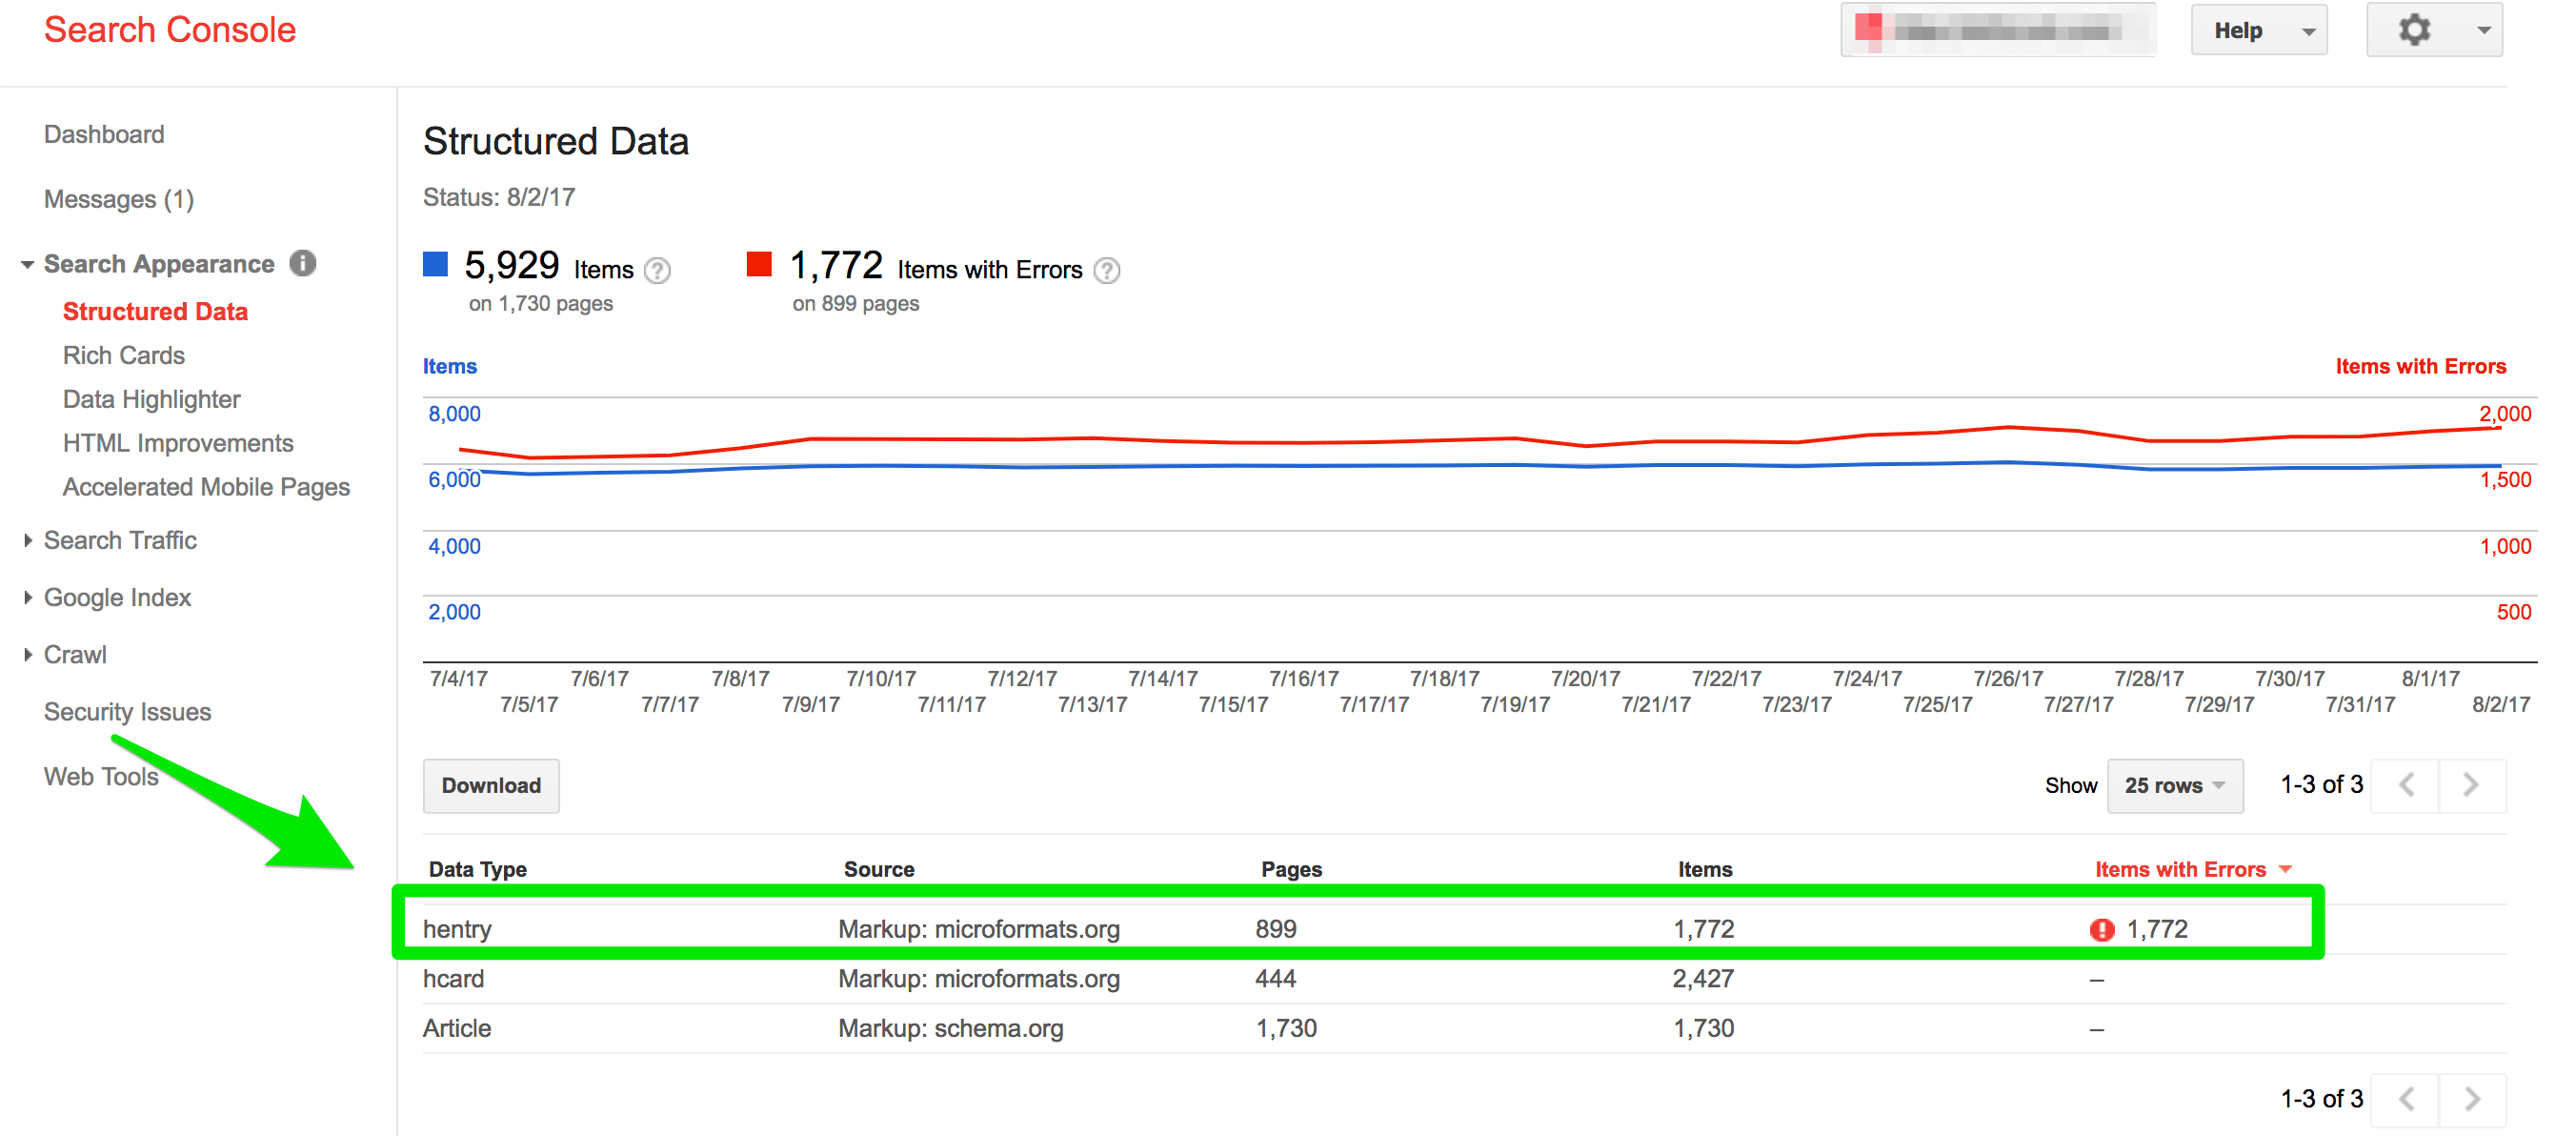
I know that hentry structured data must contain a title and author to avoid errors. These 899 pages with the 1,772 hentry errors are all from the category pages on the blog.
These category pages that host the blogs should not be marked with the hentry structured data, so I need to remove the code from these category pages.
If you work with a developer, I’d suggest collaborating with them on a fast solution if you have a large number of pages like this.
Rich Cards
What are Rich Cards in Google Search Console?
When was the last time you searched for [bourbon maple jam recipe] on your smartphone? Or scanned Google search results for movie times?
There is a time and place for Rich Cards in the SERPs – if you’re a recipe, course, movie (television not reported), or job. And, if you’re the kind of SEO professional who likes to track errors and performance of your hard-earned Rich Cards, then Google Search Console is the place to go.
The report will show you how many Rich Cards are indexed and if there are any critical errors.
How do I get Rich Cards to show up in Google Search Console?
Now, you can’t create Rich Cards for everything — recipes, courses, movies, and jobs are only fair game for now.
Rich Cards in Google Search Console use schema data to display content in a more engaging format, which can improve the mobile experience.
The Rich Cards report monitors rich snippets, schema, AMP, and App Indexing.
Once you’ve created your Rich Cards, you can use this report to see what cards are being indexed and if there are any errors. If you see errors in Google Search Console, most likely your Rich Cards are not being displayed in the SERPs.
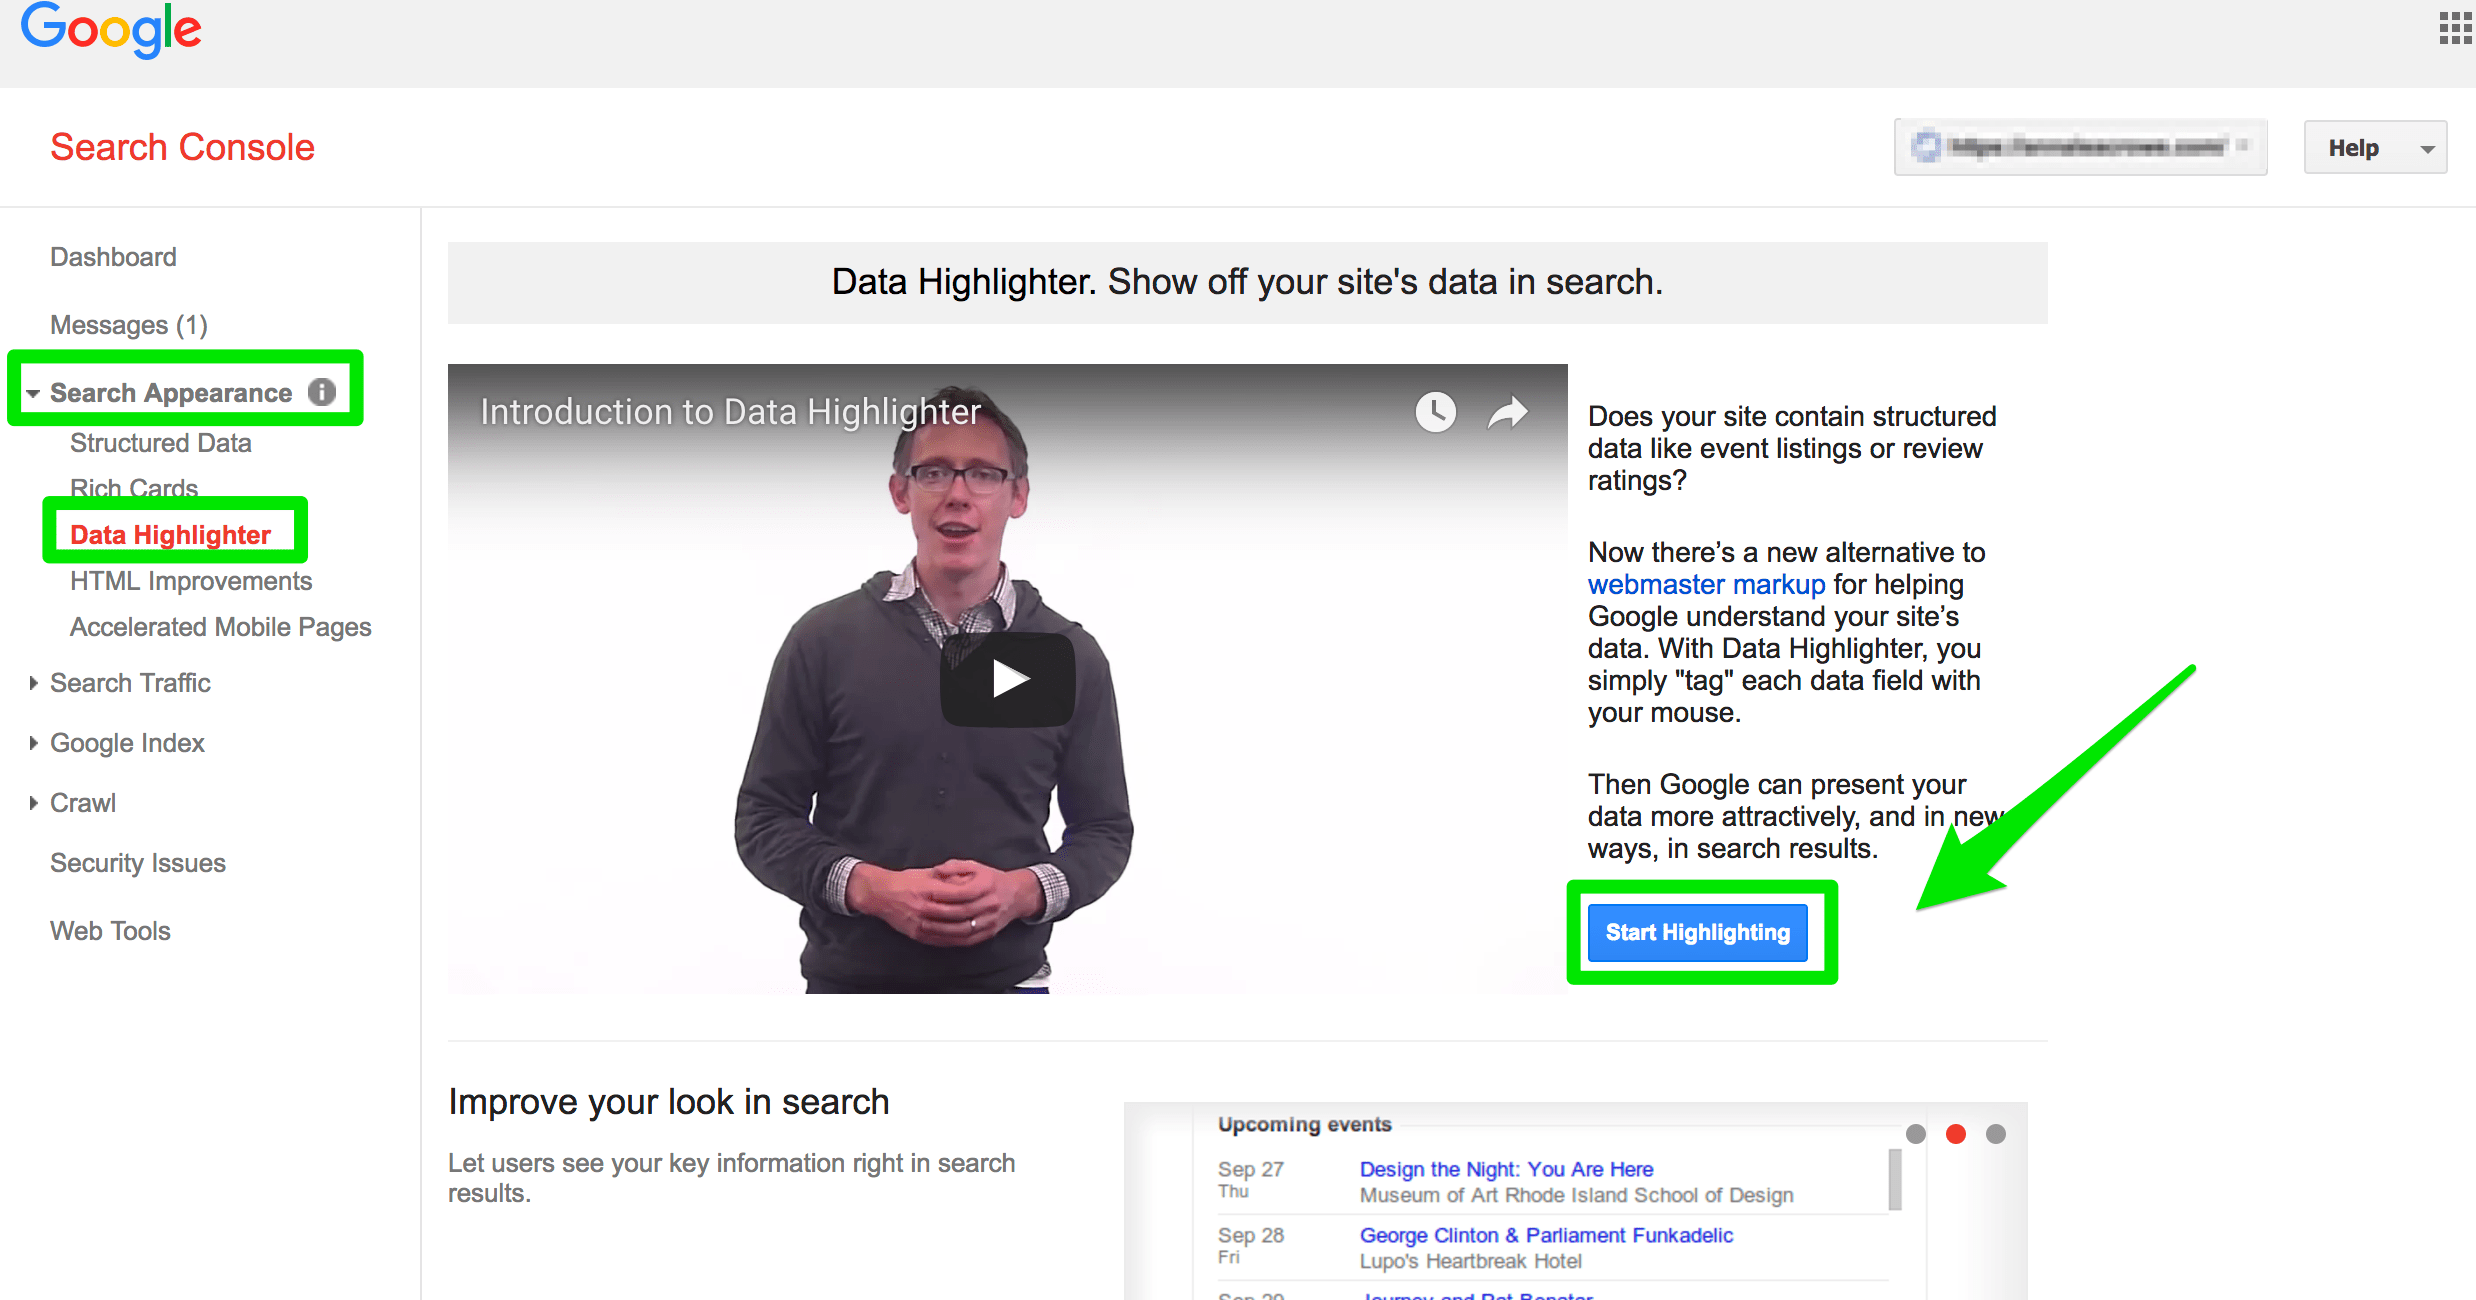
Data Highlighter
What is the Data Highlighter tool?
If you’re a Google Search Console loyalist, then we have something in common. Although the Data Highlighter tool may not be all that hidden, it’s one of my favorite tools in Google Search Console.
For example: Did you know that you could write your structured data right in GSC? Or, that you don’t need a web developer to add structured data to your site?
How to use the Data Highlighter?
Rich snippets have proven to boost click-through rates in search results, so it’s essential to websites with articles, book reviews, events, local businesses, and products to use the data highlighter.
Let me walk you through the process for Articles:
- Head to Google Search Console > Search Appearance > Structured Data
- Select “Start highlighting”
- Select which option you’d like to start highlighting
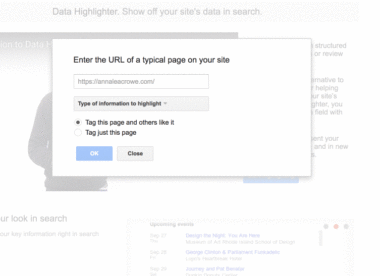
- Use your mouse to highlight elements on the page and pairing them with the required elements

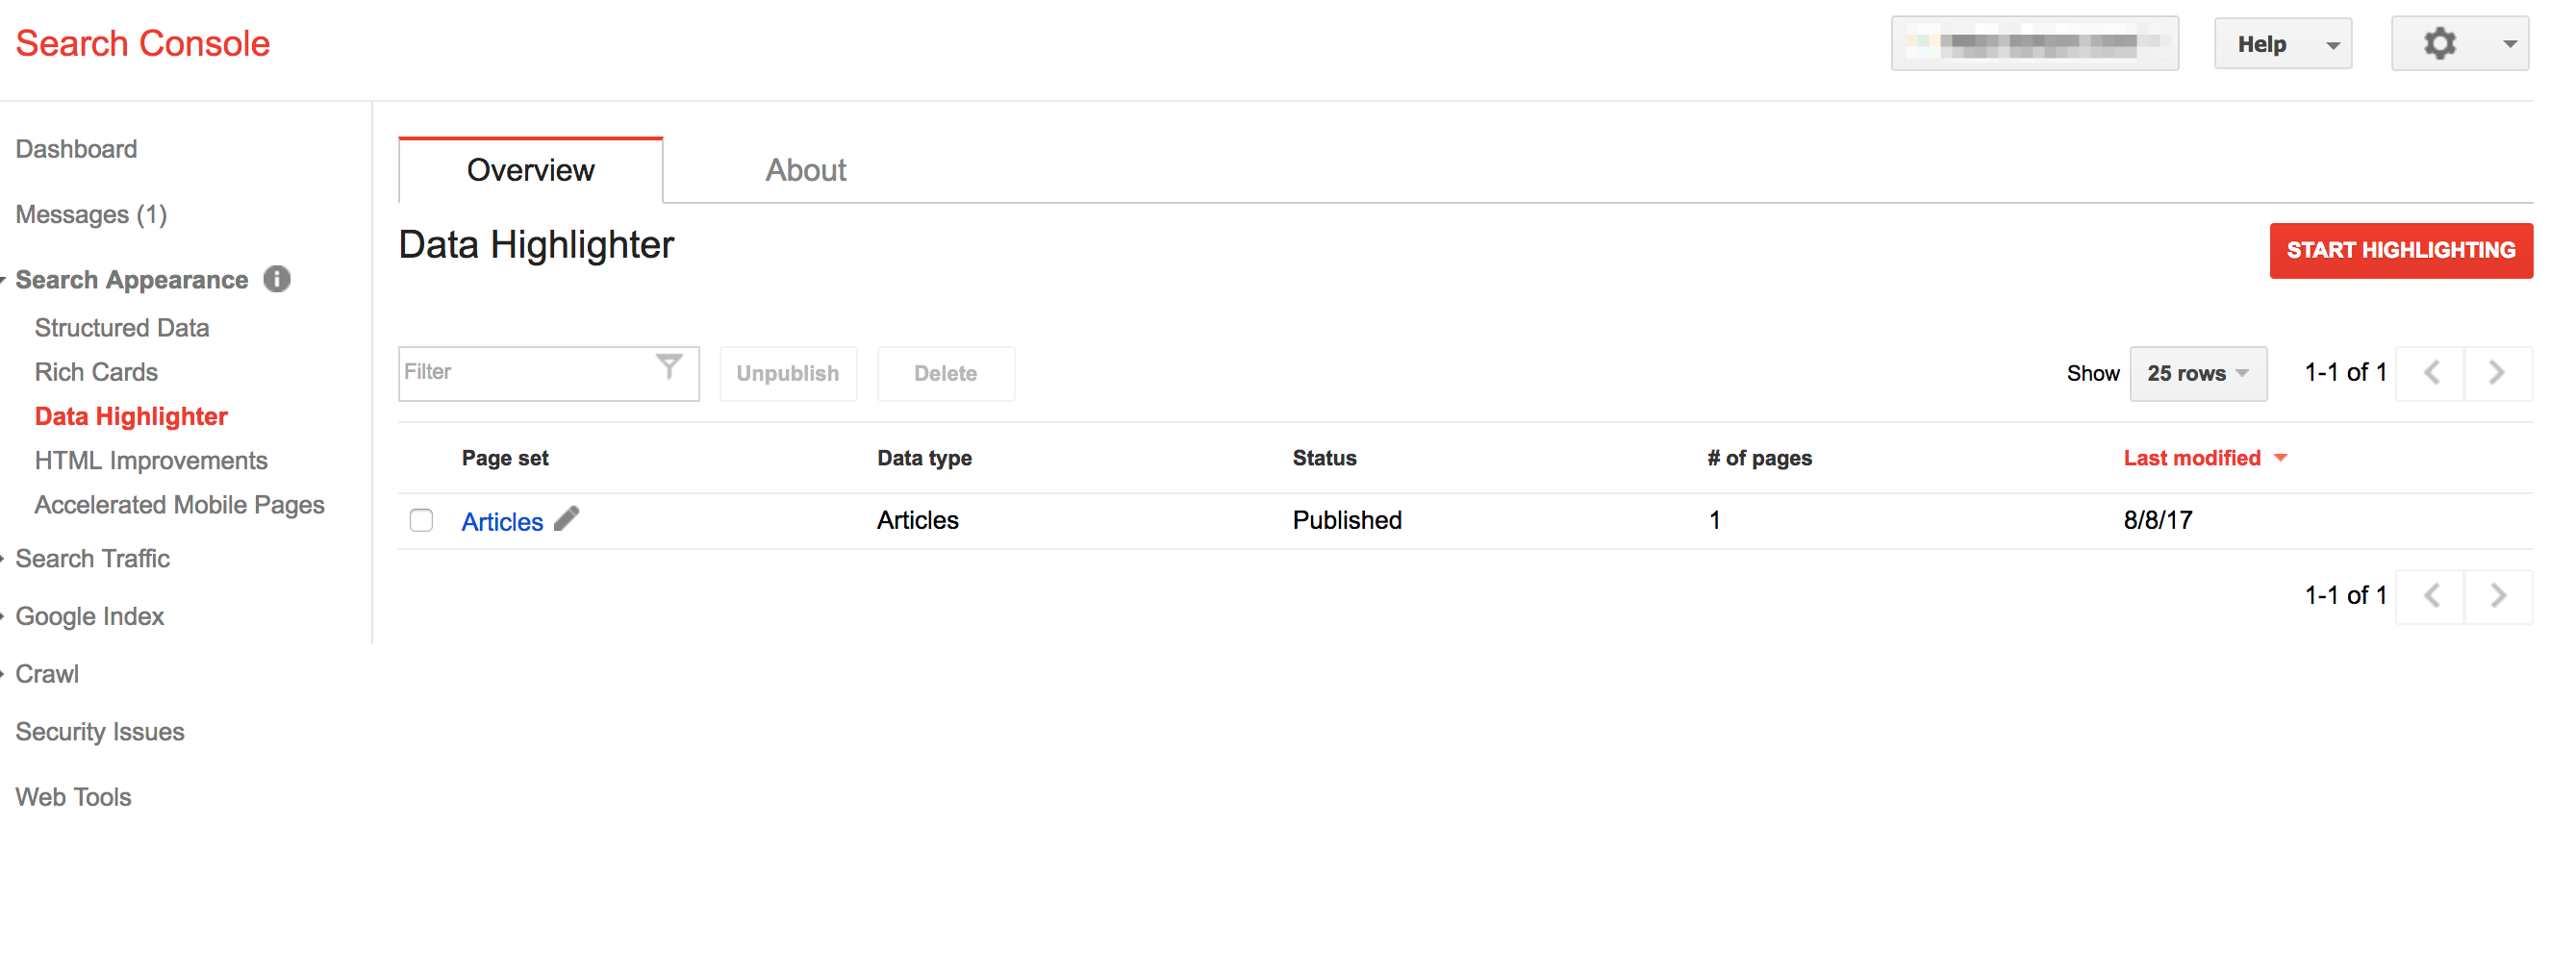
- When you’re complete, you should see this listed in your Data Highlighter section
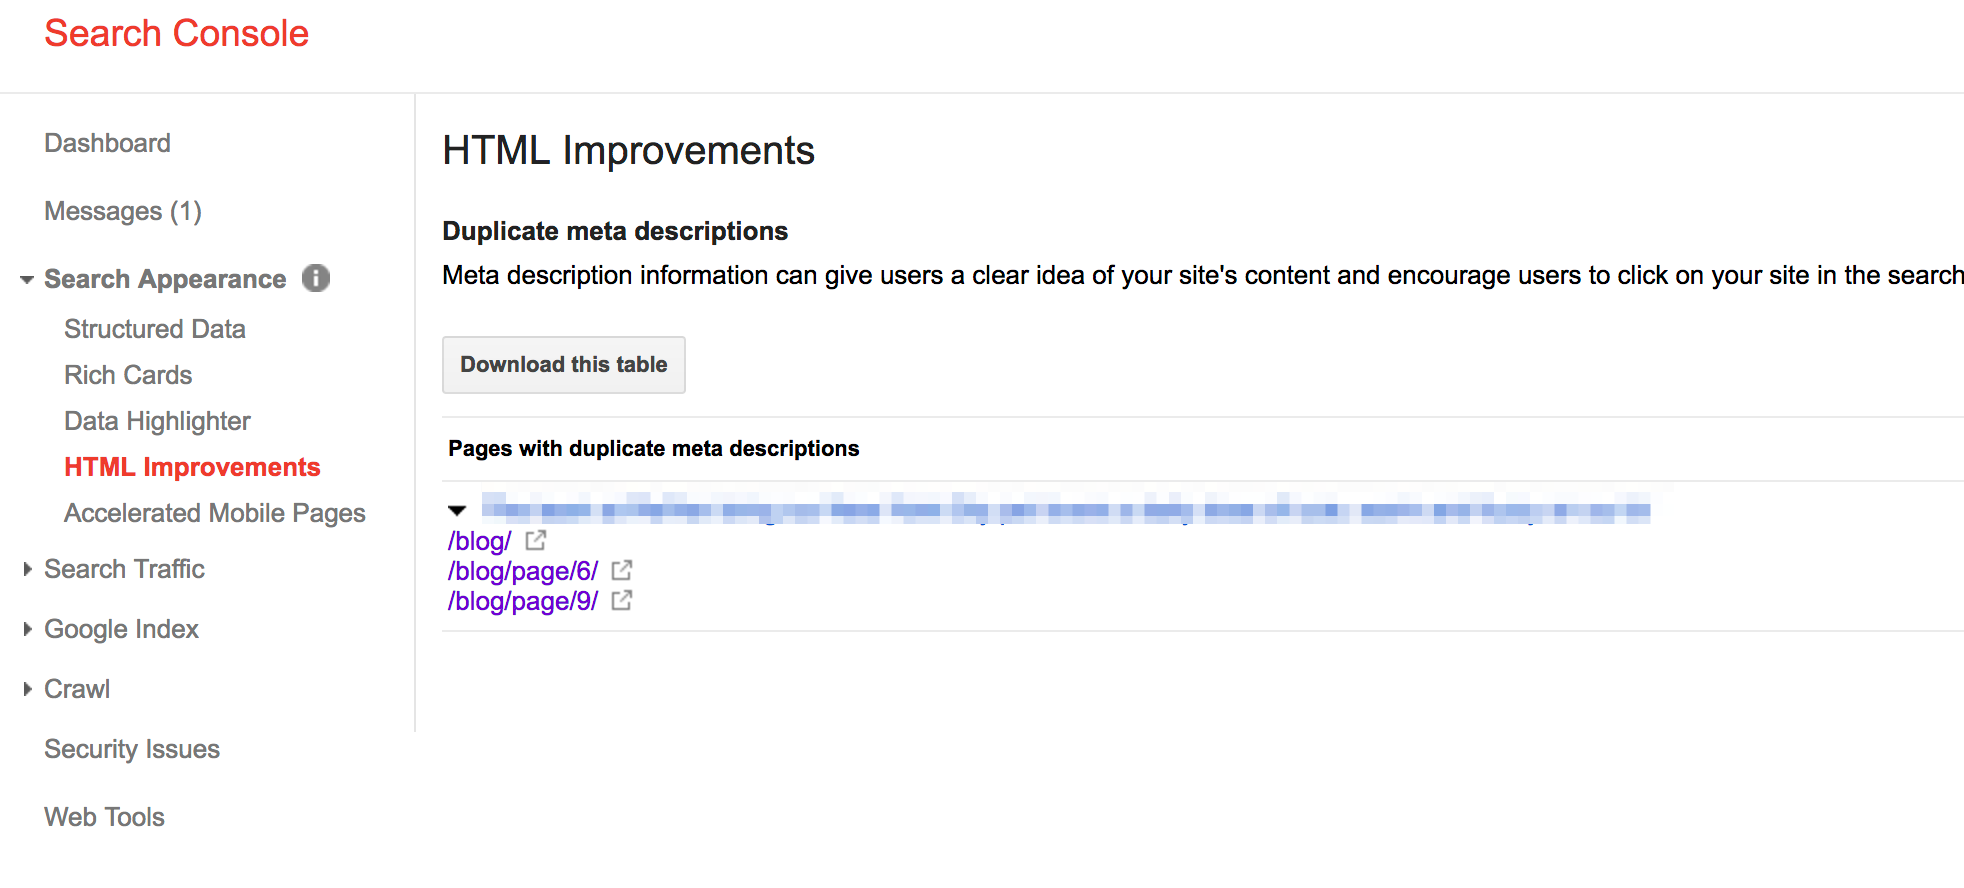
HTML Improvements (old version)
What is the HTML Improvement report?
Are you obsessed with improving your click-through-rates from organic search? Have you spent many nights lying awake wondering how to improve your meta descriptions? If so (raises hand 👋), your on-page SEO dreams have come true with HTML Improvements report.
This report displays errors to your metadata. Errors like duplicate titles or descriptions that are too long. It provides a glimpse into how Google is viewing your content.
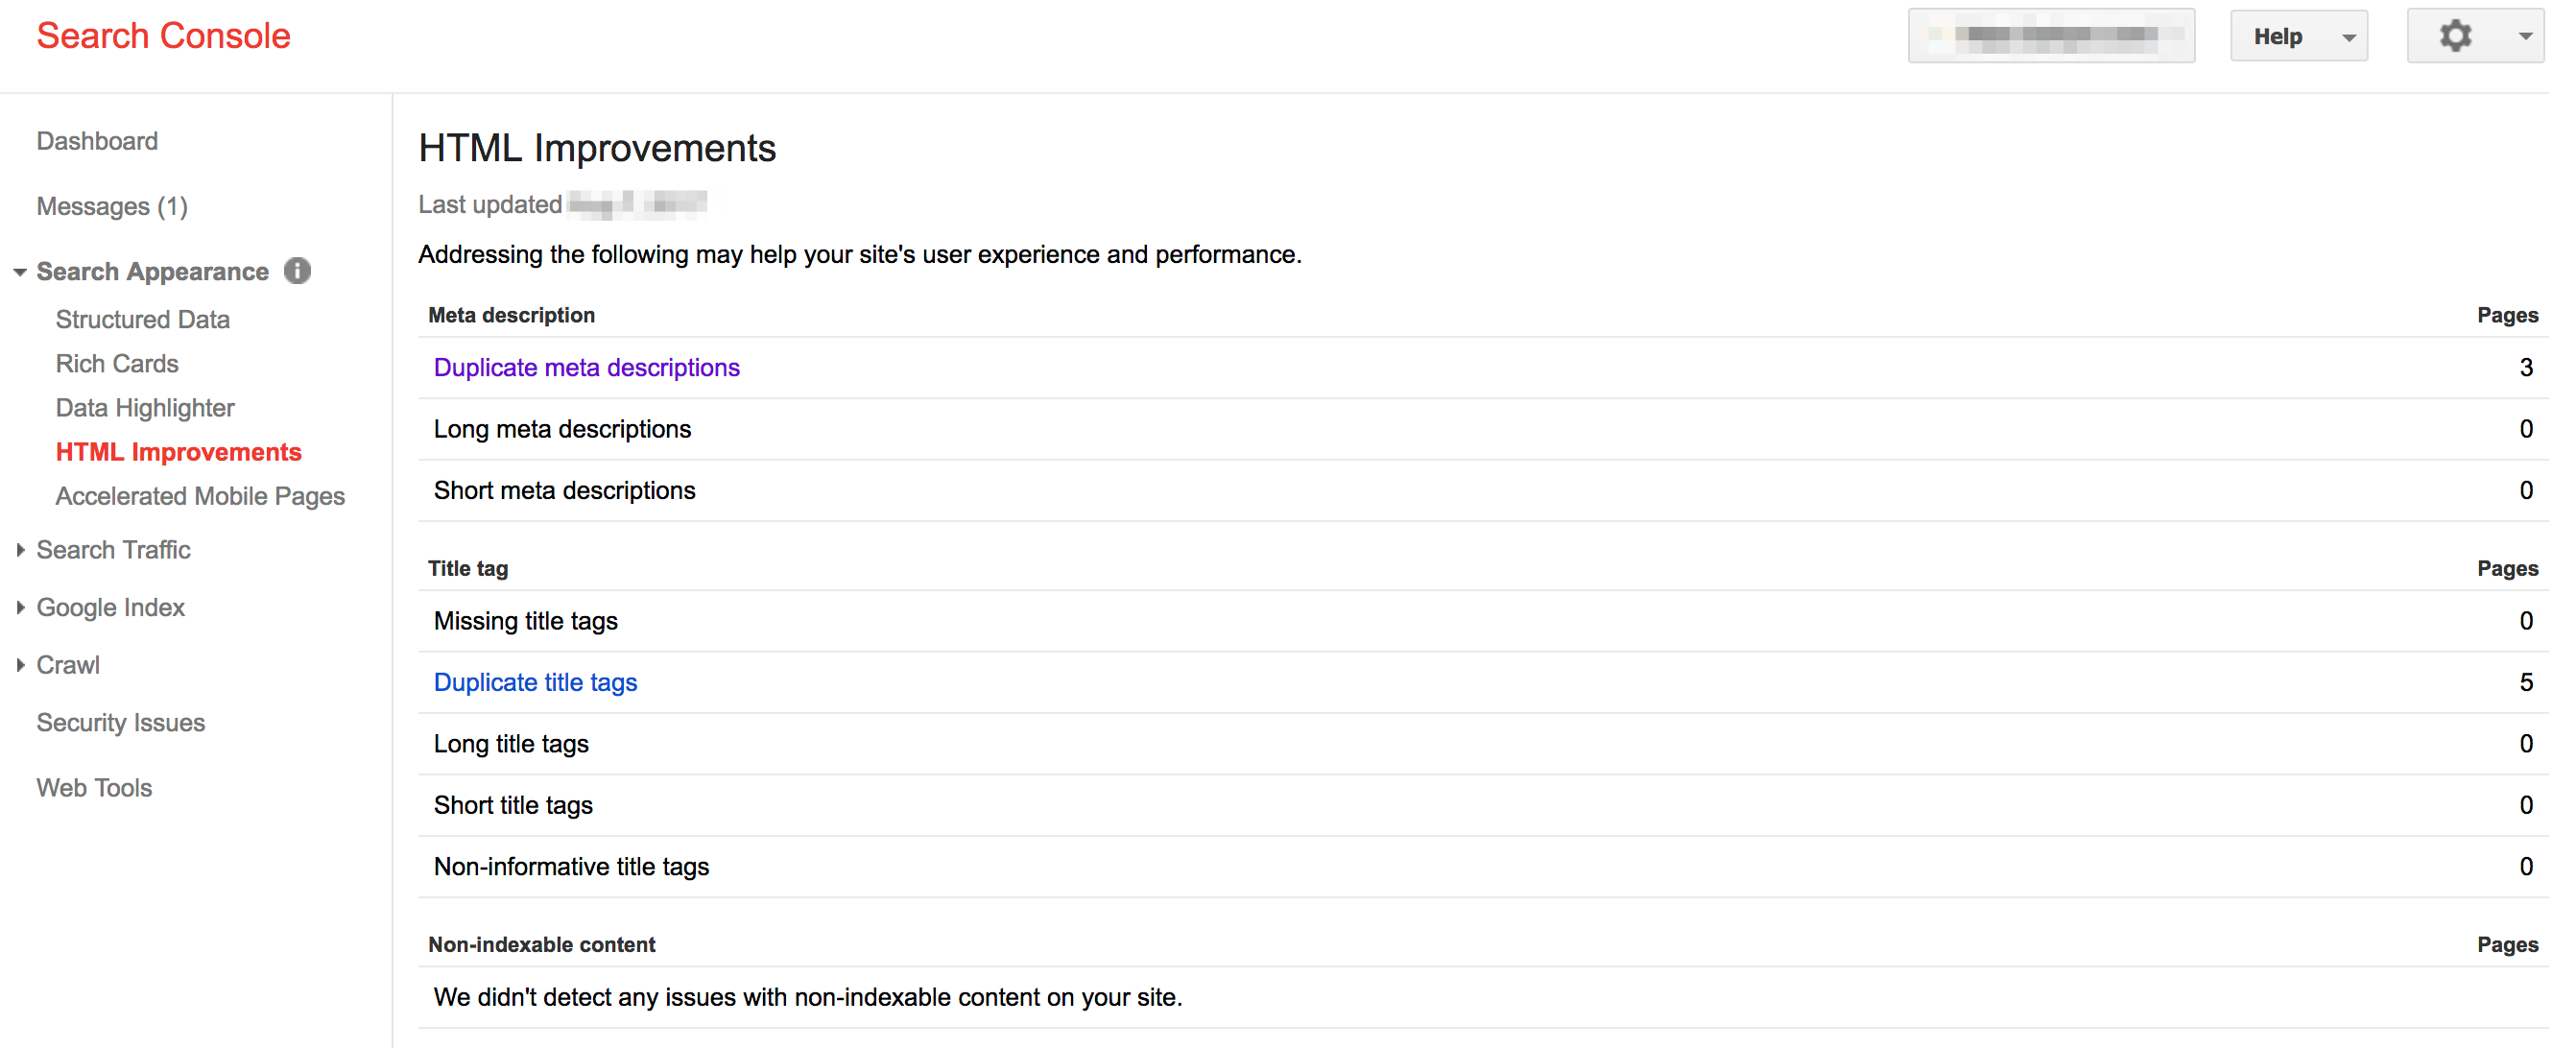
How can I fix HTML Improvement reports?
This tool is useful for identifying duplicate URL issues caused by uppercase variations, duplicate pages, etc.
To fix these issues in the HTML improvement report, follow these steps:
- Duplicate meta: Manually review each page list to confirm you have unique descriptions for each. You may discover that it’s the same page being indexed twice because of parameter URL issues (discussed further down) or discover pages without pagination.
- Long and short meta: Again, manually review each page listed and reduce the length of your meta title or description. Try to stick to 120-150 characters for descriptions and under 70 characters for titles.
- Missing: You may have only forgotten to add a meta title or meta description so just pop back over to add in content.
Once you make the changes to your website, use the Fetch as Google section to ensure Google is acknowledging your changes.
Accelerated Mobile Pages (both old and new version)
What is the AMP report?
Whenever I have the opportunity to increase page speed with one stone, I take it. And, it turns out Accelerated Mobile Pages (AMP) are like little SEO burritos, with all of the mobile search result benefits I’m loving bundled into one easy-to-implement tactic.
Increases page load time? Increases in mobile ranking? Improves server performance? Check, check, check.
So when you’re ready to check for any errors in your AMP markup, the AMP report in Google Search Console is your best friend.
You can find the AMP report in both the old and new version of Google Search Console. Here is a look at the AMP report in the new version of Google Search Console.
How do I use the AMP report?
The AMP report in Google Search Console allows you to monitor your AMP pages. You can watch for site templating and any other implementation issues that affect your AMP pages. You can also the AMP Test Tool if you’re making any big changes.
If you’re using Rich Cards, you’ll also see issues with your AMP pages listed in that section. And, as we mentioned above, you can filter AMP results in the Performance report. Pretty cool, huh?
And, Google has been notifying site owners about issues related to their AMP report.
Search Traffic
Any savvy SEO professional knows that the Search Traffic section is where it’s all at.
Search analytics can highlight top performing pages, links to your site can bring out a disavow file, and even internal links can tell you what Google is seeing.
Ahead, you’ll learn about some of the most valuable tools and reports in Google Search Console.
Performance (older version is Search Analytics)
What is the Performance report?
First things first. If you’re using old GSC, the Search Analytics report will display a 7, 28, or 90-day summary of how often your website appears in the search results.
On the dashboard, you’ll see data that can be broken down into the following metrics:
- Queries
- Pages
- Countries
- Devices
- Search Type
- Search Appearance
- Date
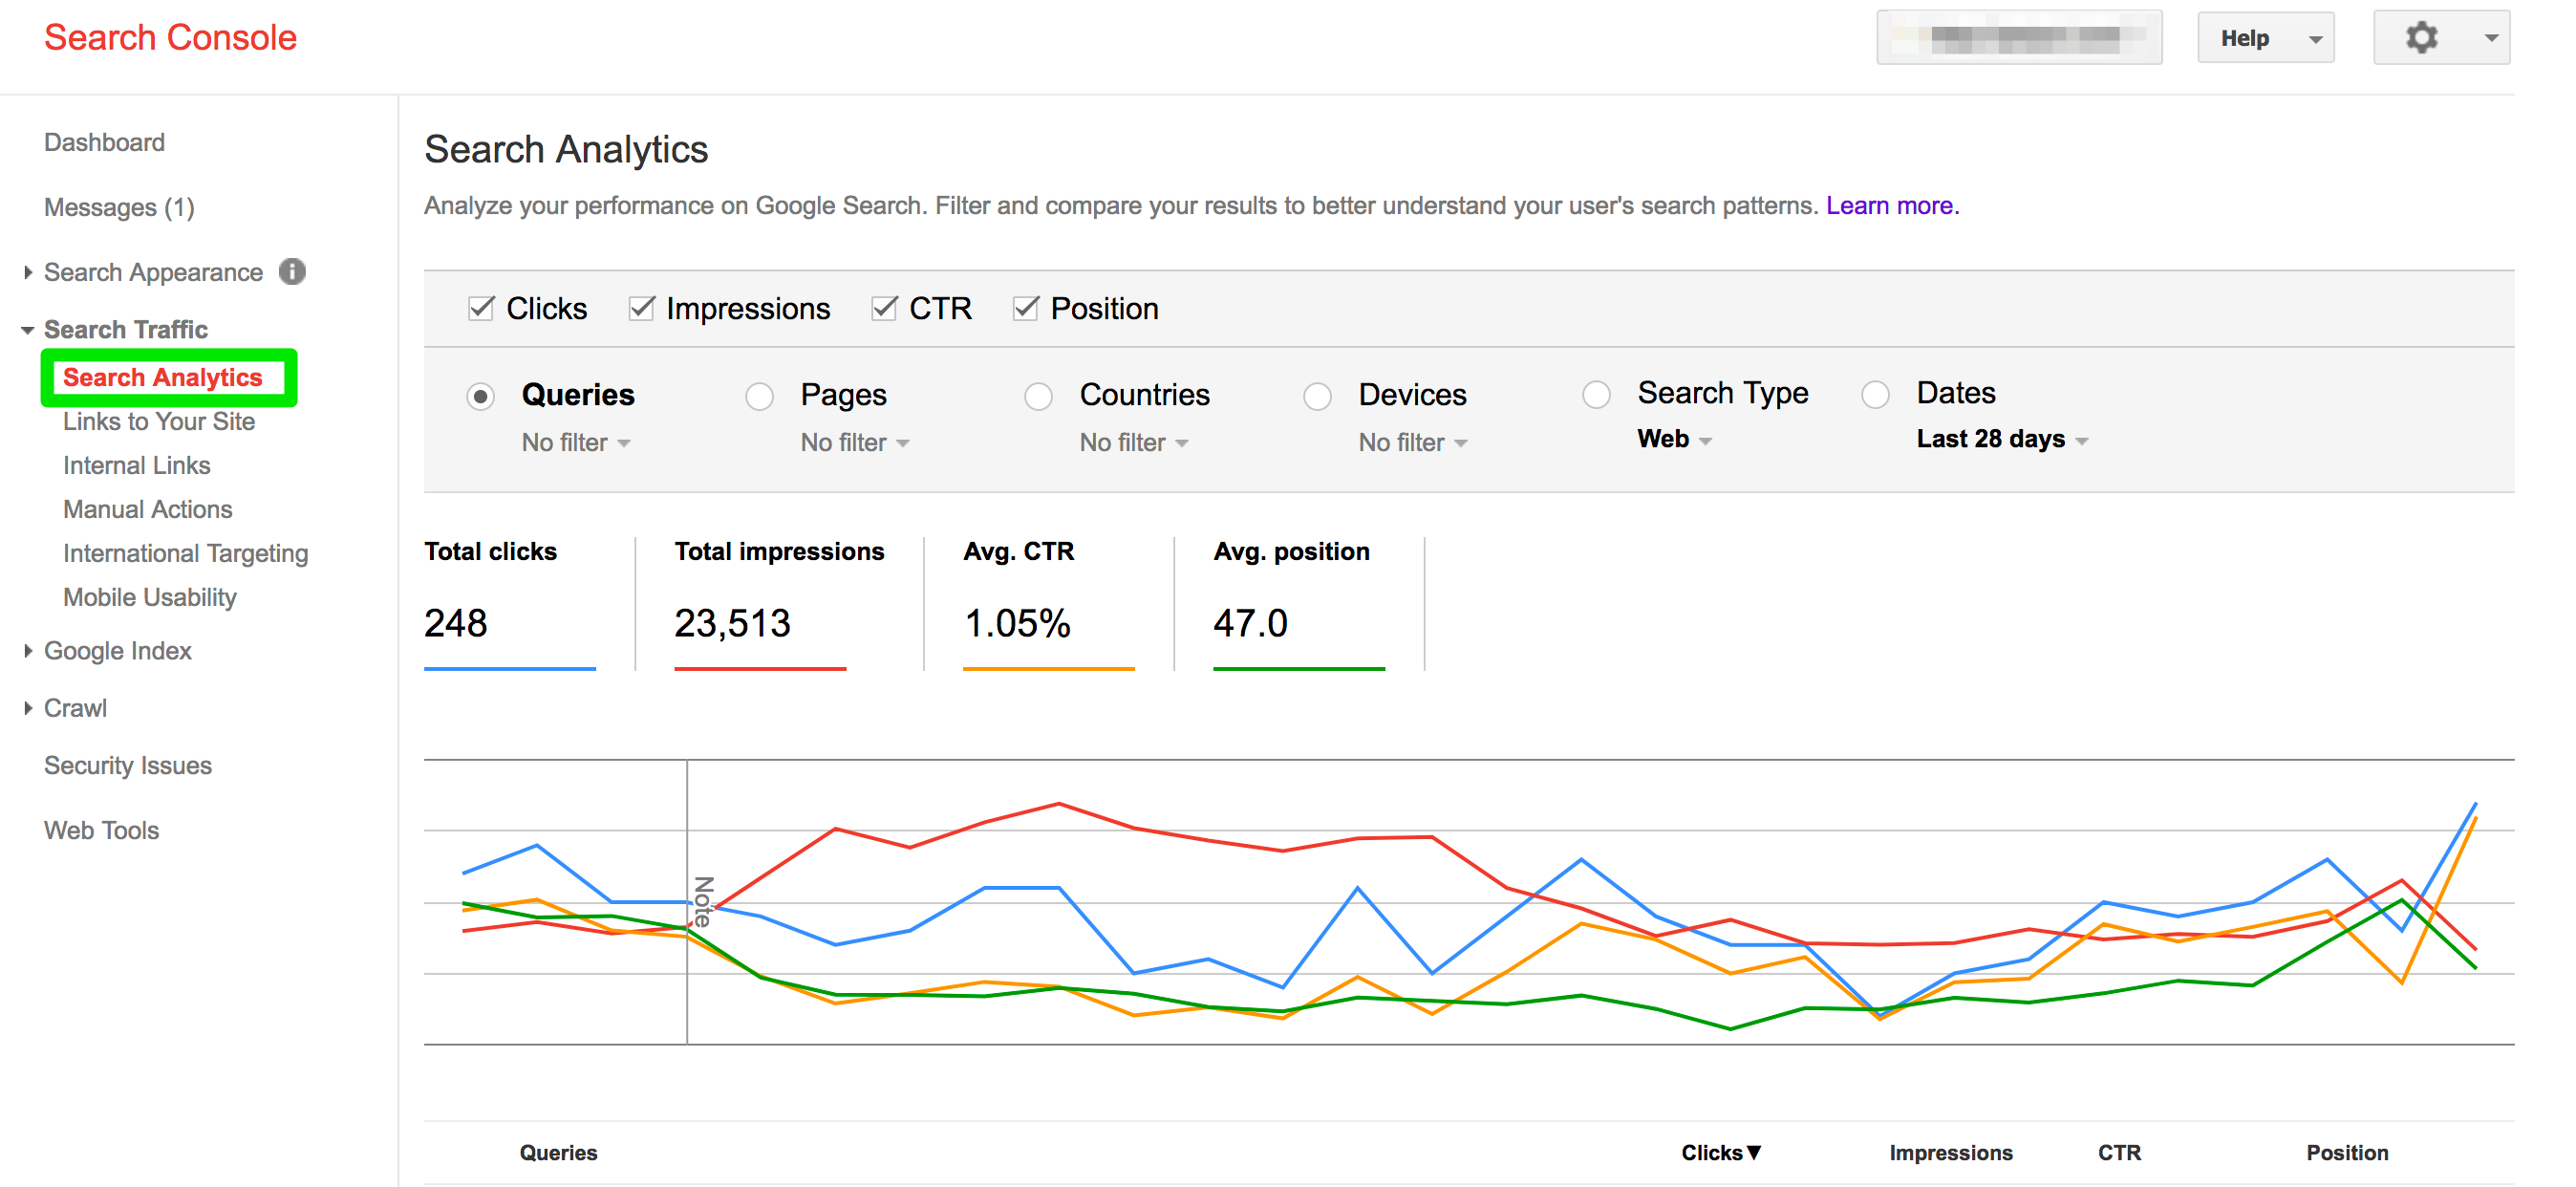
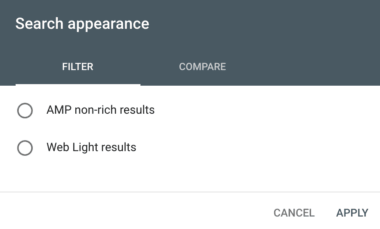
If you’re using the new version of GSC, you’ll see the Performance report under the Status tab.
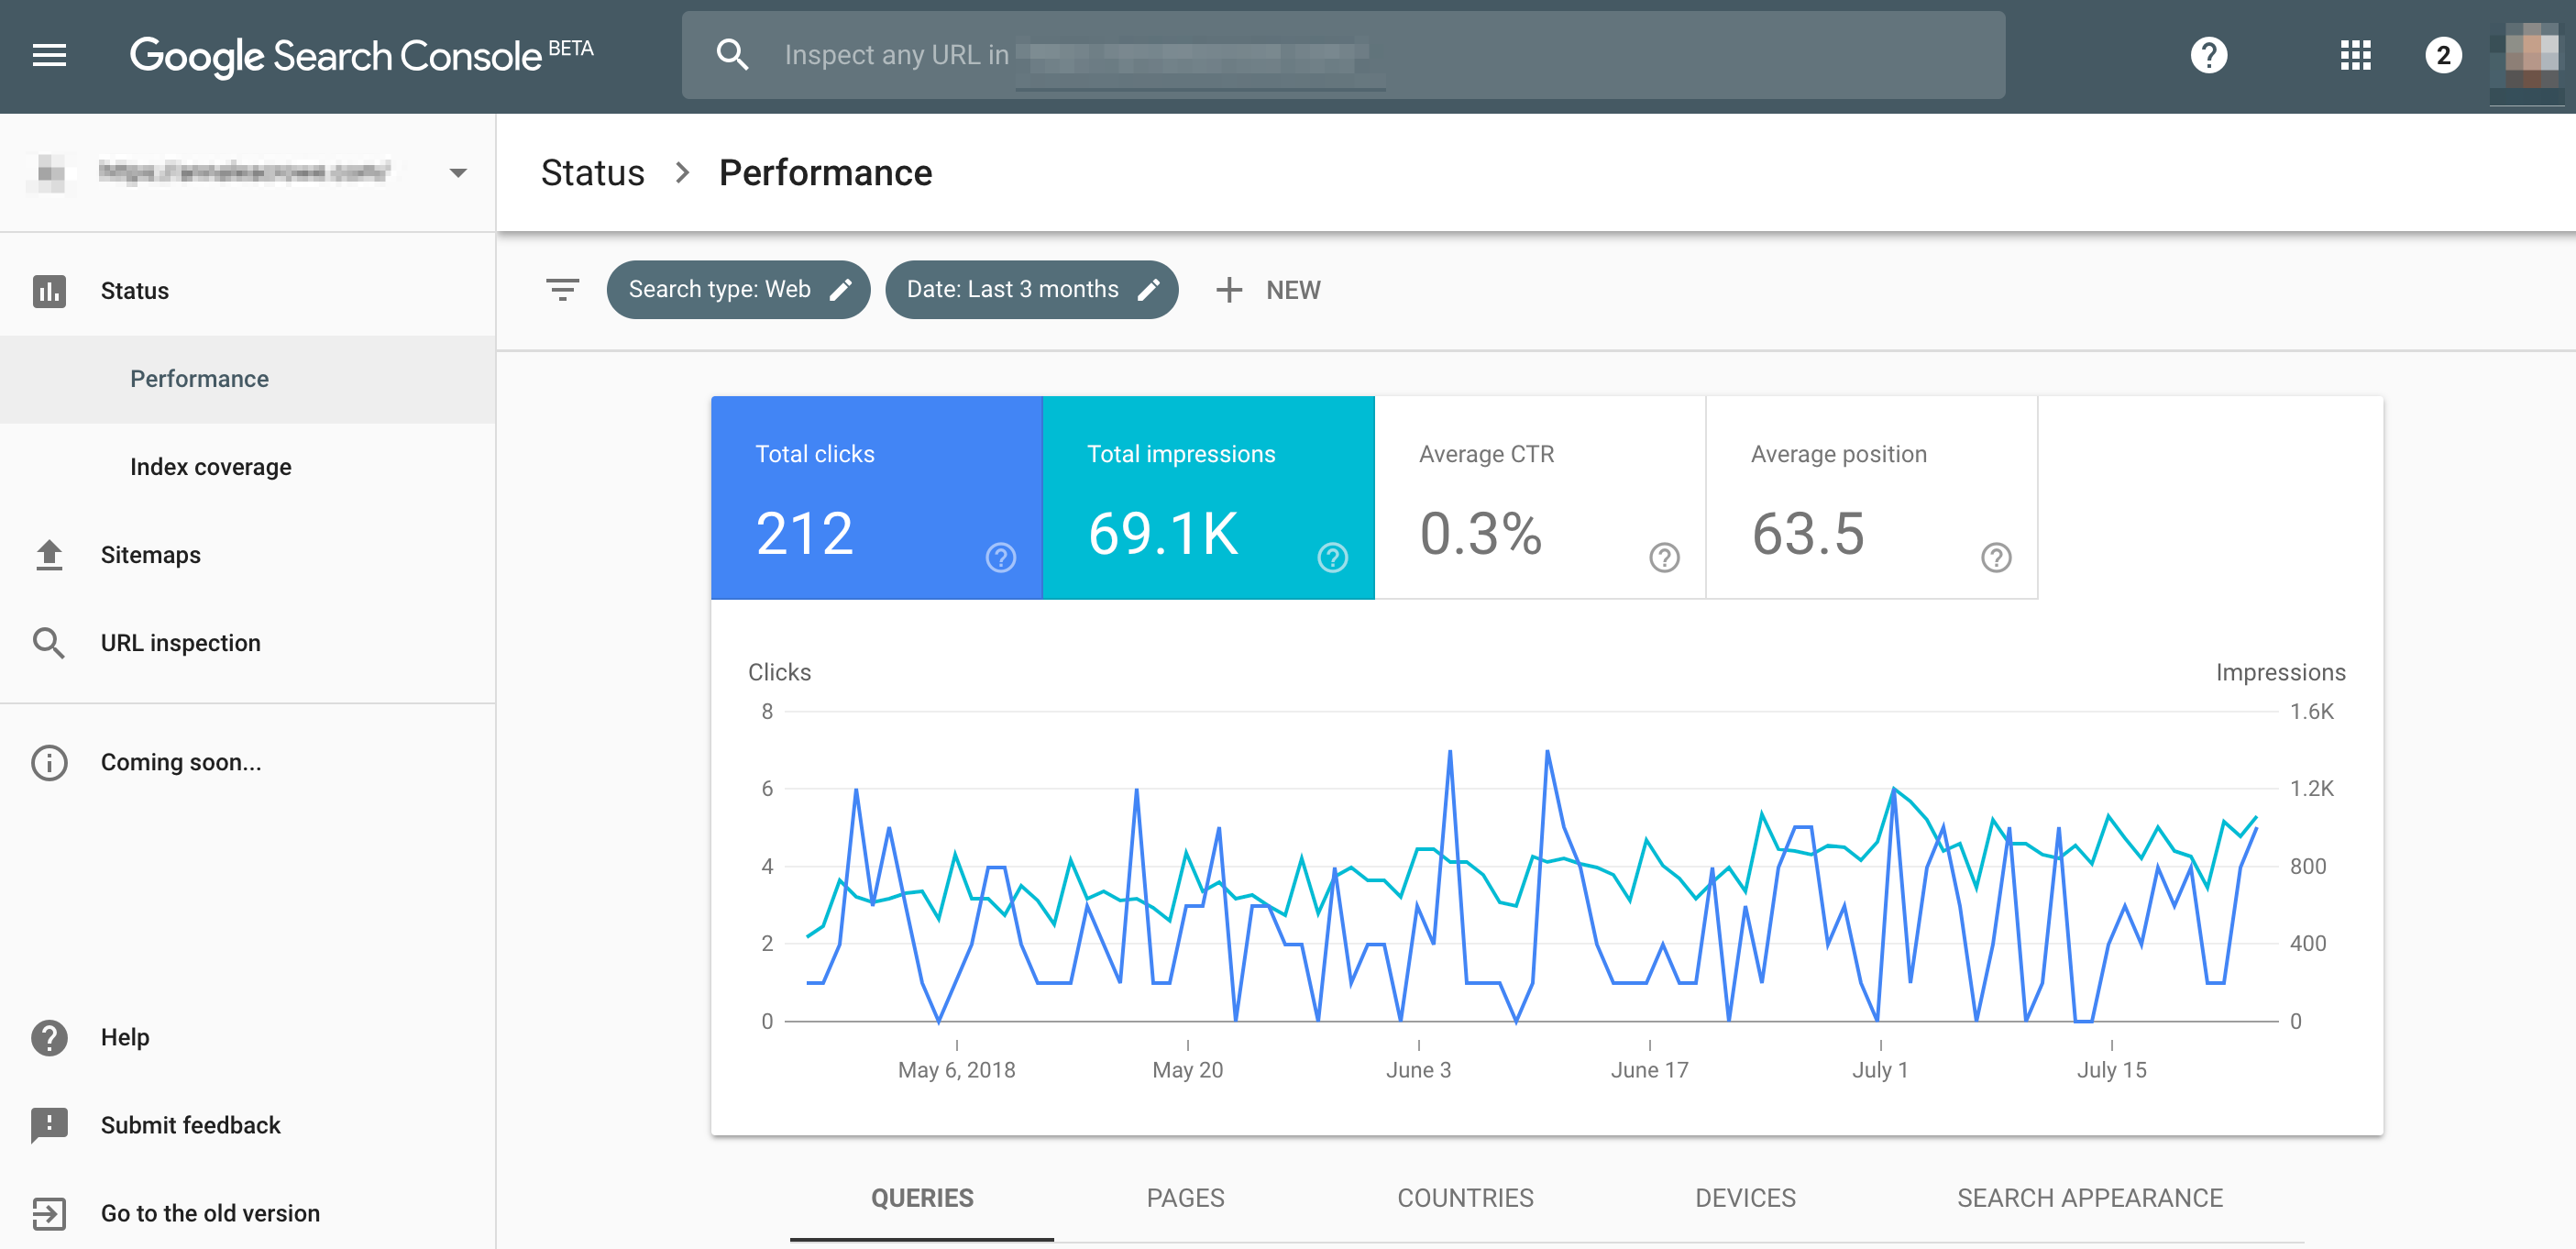
You will have the same metrics available, but you’ll have 16-months worth of data. Plus, you’ll the ability to filter results by:
- Job posting.
- Rich results.
- AMP pages.
- Non-rich AMP results.
If you’re like me and your spreadsheets are filled with traffic and keyword positioning changes, then Search Performance is the ranch dip to your carrot. If not for the content opportunities (what editorial calendar dreams are made of) then, at least, for the impressions and clicks data by country and device.
What reports can I build with Search Performance in Google Search Console?
The 16-month data is an excellent way to get a quick overview of your website and content performance in the SERPs. If you’re building spreadsheets, download this Google Chrome extension. Trust me; it’s a major time-saver.
Here’s an example of a spreadsheet I’m able to build:
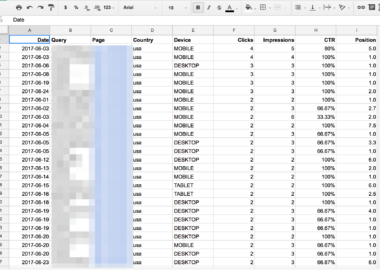
You can use this data to identify:
- Top performing pages
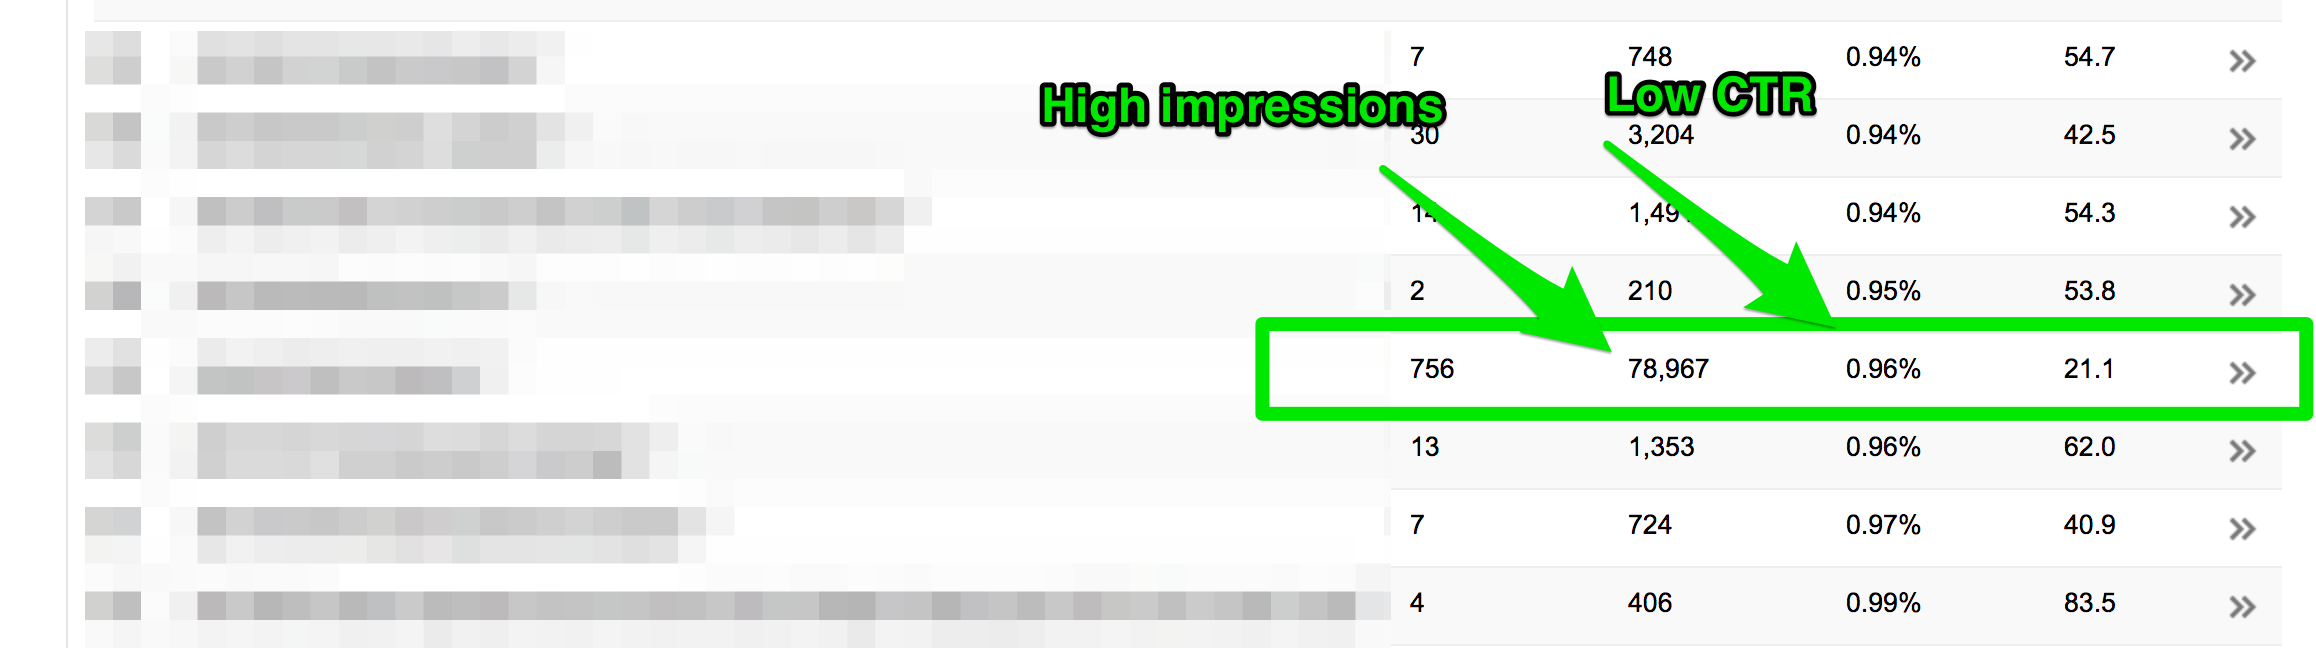
- Pages with low CTR
- Number of clicks per keyword
- Number of impressions per keyword
For example, I use this data to determine what metadata I need to rewrite. If I have a page with high impressions and low clicks, this may mean my meta title or meta description is not working.
Links to Your Site
What is the Links to Your Site report?
In a perfect world, all websites would have plenty of high-quality links to every page. And in a really perfect world, our websites would have links from big sites like CNN, Entrepreneur, and Search Engine Journal. That’s just not the case.
The Links to Your Site report in Google Search Console shows you what websites are linking to you.
How do I monitor backlinks in Google Search Console? And, how do I disavow?
We have to be picky about where our backlinks are coming from. And with the ongoing Google algorithm changes, knowing when to disavow backlinks can be tricky.
To monitor backlinks in Google Search Console, follow these steps:
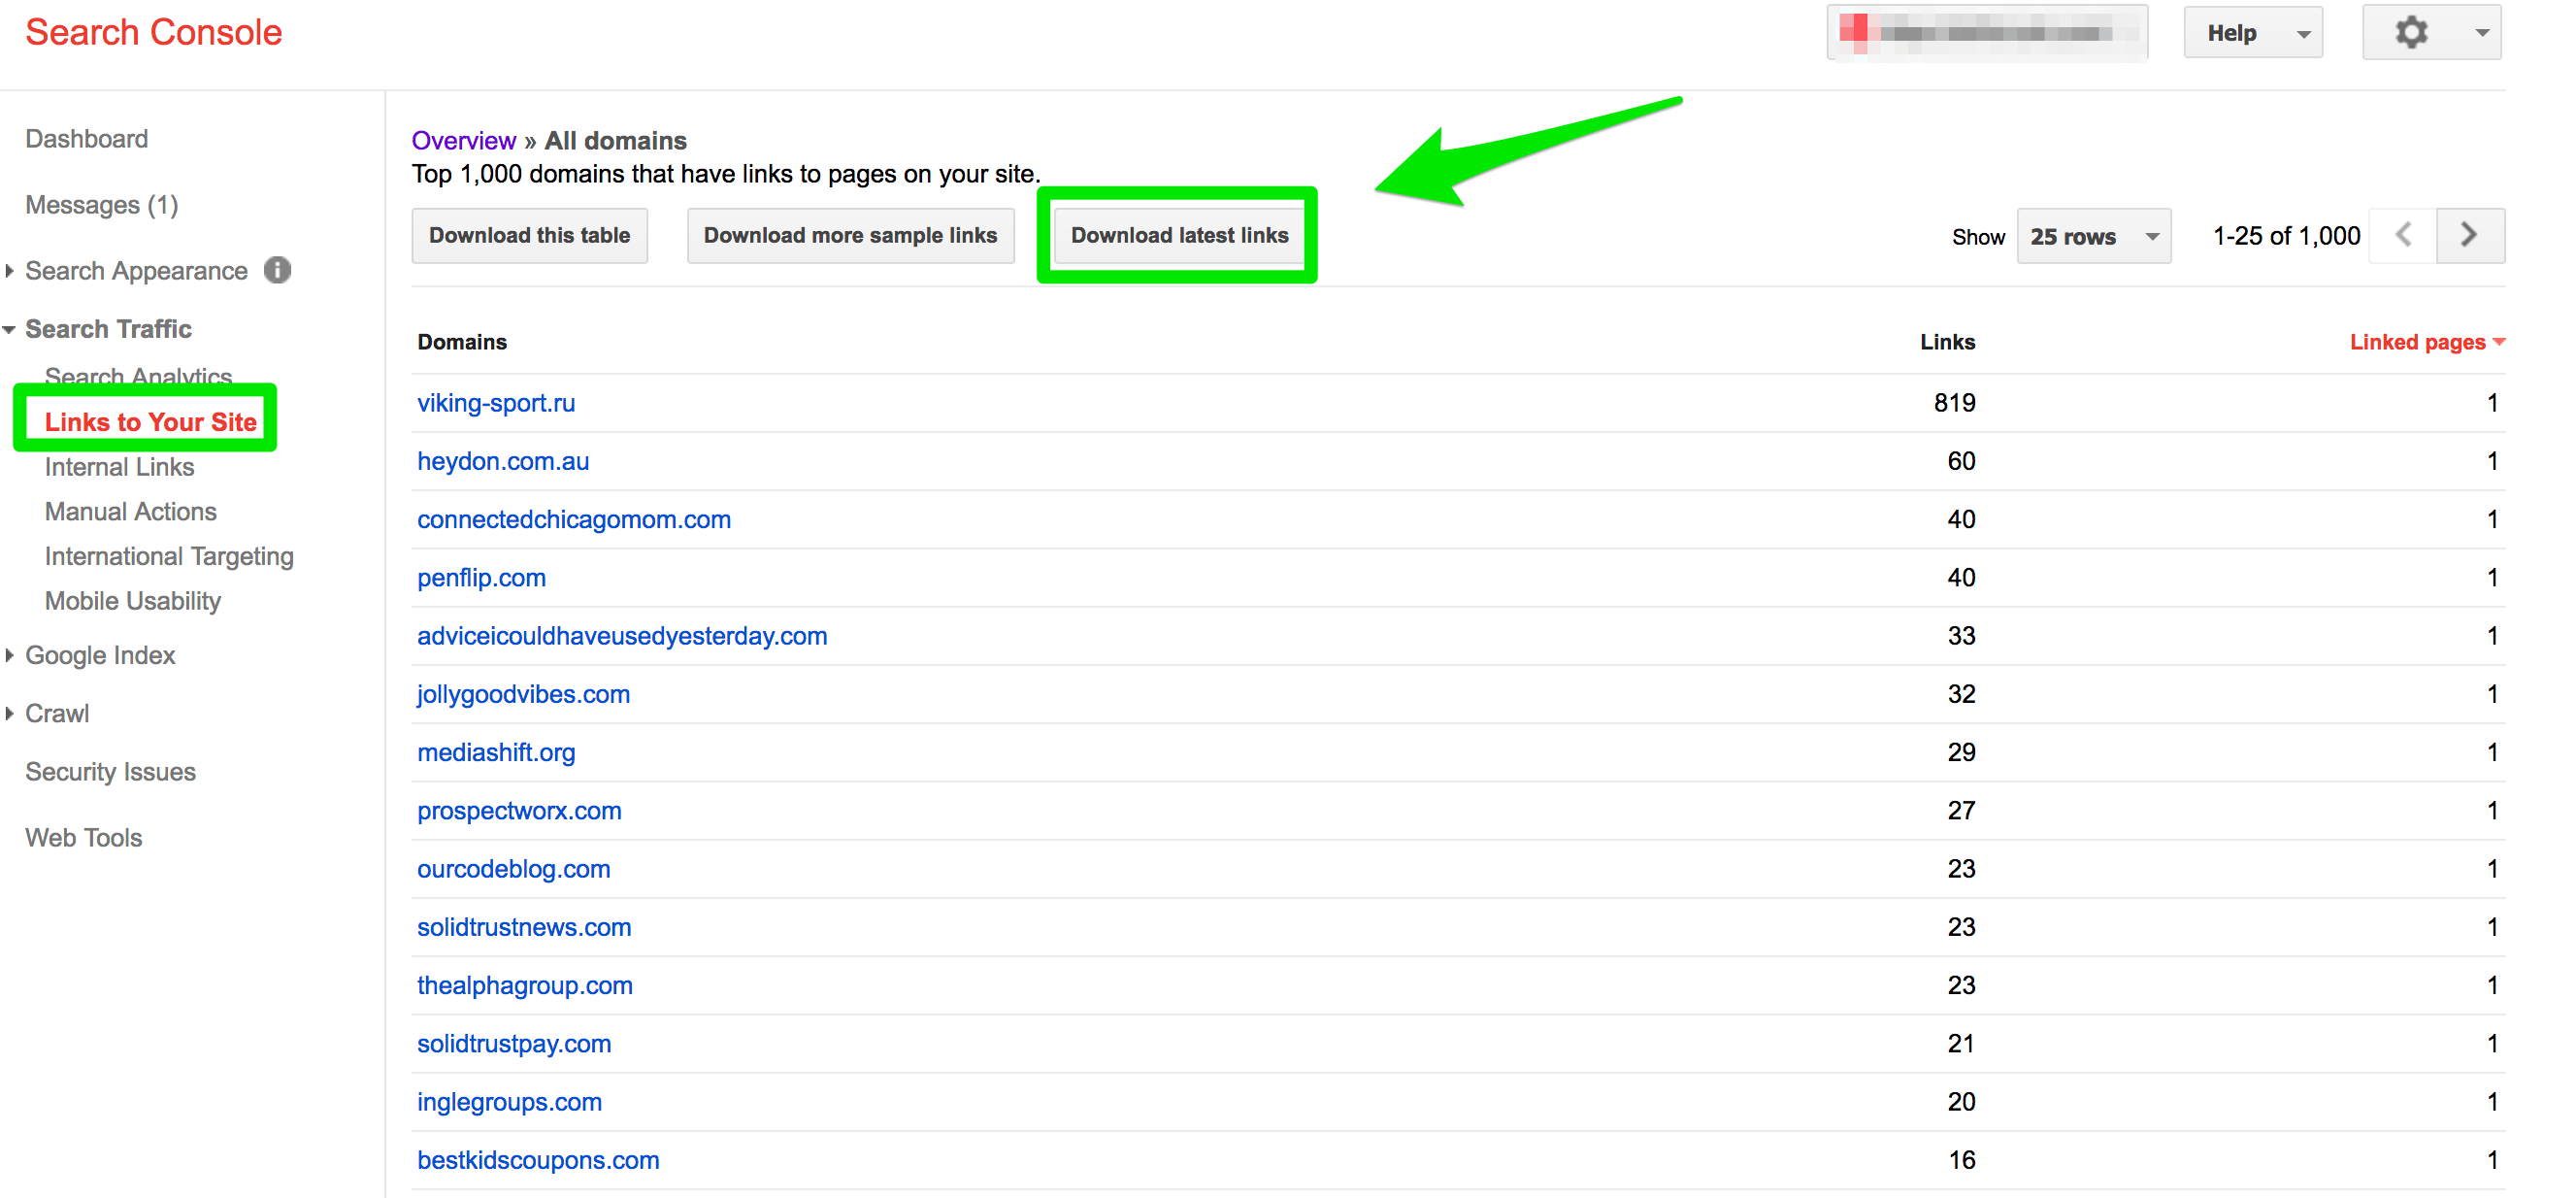
- Go to Links to Your Site dashboard
- Click “Who links the most”
- Click “Download the latest links” report
- Identify any abnormal patterns of links coming in from one day. Looking for these patterns will help you discover potential link spam issues for a negative SEO attack.
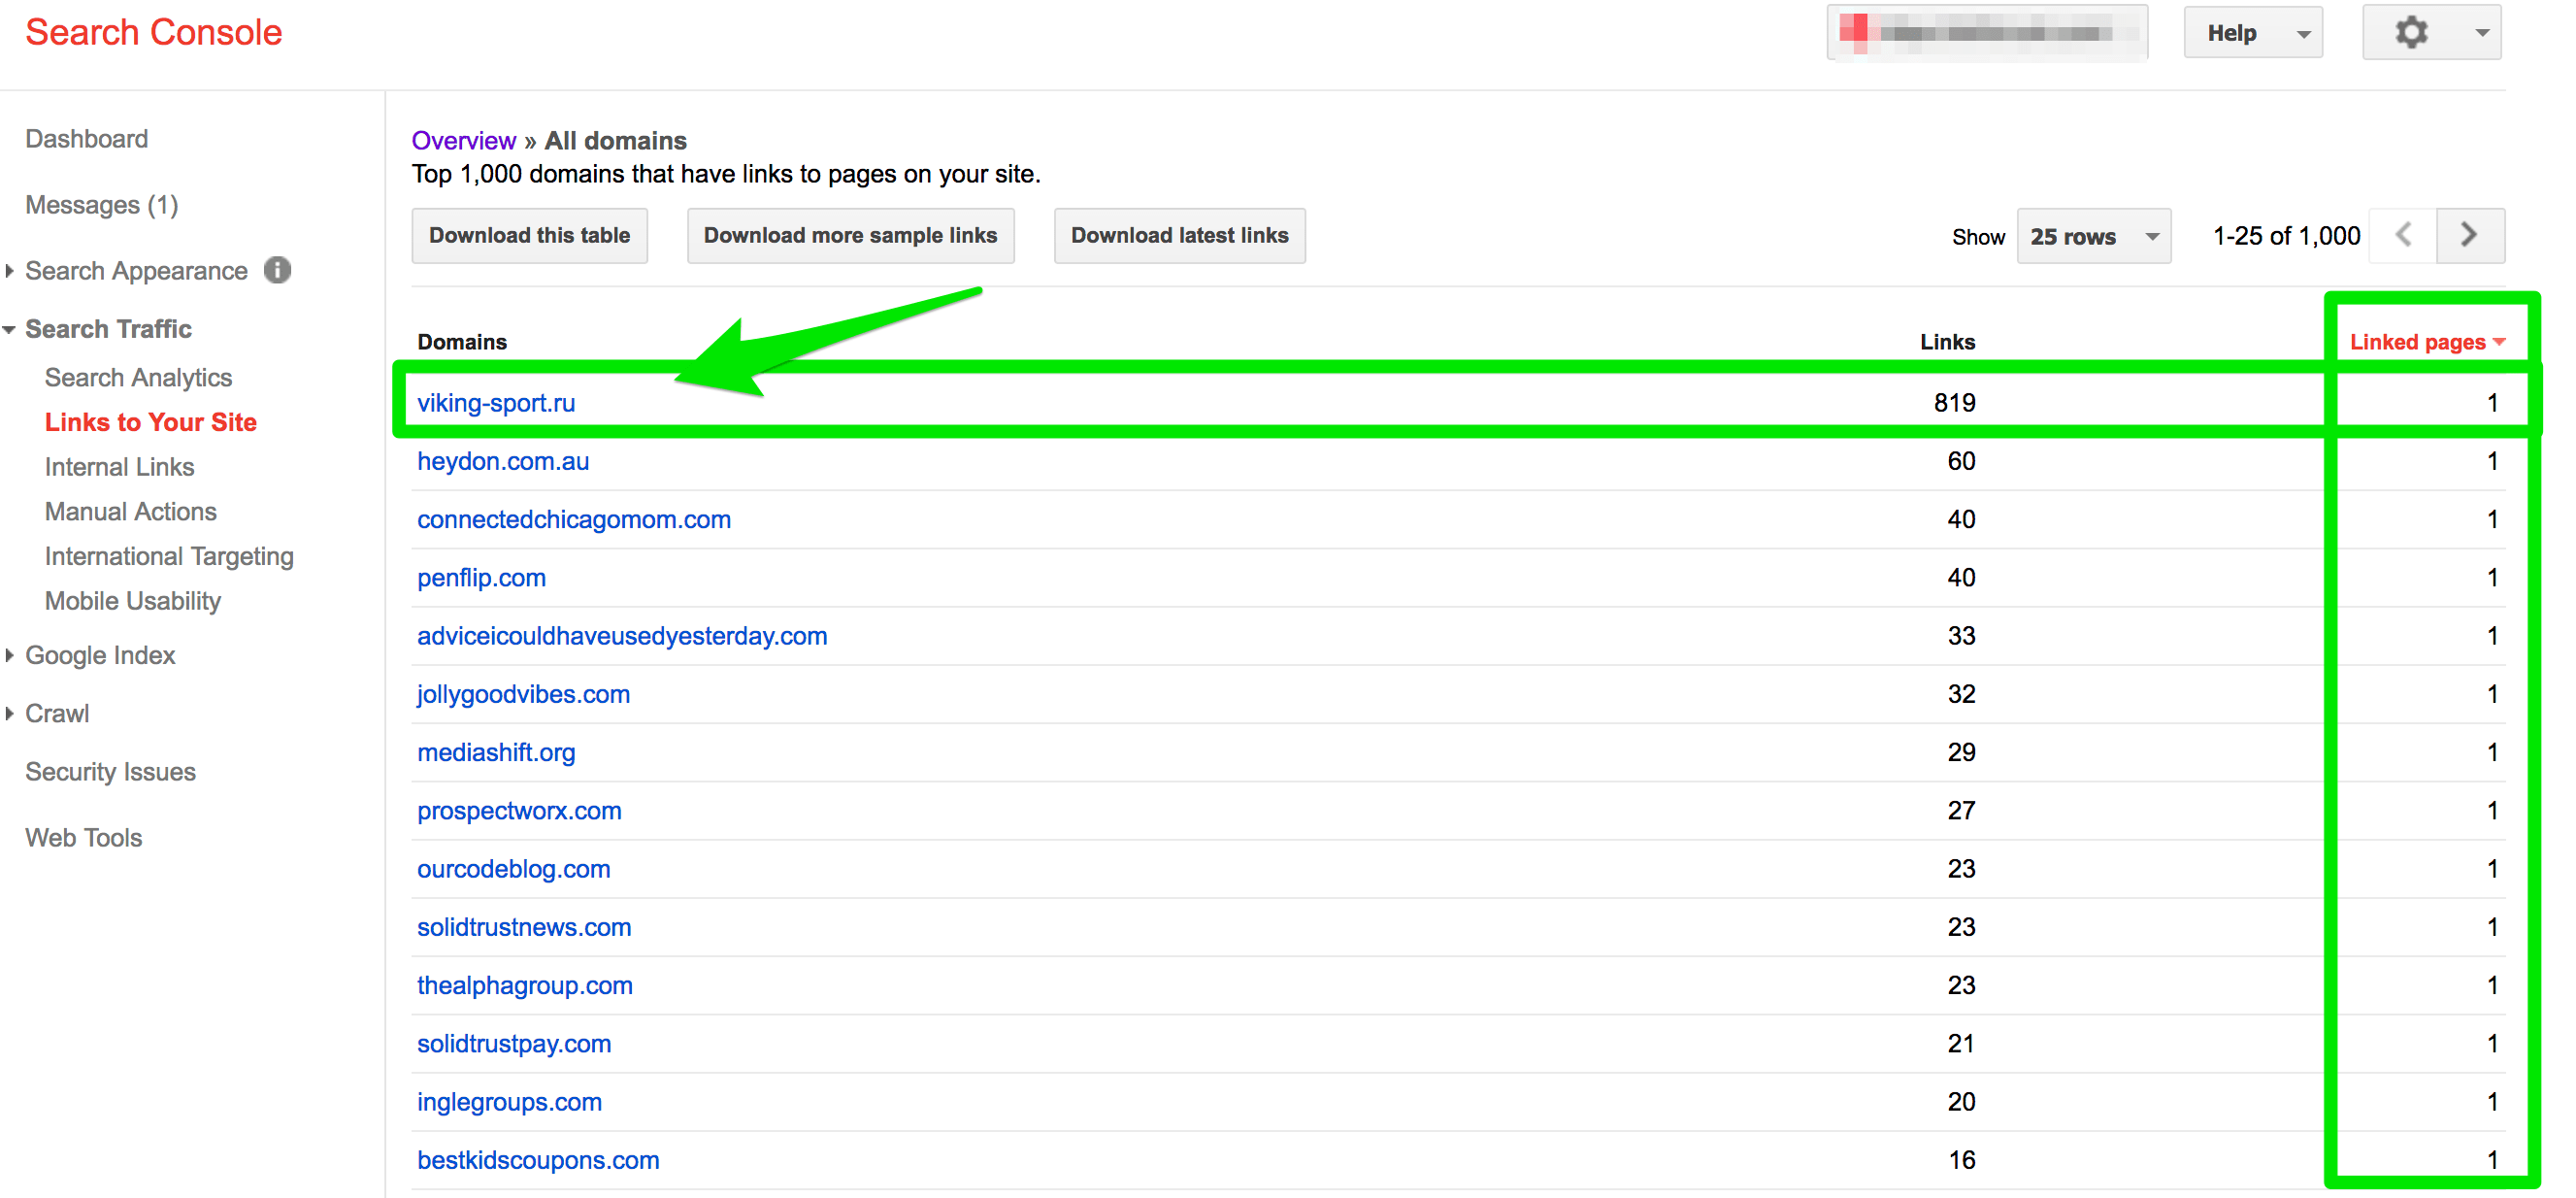
To find potential harmful backlinks that you may want to disavow in Google Search Console, follow these steps:
- Go to Links to Your Site dashboard
- Click “Who links the most”
- Sort by Linked Pages so that you see one at the top.
- Manually investigate the quality of sites linking to you 100+ times from one page.
- Use the Disavow Tool to upload your document of backlinks you want Google to ignore. It’s important you use this tool with caution. Be sure to investigate all backlinks from these sites before uploading.
Internal Links
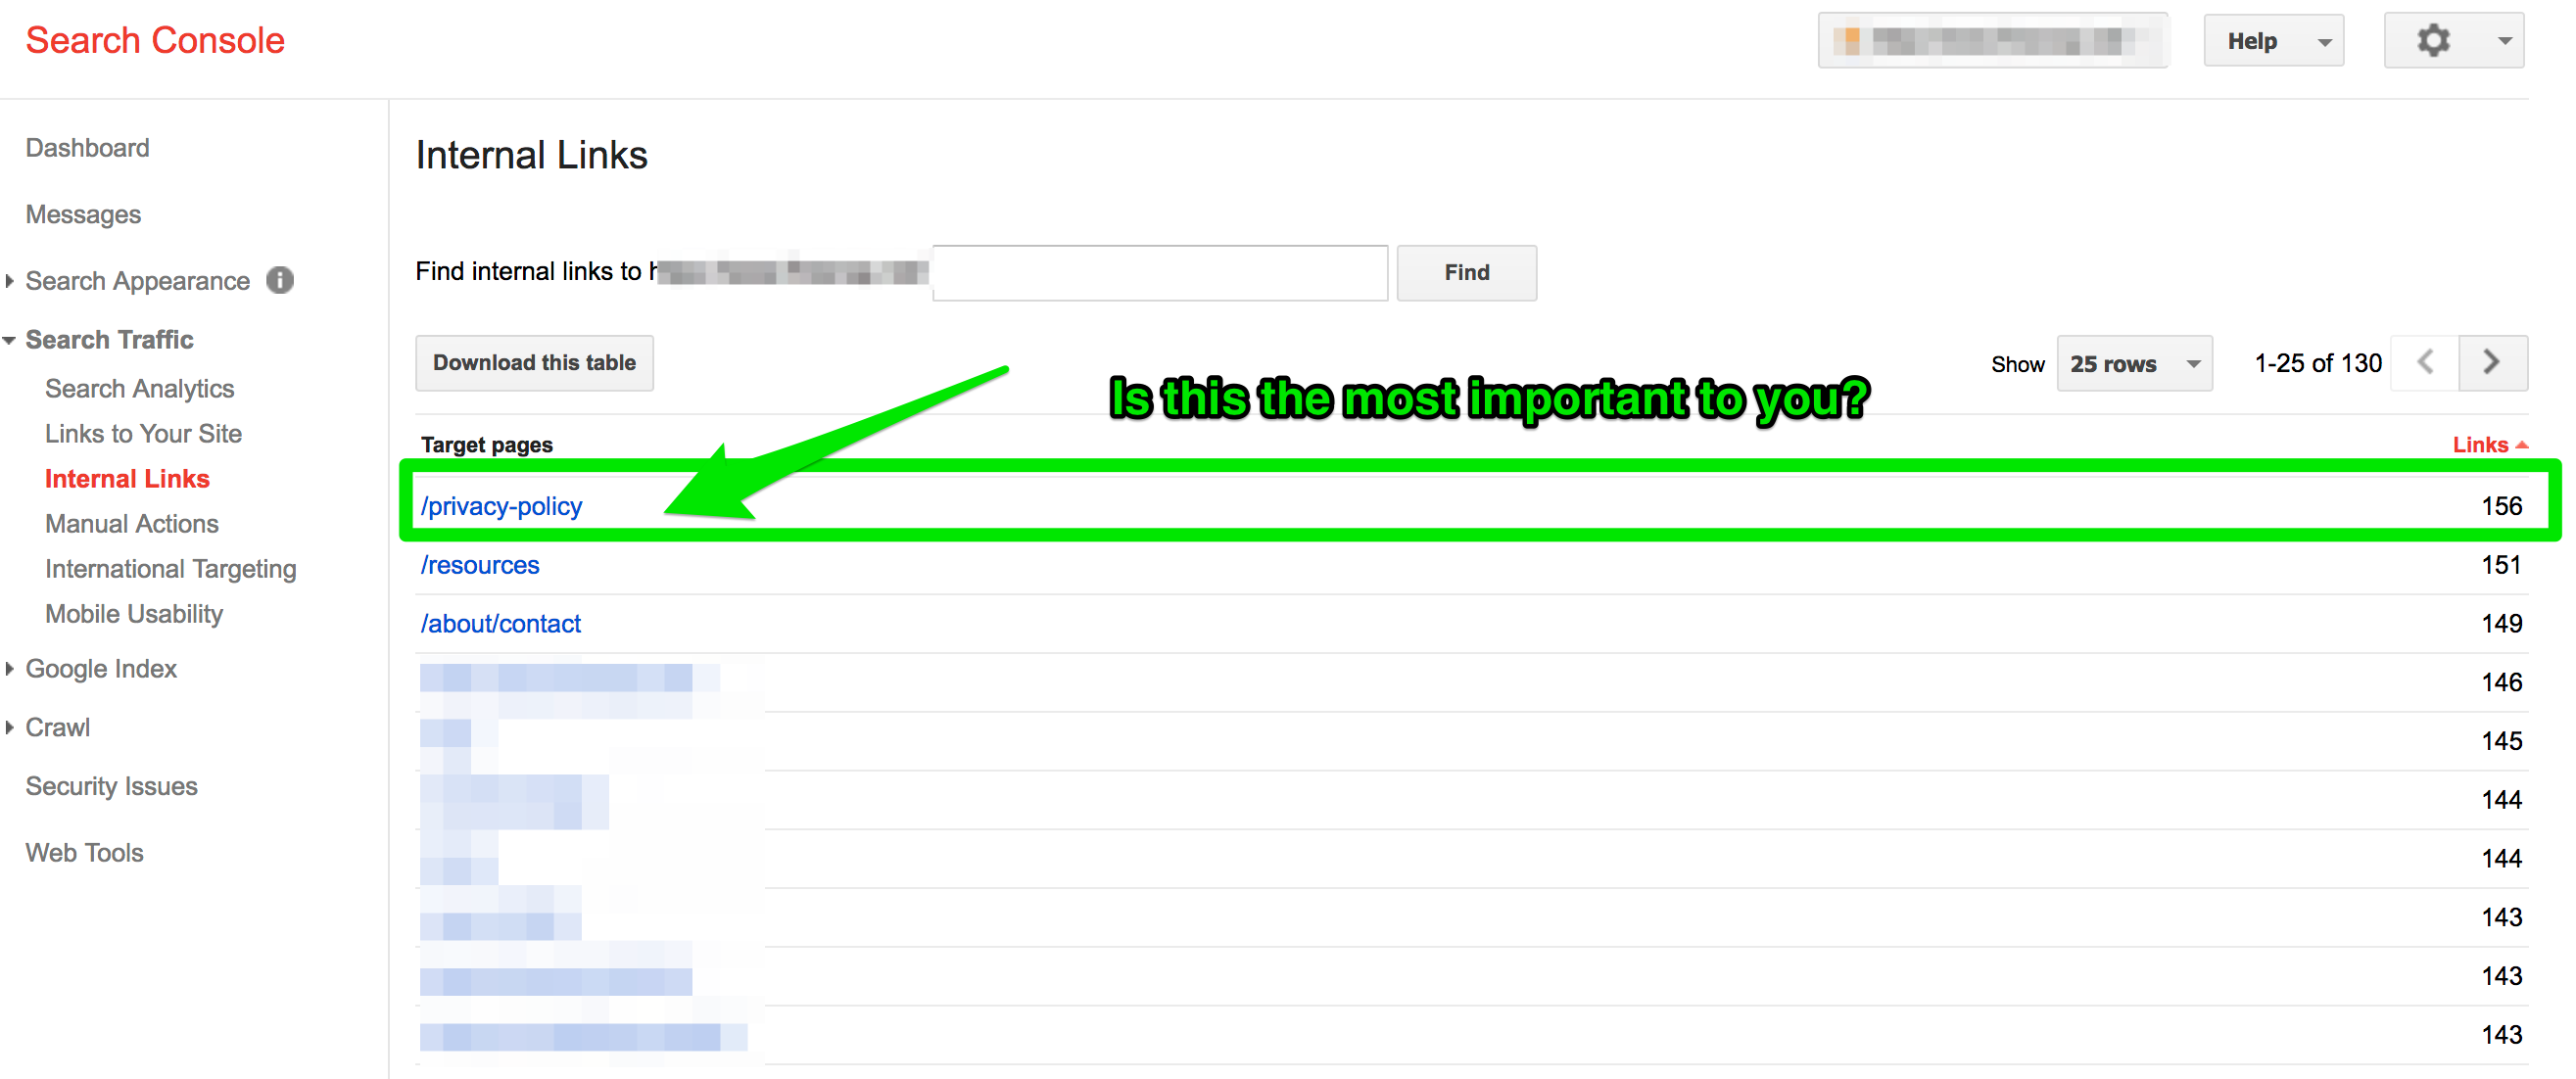
What is the Internal Links report?
The importance of internal linking has been drilled into our brains since we started to learn how to write meta titles. What our SEO masters didn’t tell us? How to internally link based on our site architecture.
Just like not all backlinks are created equal, internal links can tell an entirely different story. The Internal Links report tells Google what you believe necessary on your website.
How do I use the Internal Links report?
If you’re an A/C company and your web page about A/C repair is the most important page to you, but you’re linking to your About page the most then you’ll want to revamp your internal linking map.
Manual Actions
What does the Manual Actions report in Google Search Console tell us?
Let’s hope you never have to use this section.
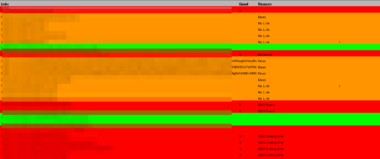
If you violate Google’s guidelines, you will receive a notification in the Manual Actions report. If you do, it might look something like this:
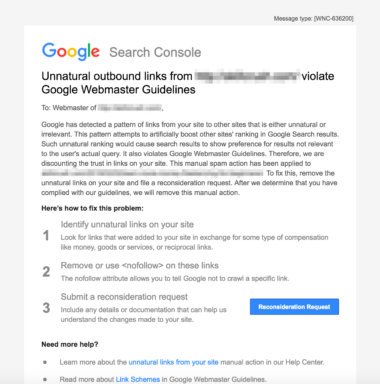
Here’s a complete list of Google Manual Actions.
How do I remove a Manual Actions in Google Search Console?
If you receive a manual action notice, you’ll have to submit a reconsideration request. There is a ton of work that needs to go into a reconsideration request.
A reconsideration request takes time and quick actions from your team.
Here’s a quick overview of the steps I’ve taken in the past to recover a new client from unnatural links to the site:
- Created a link removal campaign to remove all spammy links.
- Used Google spreadsheet to document the link removal work. Google wants to see how many times you emailed a website to remove the links and the steps you’re taking to monitor backlinks in the future.
- Submitted disavow file to Google.
- Write a documented letter explaining why this happened and the steps you took to remove the links.
International Targeting
What is the International Targeting report?
If your website has multiple languages or targets a particular country, you’ll want to have HREFlang tags.
The International Targeting tool in Google Search Console will identify errors in your HREFlang tags. If you’ve ever attempted to implement HREFlang tags, you know they aren’t easy.
How do I set-up country preferences in Google Search Console?
If you’re targeting a particular country, make sure to review your traffic sources by country in Google Analytics before setting a country preference.
Google’s Gary Illyes has said on Twitter that you will not see fluctuations in traffic, but if you’re receiving a large chunk of traffic from multiple countries, just leave it alone.
To set up country preferences, follow these steps:
- Go to Google Search Console > Search Traffic > International Targeting > Country
- Once you click the check box, you’ll be able to choose which country to target.
If you don’t set up the targeting, Google will determine your location based on your website’s domain, IP addresses, links, and information from Google My Business.
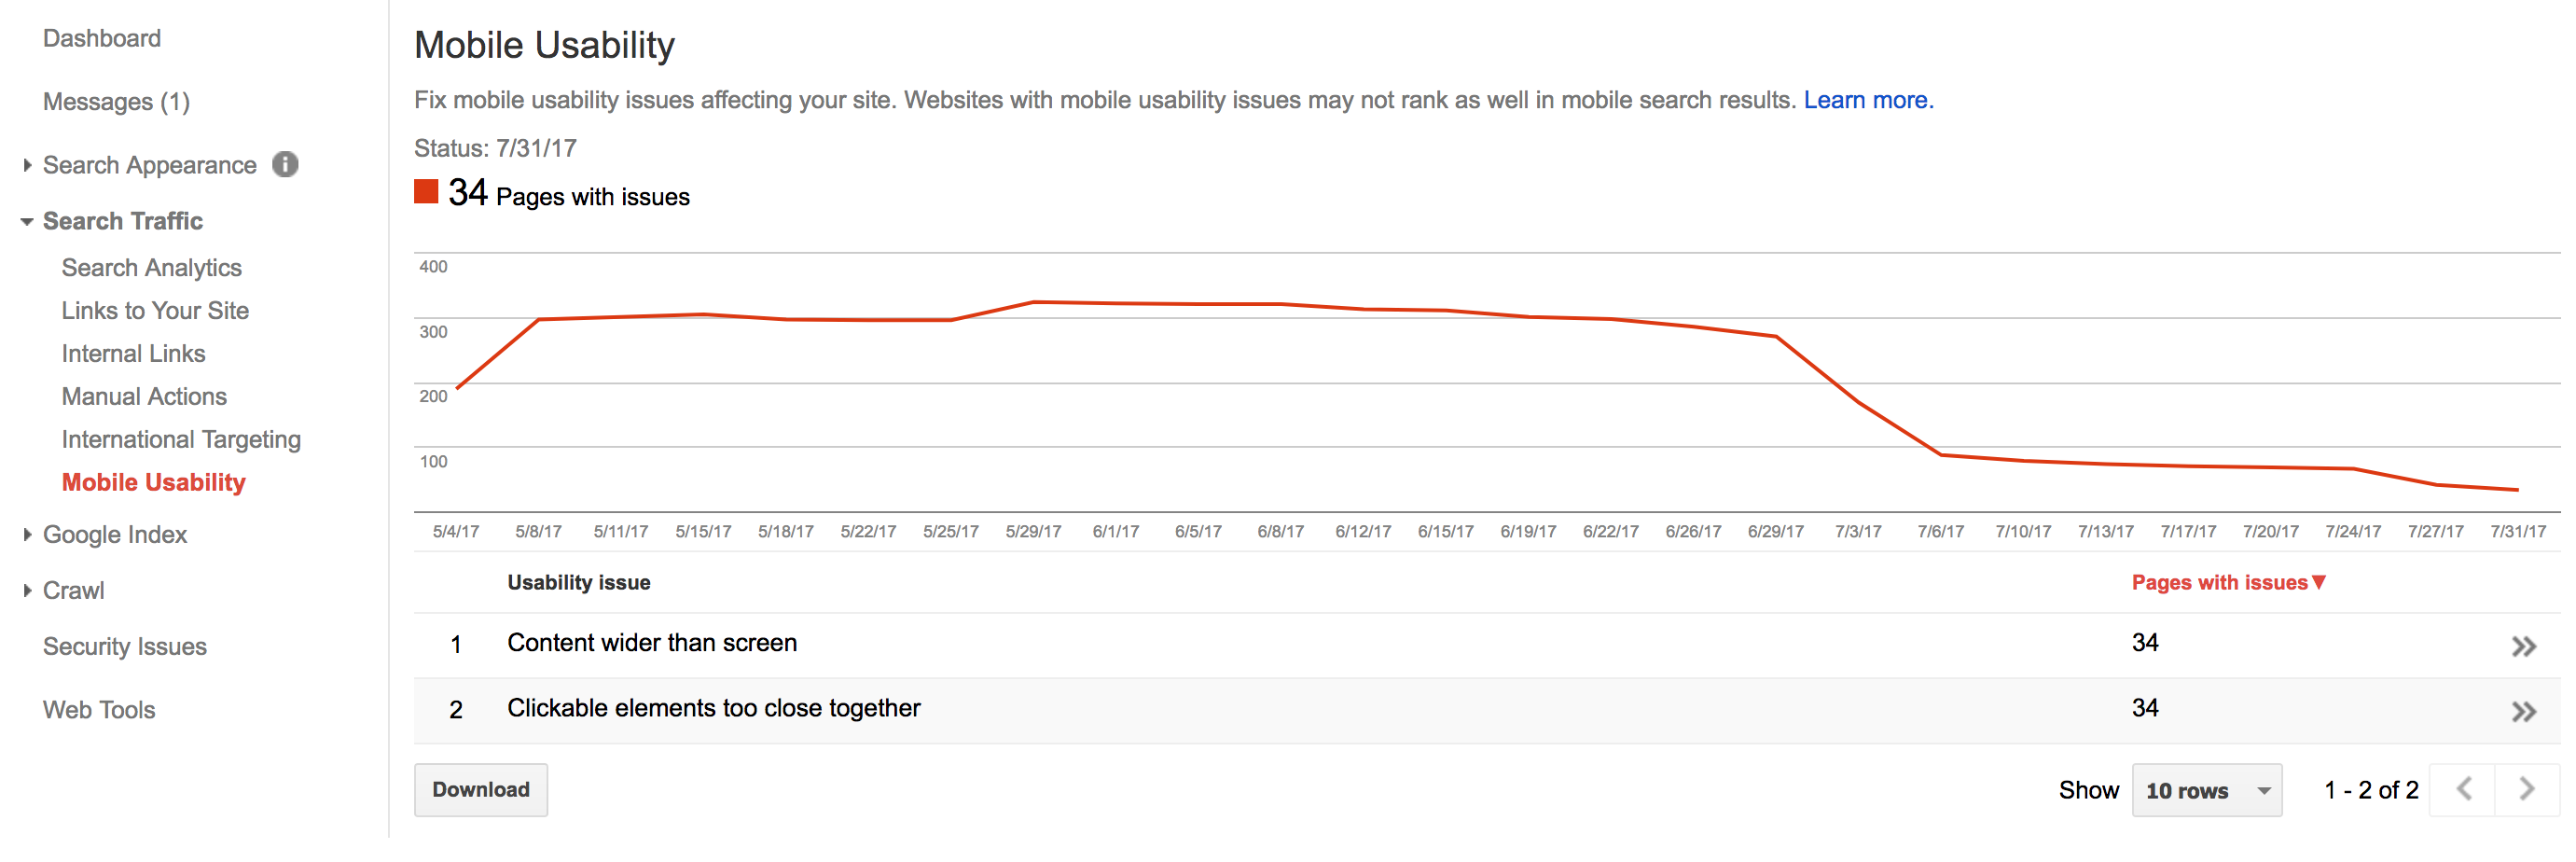
Mobile Usability
What is the Mobile Usability report?
Google launched the Mobile Usability report in Google Search Console right before the big announcement of moving to a mobile-first index.
The Mobile Usability report gives you the opportunity to troubleshoot any design and development issues with mobile.
How do I fix Mobile Usability report issues?
What starts as a well-thought web design strategy, can quickly turn into a slow, unclickable, awkwardly scrolling mess of a website, sending you into a whirlwind of zero leads and increased bounce rate.
The side-effects of a poorly designed mobile website can leave you drowning in low organic traffic and no customers.
Here are some common errors in the Mobile Usability report and how to fix them:
- Content wider than screen: Make sure your pages don’t require horizontal scrolling to view entirely.
- Clickable elements too close together: Make sure your links and buttons are far enough apart.
- Viewport not configured: Make sure your pages use the meta viewport tag to adjust the dimensions based on the device used by visitors.
Google Index
Whether you’re looking for index bloat, trying to find if CSS is blocked, or remove URLs, the Google Index reports in Google Search Console can have you spinning in circles.
I’ve battled everything from low organic traffic to Panda hits because of thin content. The Google Index reports in Google Search Console provide data on how your content is performing in the Google search.
(Note: If you’re looking for the Content Keywords section, it was removed in November 2016.)
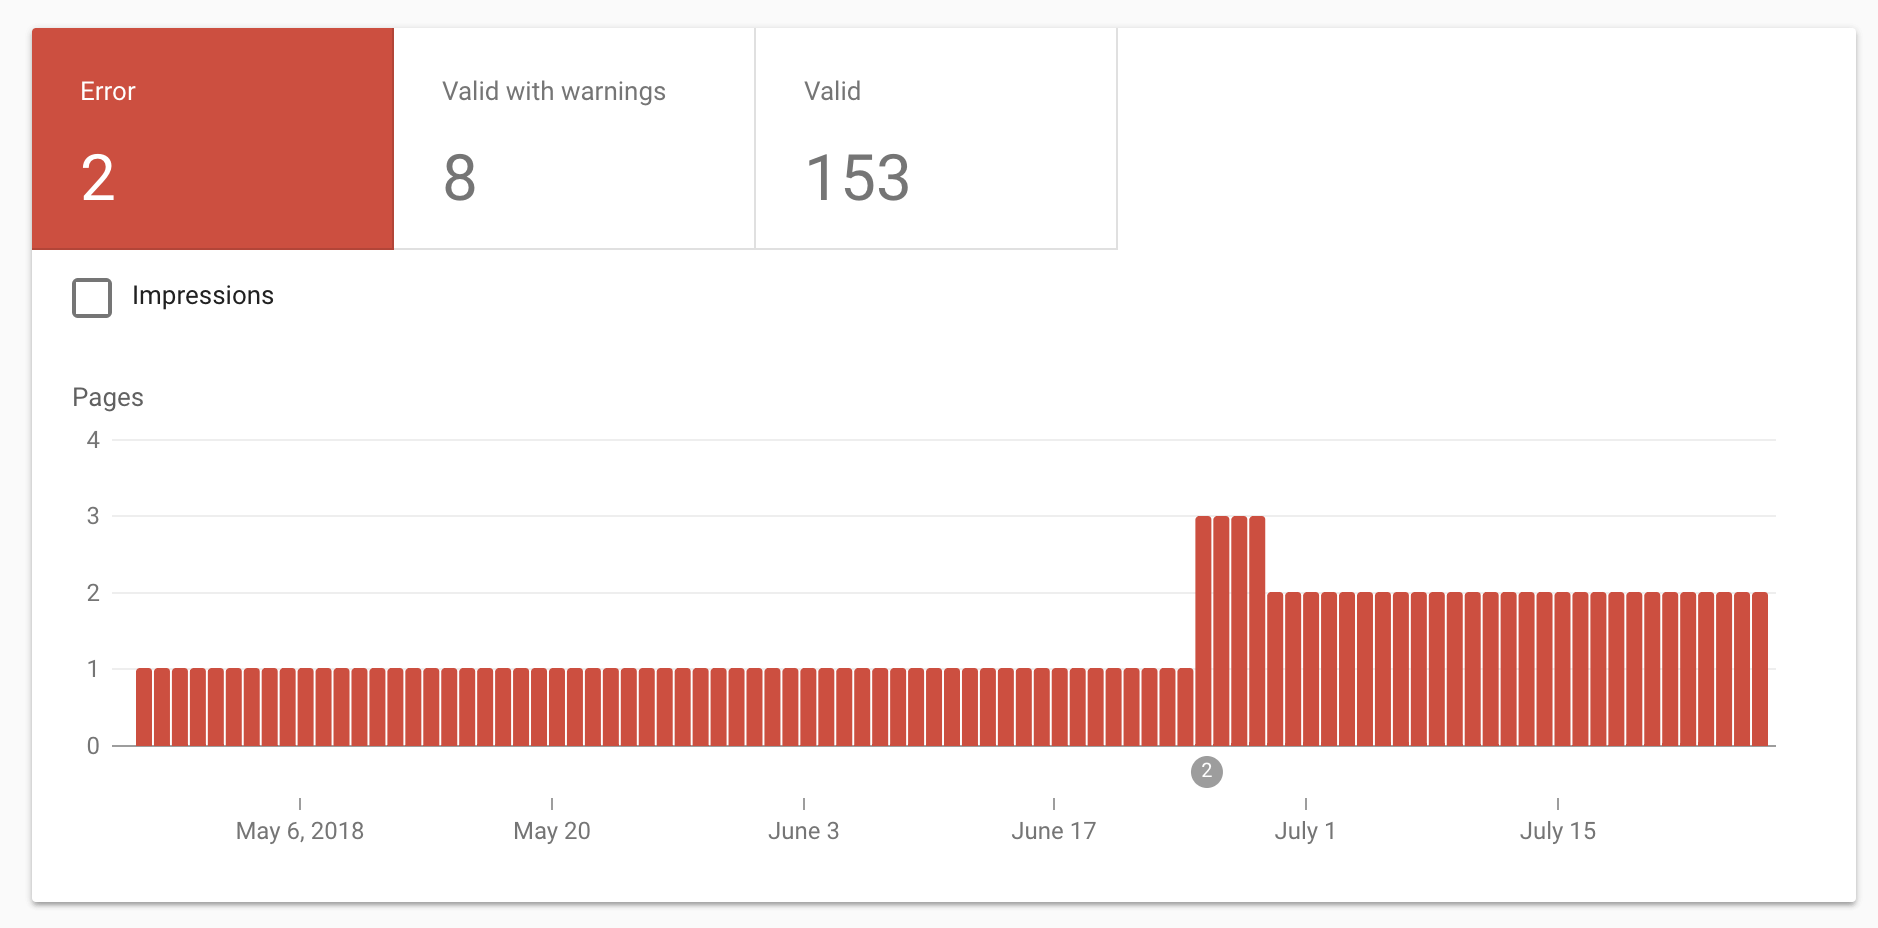
Index Coverage (older version is Index Status)
How do I use the Index Coverage report?
If you’re using the older version of GSC, the Index Status feature will show insights about your site’s URLs that Google has indexed over the past year.
In the new GSC, the Index Coverage report also displays all your indexed pages and all the pages that are not included in your sitemap.
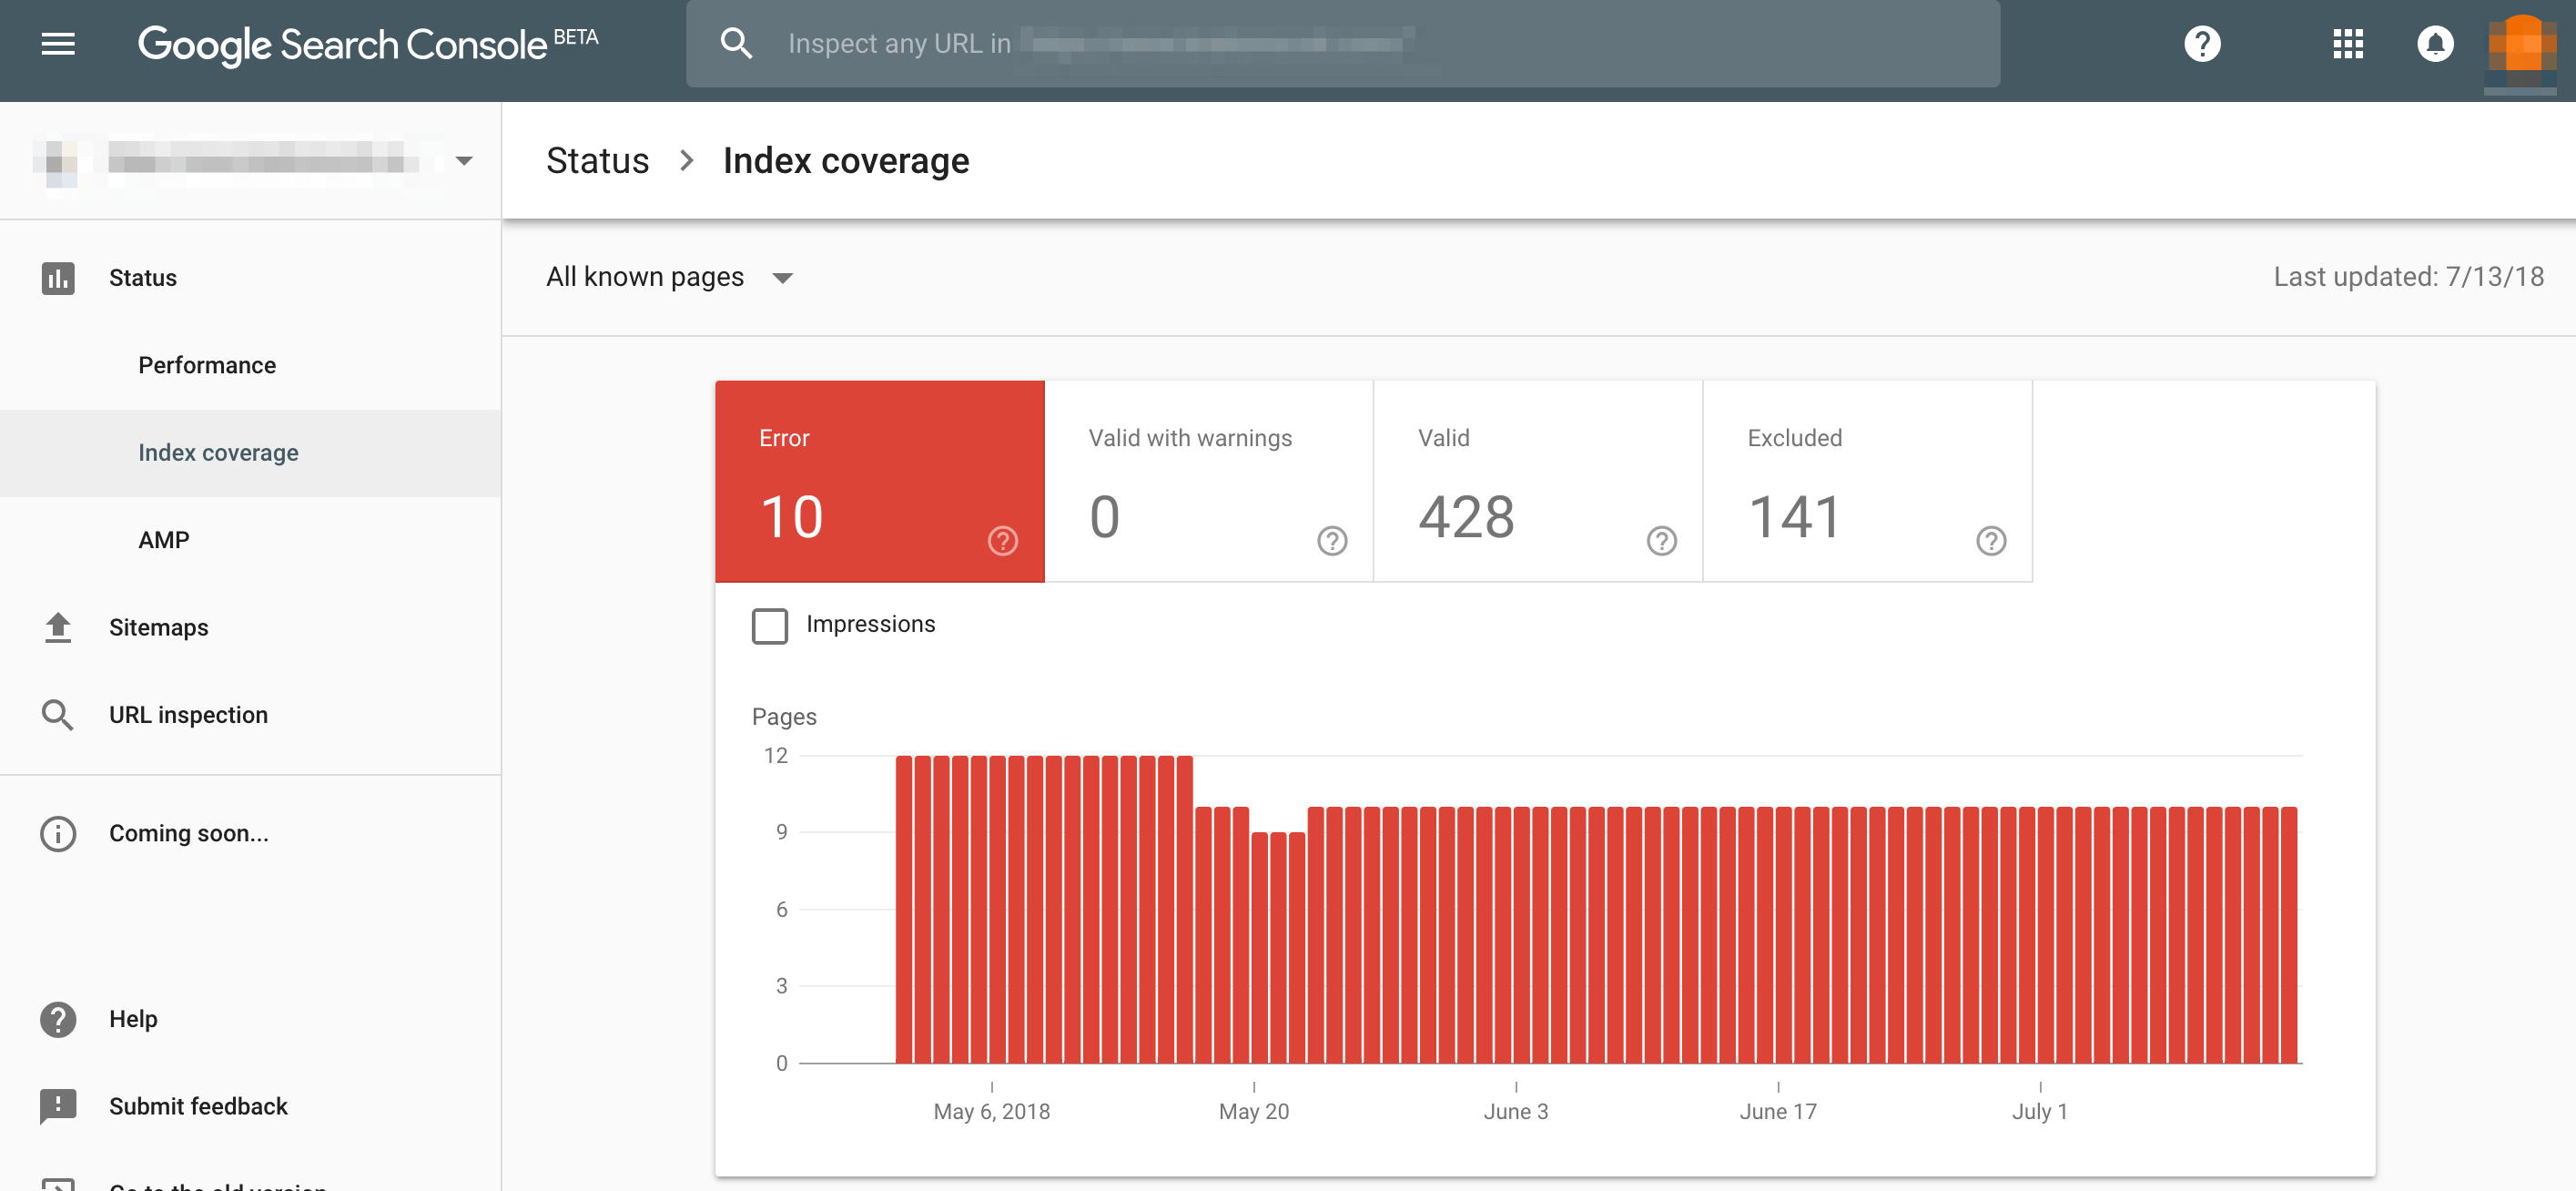
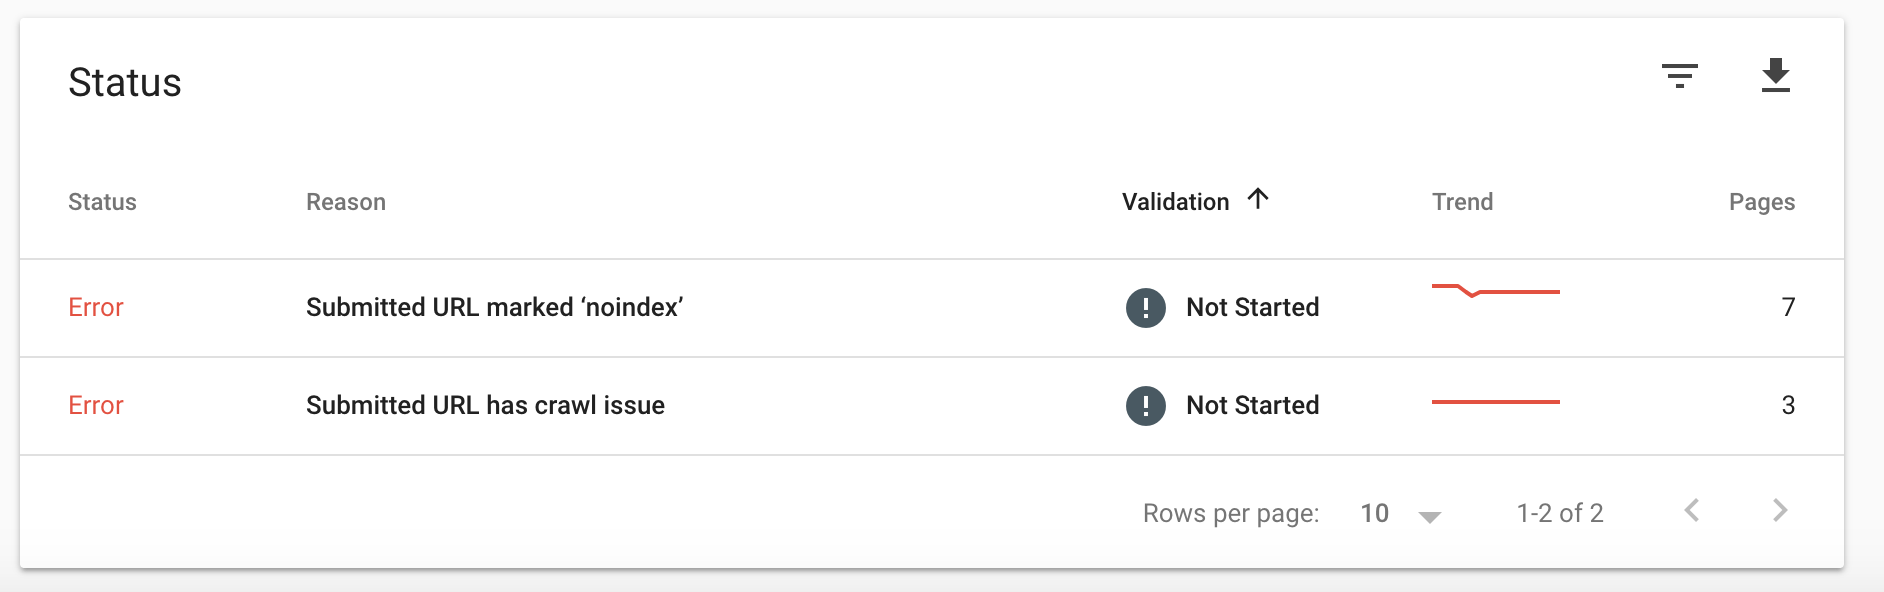
It will also provide a list of errors, something like this:
Also, you’ll want to monitor this report to make sure there are no large increases or decreases in your indexed pages.
I like to use this report to determine if there is index bloat. By pairing the data from Google Search Console to Google Analytics, webmasters can find out if they are the unfortunate receivers of index bloat.
You want to see if the number of pages in the Index Coverage Report match the number of landing pages receiving organic traffic in Google Analytics. If they don’t match, it most likely means a small fraction of your indexed pages are receiving traffic.
How to find index bloat in Google Search Console?
To find index bloat follow these steps:
- Go to the new Google Search Console > Status> Index Coverage. You may see something like this:
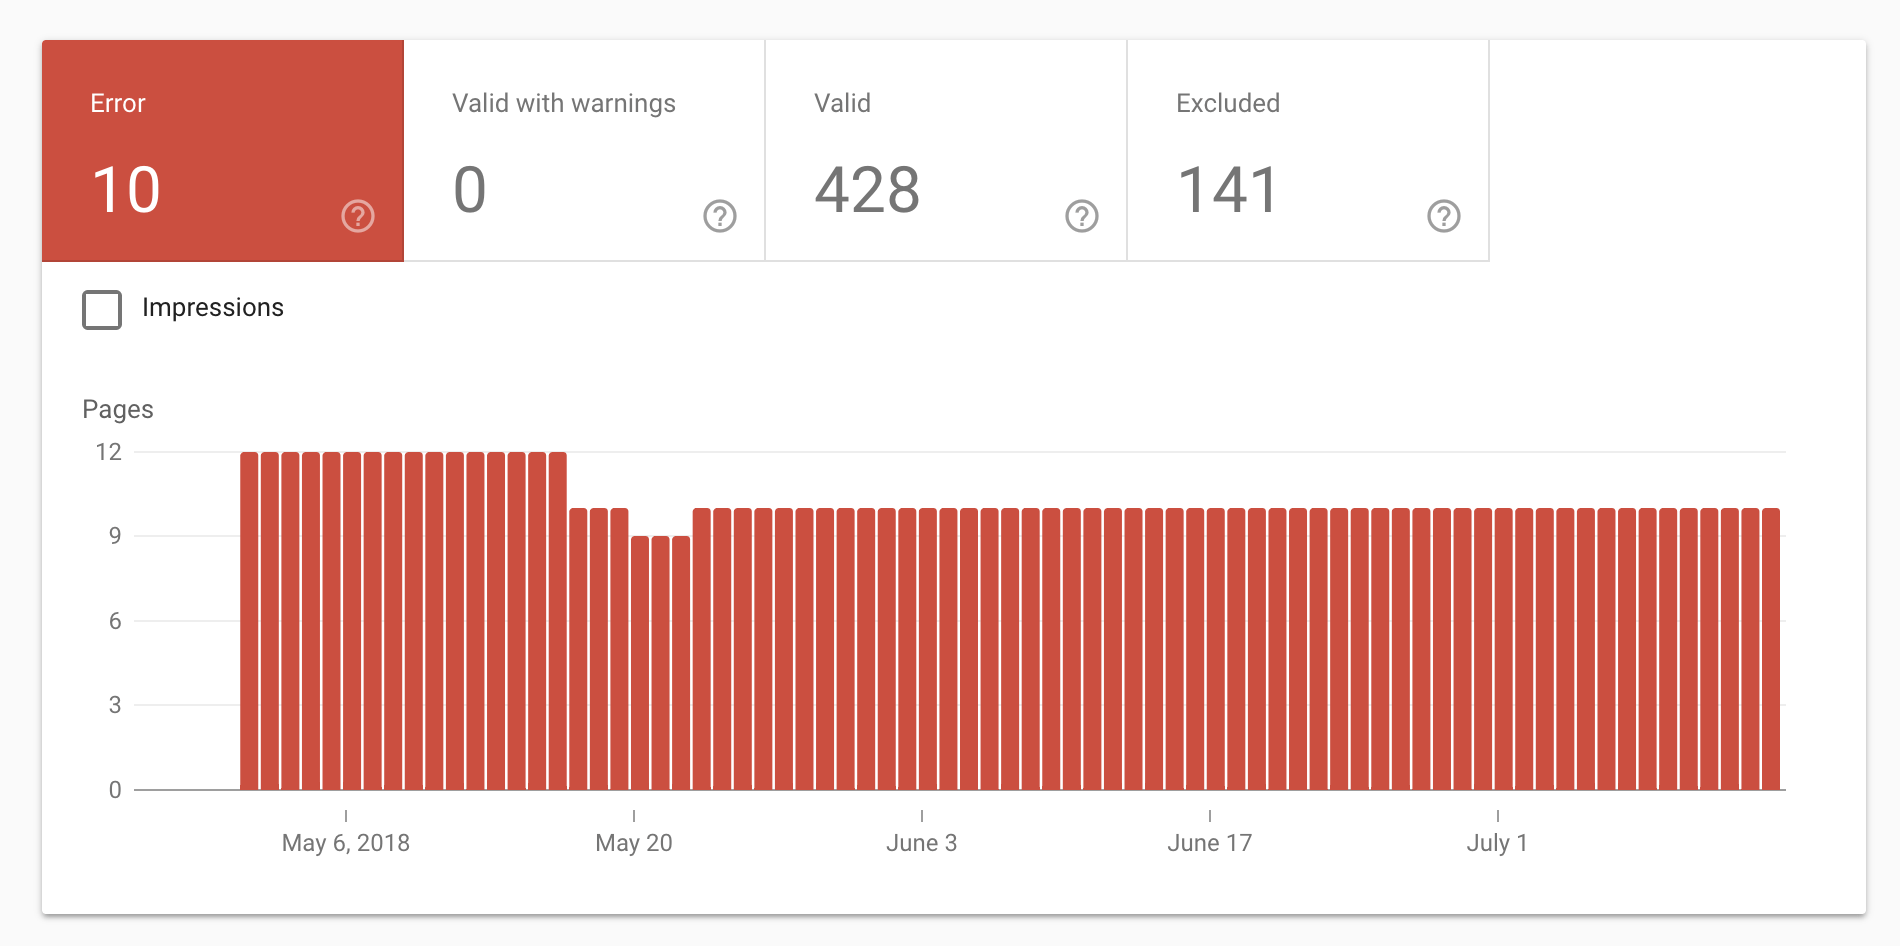
- Go to Google and perform a site:[insert website url] search
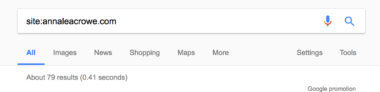
- Dig through each page of the search results to find a pattern in the parameters of each page.
- If you notice pages being indexed that you don’t want to be indexed, go back through and add the noindex tag to each page and disallow them in the robots.txt file.
Blocked Resources
What is the Blocked Resources report?
The Blocked Resources report tells Google what is blocked by your website’s robots.txt directives.
The most common items you’ll see blocked are JavaScript and CSS. Here’s an example:
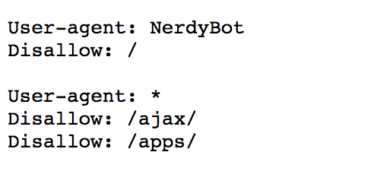
They are blocking AJAX. This means Googlebot can’t render the pages using JavaScript and may affect your rankings.
How do I fix blocked resources?
To unblock URLs follow these steps:
- Remove them from the disallow section of your robots.txt.
- Test the updated robots.txt file in the robots.txt tester tool in Google Search Console.
- Check pages to make sure they are not using the noindex, nofollow tag.
- Run the URLs through the Fetch As Google tool to make sure they are being rendered correctly.
Here’s a look at two blocked resources from a client site:
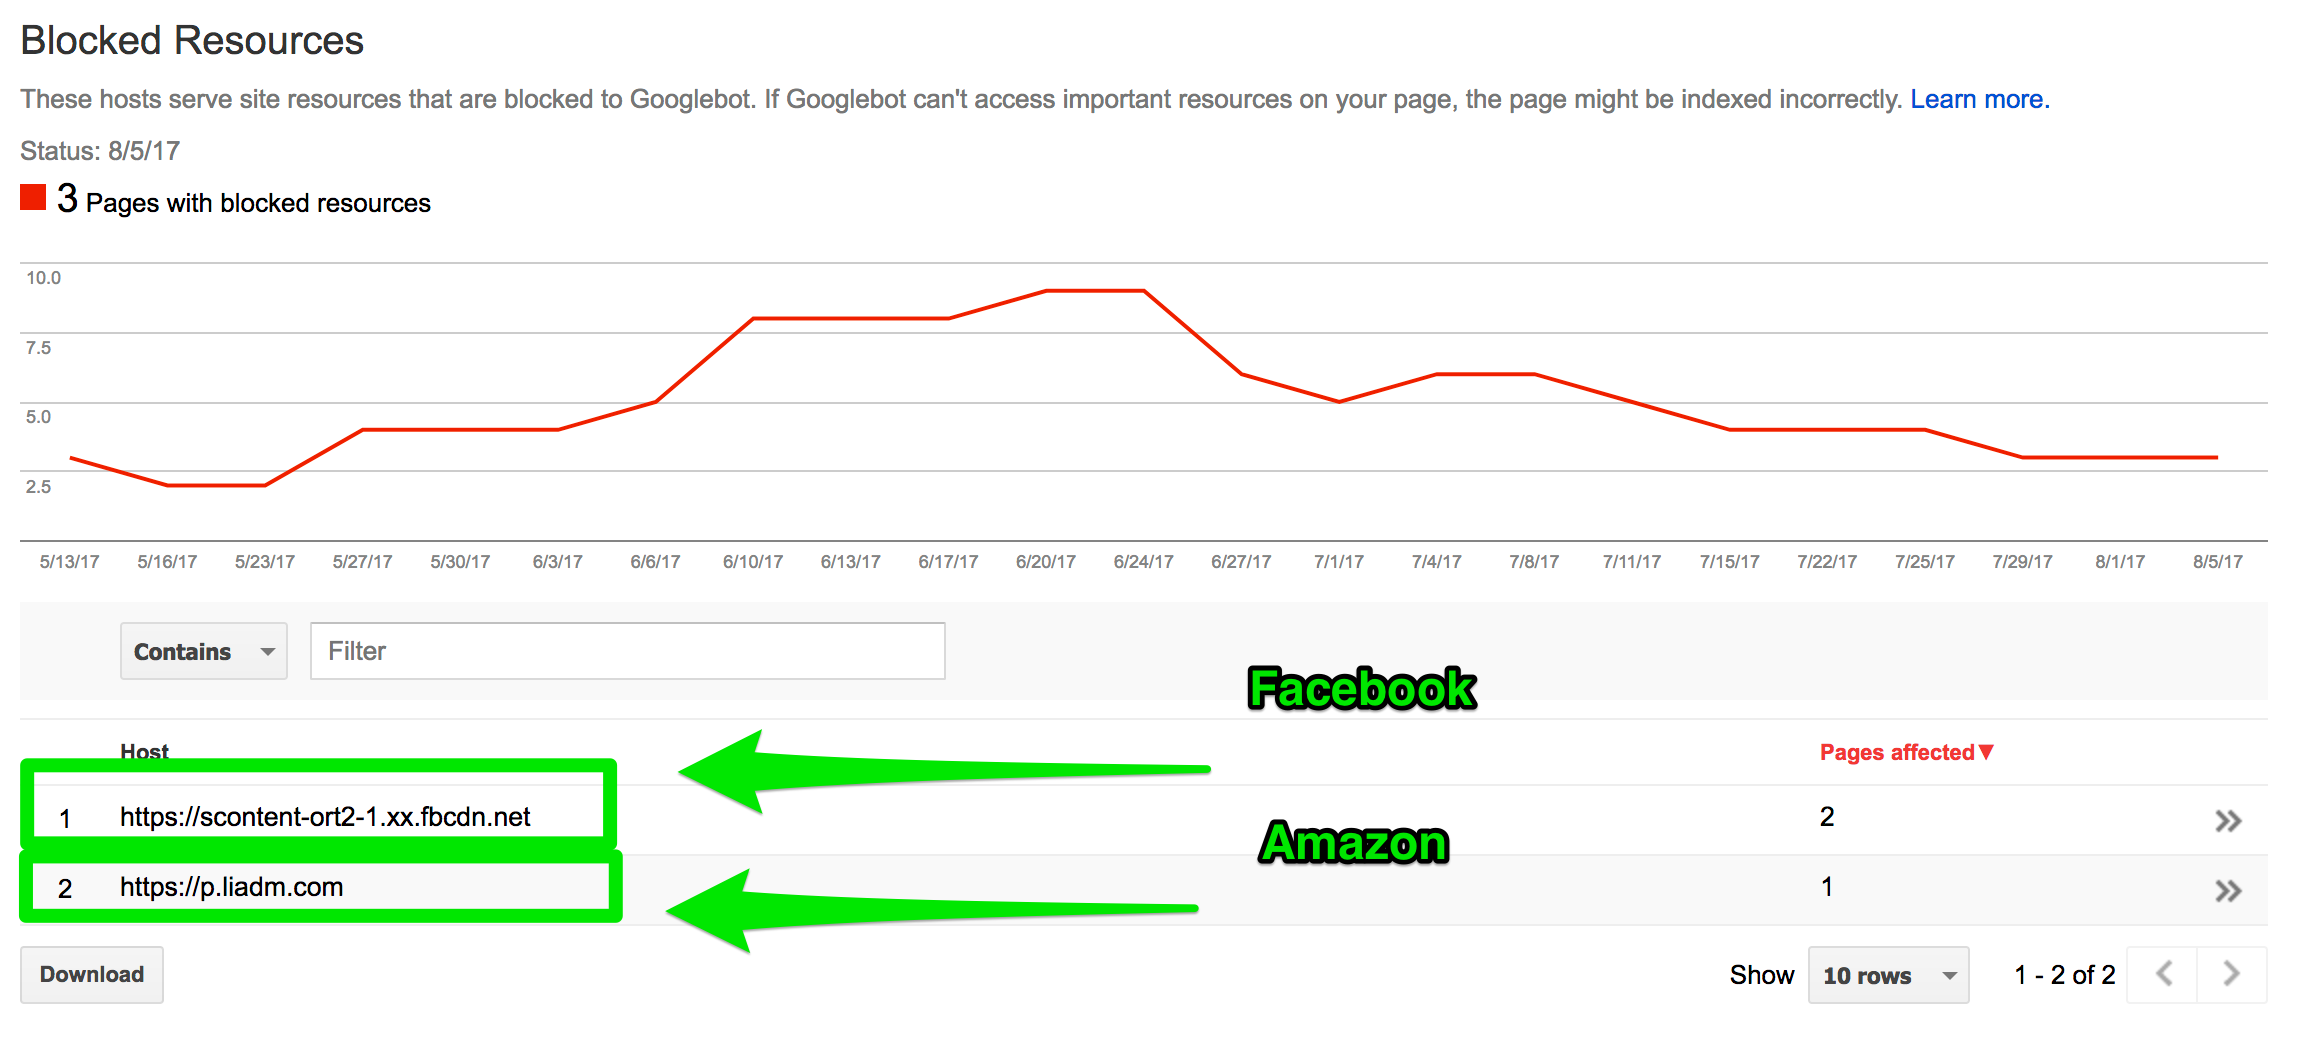
The first blocked resource https://scontent-ort2-1.xx.fbcdn.net is from Facebook. There’s nothing I can do about this from my end.
The second blocked resource https://p.liadm.com is associated with Amazon, which wouldn’t surprise me since they are using Amazon as their CDN.
Remove URLs
What is the Remove URLs tool?
The Remove URLs tool can be, in a word, complicated. It’s a universal truth that at some point every SEO professional will have a client suffering due to thin or duplicate content.
If you want to temporarily hide something from Google searches (like massive amounts of thin or duplicate content), you can add the URL to the Remove URLs tool in Google Search Console.
This temporary removal will hold for 90 days, and it takes about a day to process.
How do I use the Remove URLs tool?
In the past, I’ve used this tool to not only quickly clean-up thin or duplicate content before Panda comes rolling in, but I’ve used it to spruce up URLs will multiple case sensitive issues.
Here’s an example:
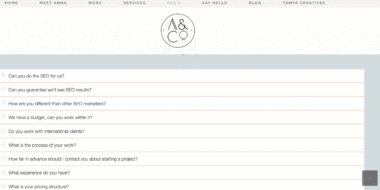
annaleacrowe.com/meet-anna
annaleacrowe.com/Meet-Anna
www.annaleacrowe.com/meet-anna
Before submitting pages to GSC to remove, follow these steps:
- Add noindex meta tag to each page
- Insert the rel=canonical tag to each page
- Disallow the pages in the robots.txt file
- Submit to Remove URLs
Think of this tool as a secret weapon to call out of retirement only when needed.
Crawl
We live in a mobile era. SEO pros are no longer just glancing over data; rather they’re diving deeper to uncover exactly what issues may be affecting your website.
Whether it’s adding a 301 redirect or looking at your site the same way Google does — this data can only improve websites.
Crawl Errors
What is the Crawl Errors report?
The Crawl Errors reports tell you what pages are broken on your website. This report has two sections:
This duo can keep your server, HTTP response codes, and your different errors (404, access denied, and so on) in check.
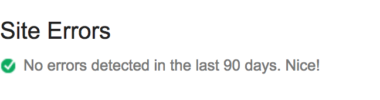
Site errors display errors from your whole website. You may see something like this:
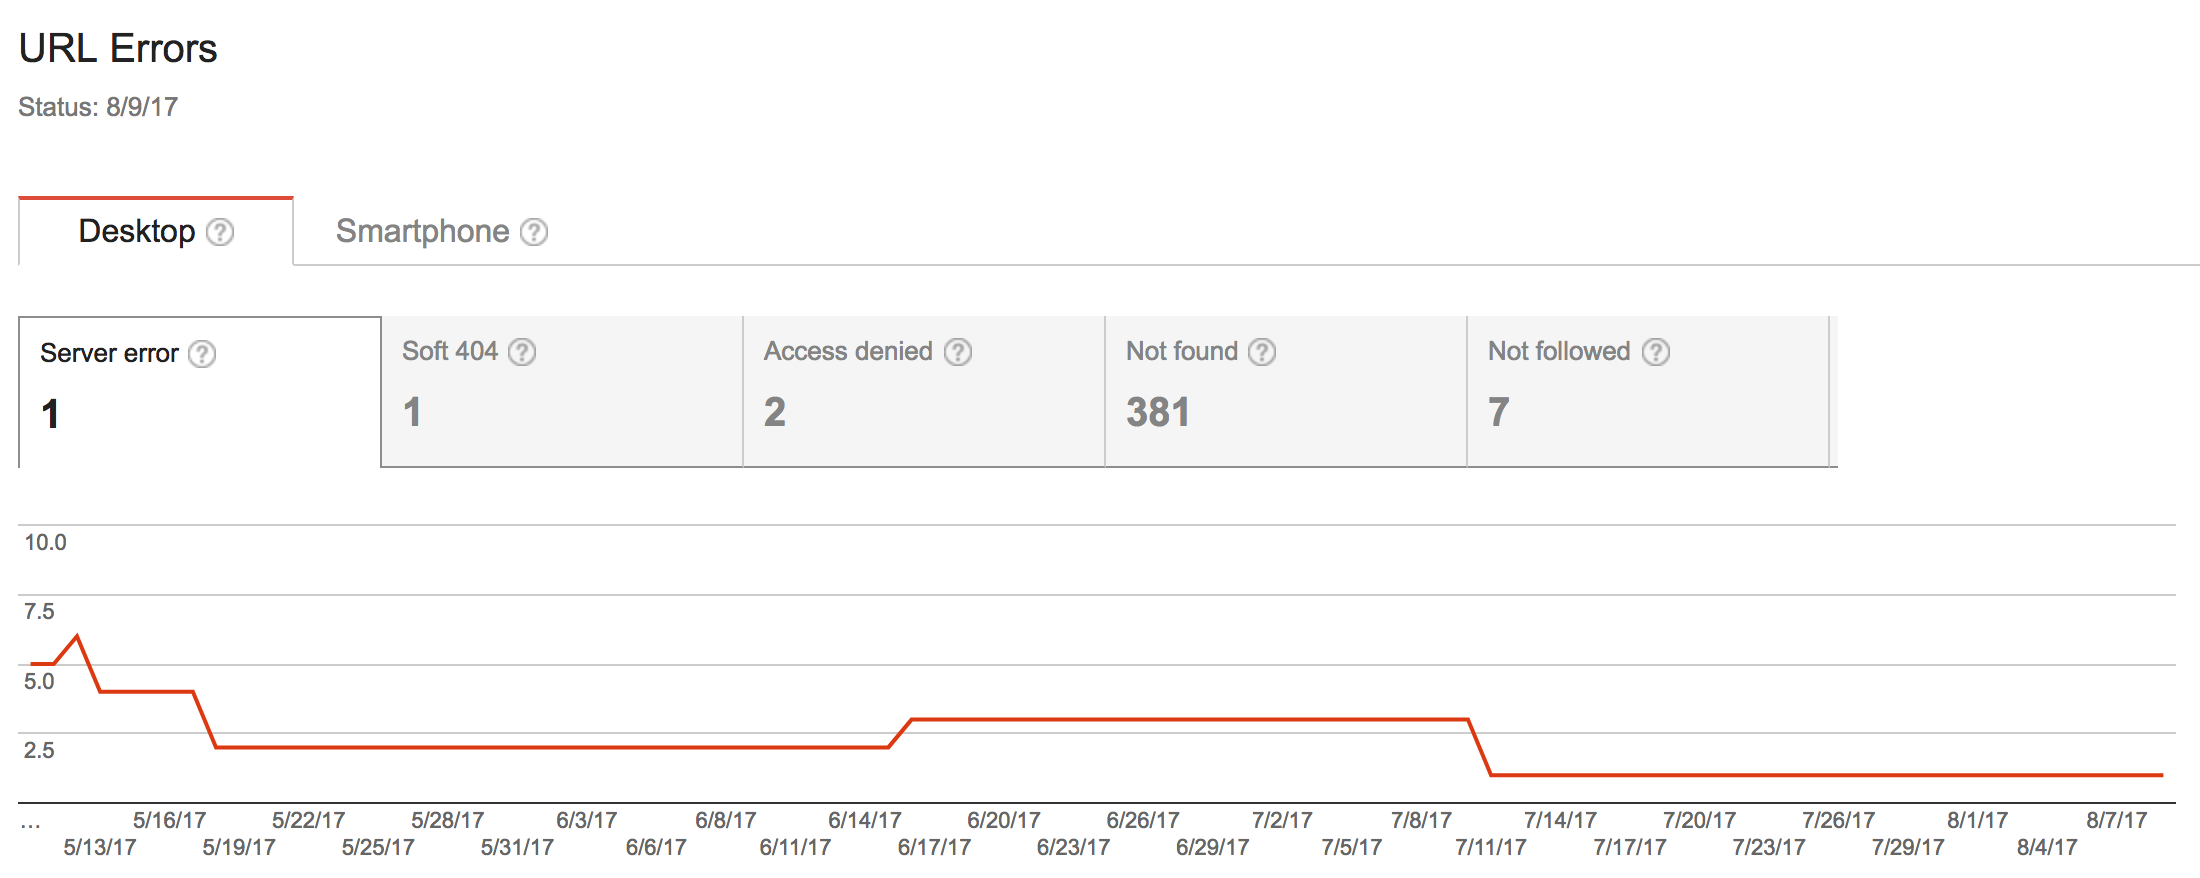
URL errors show errors from crawling pages on your desktop and mobile site. You will see something like this:
How do I fix Crawl Errors?
Some standard Crawl Errors:
- DNS (Domain Name System) error: This error means something is happening on the server side so contact wherever you’re hosting (GoDaddy, BlueHost, etc.).
- Server errors: Server errors usually happen when you’re site is being hit with too much traffic. You’ll want to dig deeper to see if it’s an issue related to the connection or timeout.
- Soft 404 errors: These errors indicate that your header HTTP response code does not return a 404 code. To fix, implement a 301 redirect if the page is dead or review the page for thin or duplicate content.
- 404 errors: These are the most common error you will get. 404 errors can happen when you unpublish a page, delete the page, etc. While 404 errors don’t impact your rankings necessarily, they can impact your backlinks. If you have 20+ backlinks pointing to a 404 page, you’ll want to 301 redirect that page immediately.
After a long month of page speed enhancements and keyword mapping, the easiest quick fixes you can do to your website are cleaning up your crawl errors.
With just one 301 redirect, you can transform a broken link to a magical nest of backlink unicorns. Meaning: If you have a broken page that is generating a lot of backlinks, 301 redirecting it will make sure you’re still getting the credit (and authority) for those backlinks.
Crawl Stats
What is the Crawl Stats report?
The Crawl Stats section in Google Search Console can often look like a hot mess of red, blue, and green lines. But, this data actually measures your crawl rate.
The Crawl Stats report tells you how often and when Google is crawling your site.
How do I use the Crawl Stats report?
A fast crawl rate means that the Googlebot is indexing your site quickly. And, as Google crawls your site more, you should see better search performance.
If you see major dips and spikes, there may be an issue with your site.
Crawl Stats comes with three reports:
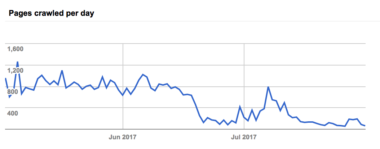
1. Pages crawled per day
Bad pages crawled per day:
Good pages crawled per day:
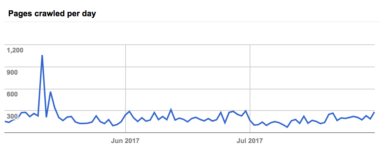
If you see a lot of spikes and dips, you may want to investigate. If you recently added new content to the site or unblocked a section in your robots.txt file, this is why you may see a significant spike.
In the example above, the client transitions from HTTP to HTTPS without a proper plan in place, so the Google was indexing both pages.
Next, let’s look at the other two charts:
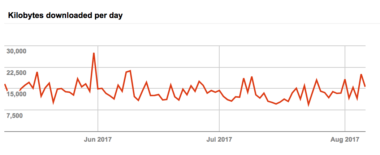
2. Kilobytes downloaded per day
3. Time spent downloading a page
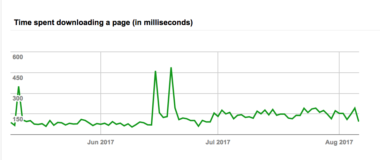
I look at how these two charts compare to each other.
If both graphs are pretty high, then you want to double check your HTTP requests to make sure you’re not hitting 20+. You can use a tool such as SEO Site Checkup to check for multiple HTTP requests happening.
URL Inspection Tool (new) / Fetch as Google (0ld)
What is the URL Inspection tool (new) / Fetch as Google tool (0ld)?
The URL Inspection tool might be one of my favorites because you get to see how Google views your website. This tool allows you to test how Google renders your site.
It’s very similar to the Fetch as Google tool in the old GSC version. If you click Fetch, you’ll see the HTTP response that Google is receiving. If you click Fetch and Render, you’ll see how your page looks in a particular browser.
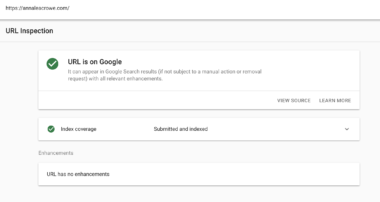
How do I use the URL Inspection tool /Fetch as Google tool?
To use the new URL Inspection tool, add your URL to the top search bar in the new Google Search Console here:

![]()
Then, you should see a report like this:
Google released a list of features for this new tool that you can read about here.
I still like to use the Fetch as Google tool to discover dynamically generated content that may be hidden. We all know how Gary Illyes feels about hidden dynamically generated content.
After you submit your URL to “fetch and render,” you’ll get a response like this:
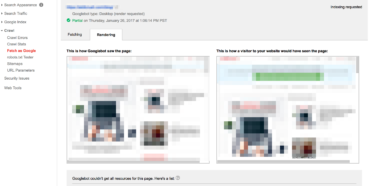
This is not to be confused with static content. Content behind click-to-expand links won’t hurt your rankings, according to Google’s John Mueller.
Meaning, it’s OK to have this:
Other uses for Fetch as Google:
- Update an old webpage
- Launch a new section of your website
- Introduce new mobile design
- Updated robots.txt file
- Implemented rel=canonical tags
- Transition from HTTP to HTTPS
Robots.txt Tester
What is the Robots.txt Tester tool?
Robots.txt files can be disastrous if implemented incorrectly. Many SEO professionals have horror stories about those clients who don’t understand why their website isn’t getting any organic traffic.
Well, the robots.txt tester tool lets you know exactly what is blocking Googlebot from URLs on your site.
How to make sure my website isn’t blocking Google?
To make sure your website isn’t blocking important pages to Google, head over to the robots.txt Tester and enter a main page URL in the text field. Click “Test” to see if it will be allowed or disallowed.
You should see something like this if the webpage is allowed:

![]()
If the page is blocked, you should see a red “blocked.”
Sitemaps (both in old and new version)
What is the Sitemaps report?
Sitemaps can feel like the mysterious man hidden behind the green curtain. So much of what you include in your sitemap, from excluding tags to removing categories, can affect your website.
Pay attention to the Sitemaps report warnings. You can view both of these in the old and new version of Google Search Console. Here is a look at the new Sitemap.
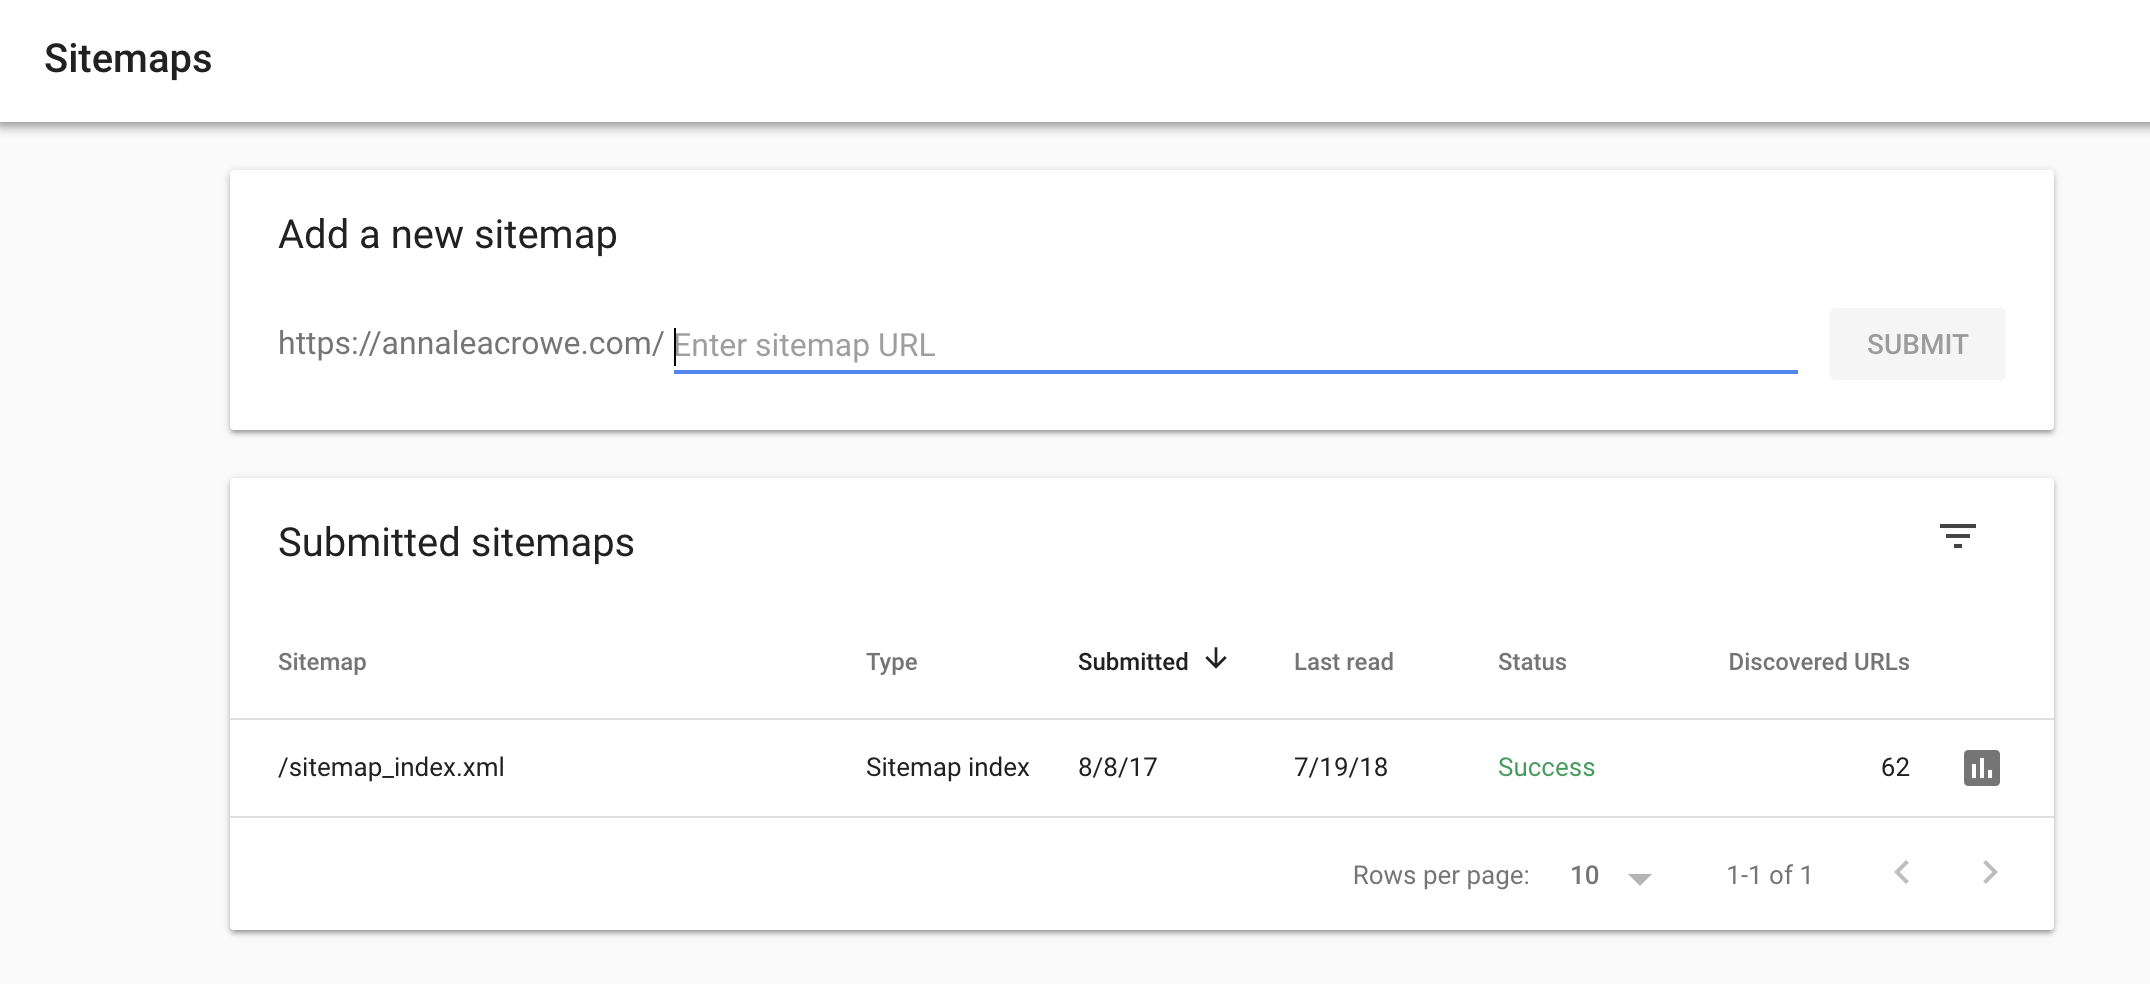
The Sitemaps report in Google Search Console shares insights to what is happening on your website. Yes, these are errors found in your sitemap, but so much more can be discovered from this error report.
How do I fix errors in the Sitemap report?
Fear not, your best defense to these sitemap errors is digging deep into the cause of why these errors occurred in the first place.
Here is a problem I’ve come across through my site audits:
A large website comes to me for an SEO audit. They have 100,000+ pages with multiple sitemaps. Awesome, right?
After taking 5 seconds to review their sitemap errors, I noticed only 1 URL was being indexed compared to 16,000 URLs from of this sitemap. After more investigating, I saw an uppercase letter in the sitemap entry.
After fixing the entry, 83 percent of the pages were indexed in 2 weeks and 2,357 percent increase in traffic.
URL Parameters
What is the URL Parameters tool?
There’s nothing worse than discovering your website is flooded with duplicate content. And, it always seems to happen at the worst times — launching a new product, holiday season, the first day of your vacation.
So, how do quickly fix duplicate content issues?
The URL Parameters tool.
This tool displays all the parameters used on your site.
For example, you might see something like this:
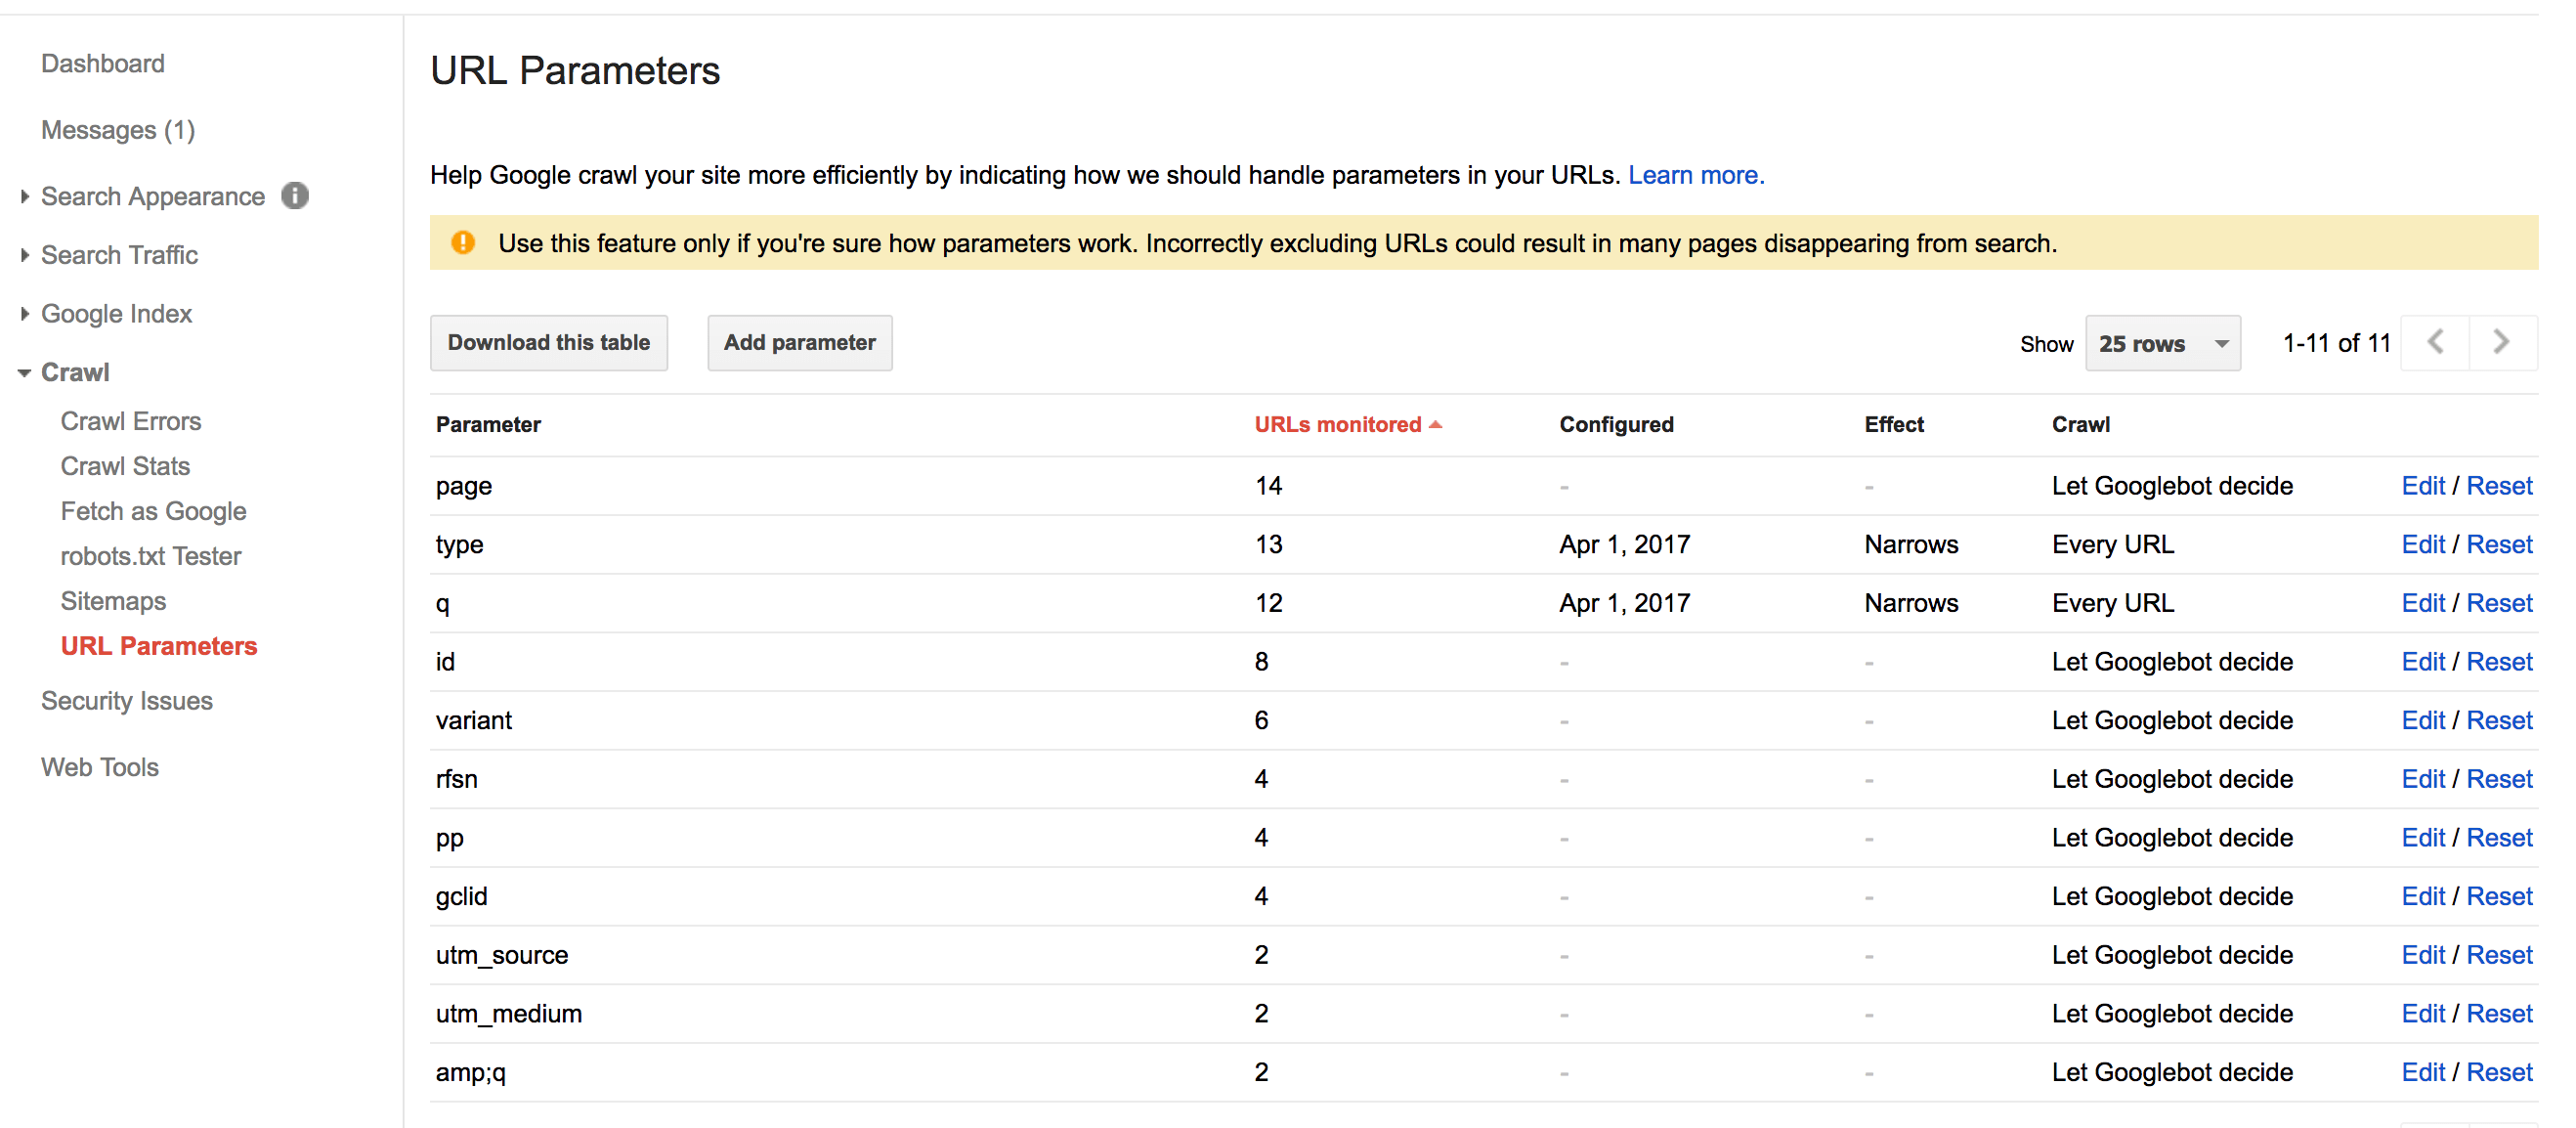
How do I use the URL Parameters tool?
With the Parameter URL tool, you can set preferences for Google on how you want them to treat each of the parameter types.
Here’s a good example of how comments can turn into duplicate content if you don’t set up your parameters correctly:
While SEO pros know that using canonical tags can protect you from duplicate content, it doesn’t prevent you from wasting your crawl budget which could lead to index bloat.
Using the Parameter URL tool can help you manage crawl budget and duplicate content in one place.
What’s Next for Google Search Console?
Now you know why Google Search Console is an essential tool for SEO professionals.
But what’s next?
Based on the changes Google Search Console has been making, we can expect to see more:
- Cleaner organization with a focus on mobile
- New index coverage report to provide better insight into website errors
- Better notification system for new issues
Image Credits
All screenshots taken by author. Taken August 2017 and August 2018.
Subscribe to SEJ
Get our daily newsletter from SEJ’s Founder Loren Baker about the latest news in the industry!
