Ad blocking software doesn’t just block ads. It also blocks most tracking beacons used by analytics tools, such as Google Analytics, Adobe Analytics, and others.
Jason Packer, with Quantable, an optimization and consulting firm, published last year the results of an interesting experiment to measure the number of web visits that block Google Analytics. He provided a breakdown of seven ad blocking extensions and whether they block Google Analytics by default. His experiment found that 11 percent of site visitors now block Google Analytics.
How to Test
One of my clients received complaints recently from site visitors about product images not getting displayed. When I researched the issue, it turned out that a popular ad blocker was causing the problem. We reported the issue to the ad-block developer, and he fixed it. But in reviewing the ad blocker behavior, I realized it was also blocking Google Analytics.
Here is one way to check if ad blockers affect your analytics package, and other tracking scripts, from accessing your site.
- Install uBlock Origin. This is an ad blocker that blocks Google Analytics by default. (It has 8.7 million users in Chrome and 3.8 million in Firefox).
- Open Chrome Developer Tools (View> Developer > Developer Tools) and click on the Console tab.
- Look for messages in red letters “net::ERR_BLOCKED_BY_CLIENT” beside: https://www.google-analytics.com/analytics.js.
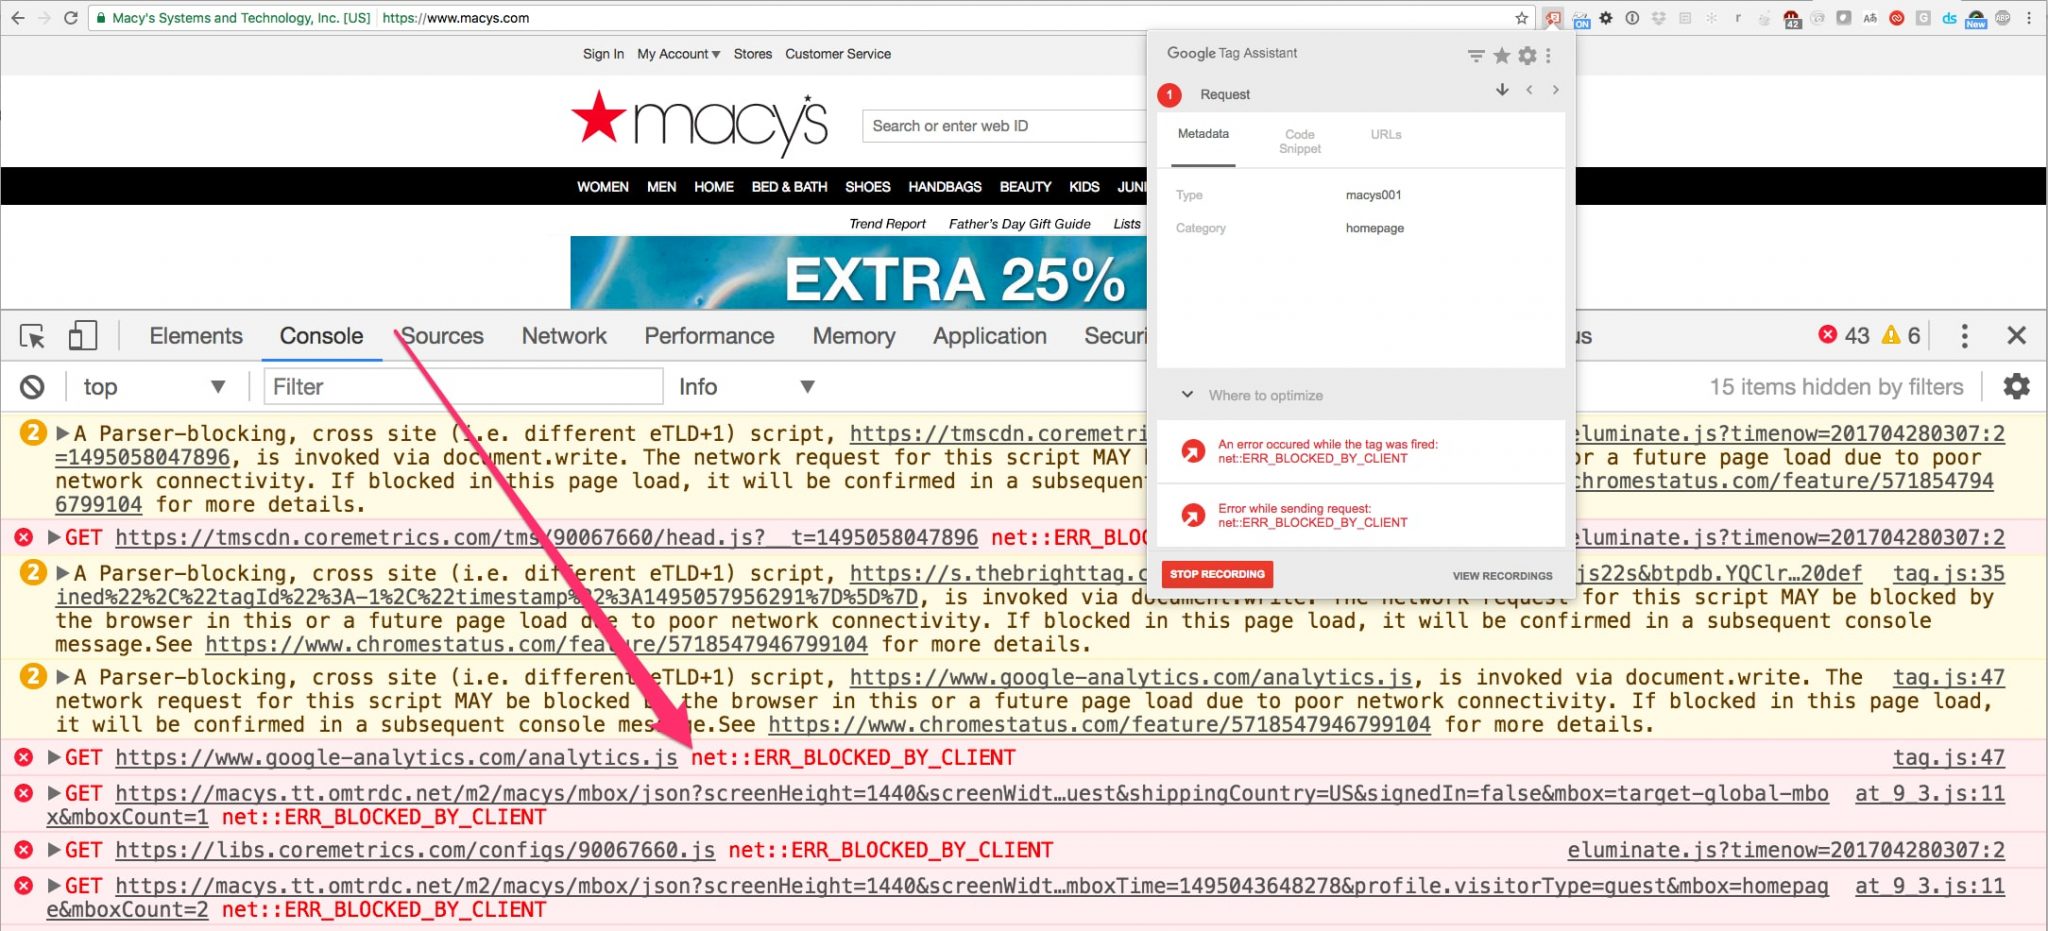
Open Chrome Developer Tools and click on the Console tab. Look for messages in red letters “net::ERR_BLOCKED_BY_CLIENT.” Click image to enlarge.
How Big Is the Problem?
To investigate the scope of the problem, I recently convinced clients and friends to participate in an experiment. I wrote a simple piece of JavaScript that fires one of two 1×1 pixel images depending on whether Google Analytics was loaded or not. Then, I asked the clients and friends to install one line of JavaScript on the footer of their sites. In a couple of weeks, I have measured around 210,000 unique visitors.
The results have been surprising.
I grouped the participating sites into B2C, B2B, and travel. The travel sites are in the U.K. All of the sites reported Google Analytics blocking. Jason Packer, from Quantable, found a bigger share of blockers in Europe than in the U.S., with more blocking on desktop computers.
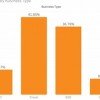
After the U.K.-based travel sites, our B2B clients saw the second-highest blocking, at 36.76 percent. B2C sites — mostly in the apparel and luxury goods industries — saw the smallest ratio of blocker usage, at 13.47 percent.
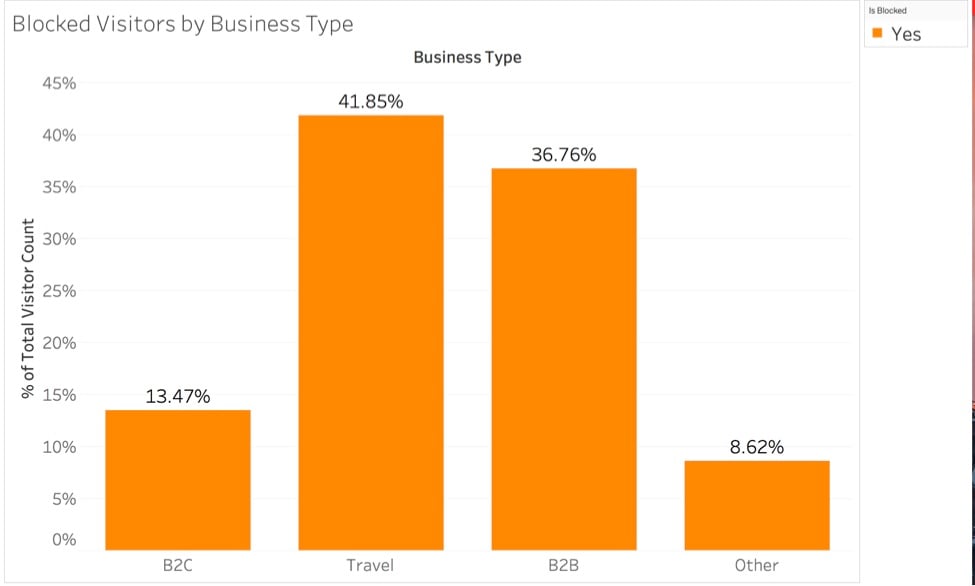
In the experiment, ad blockers were used by 41.85 of visits to travel sites, 36.76 percent to B2B sites, and 13.47 percent to B2C sites.
I also wanted to understand what operating systems and web browsers are leading the Google Analytics blocking. I was surprised to see Chrome (owned by Google) as the top browser blocking Google Analytics (also owned by Google) in Windows and Android (also owned by Google). Safari came out on top on Mac, but not on iOS, which was surprising.
Next, we looked at where the blocking visitors were coming from, and found the U.K. and U.S. as the top countries with analytics blockers.
Key Implications
To be sure, blocking Google Analytics does not directly impact ecommerce sales. As long as visitors can complete their purchases, sales will not be affected.
But the broader issue for ecommerce merchants is the ability to make the best decisions to improve marketing and sales performance. If, say, 11 percent of your traffic from advertising is not reported, your performance reports would be incomplete, which could affect your budget decisions.
In fact, blocking analytics access raises important questions for merchants.
- How valuable are the visitors that you are missing? If you are paying for them, you are already seeing big discrepancies between your analytics and the reporting on advertising vendors dashboards. Which reporting do you trust to guide further investments?
- How is this gap affecting your channel performance evaluations and corresponding budget allocations, including results-based incentives?
- Are these gaps affecting conversation rates? If so, are they affecting the data-driven experiments you’ve undertaken to continuously improve your site?
How to Fix
I’ve found a two-step solution for addressing the ad blocker. The steps expand on Jason Packer’s work and his source code. If you prefer a pre-made solution, my company has developed free tools that will help.
The first step involves detecting if Google Analytics script loaded. One simple way to do this is to check if the JavaScript object “ga” exists and is valid. You do this using Chrome Developer Tools > Console tab. Type “ga” and if Google Analytics loaded, you should see something like this:
“>function (a){dd("Executing Google Analytics commands.");F(1);jf.H.apply(jf,[arguments]);ge()}”
However, if you activate uBlock Origin, refresh the page, and type “ga” again, you will see something like this:
“VM2069:1 Uncaught ReferenceError: ga is not define at :1:1”
To learn what percentage of your visitors are blocking Google Analytics, get the script to fire one of two 1×1 pixel images: one when it loads, and another when it doesn’t.
Use this script as a starting point.
//save existing body onload
 var _onload_fn = document.body.onload;

document.body.onload = function () {

if(_onload_fn)
 _onload_fn();

if(!ga || (ga && ga.name != "Z")){

console.log("GA not loaded");
I hosted the images in Google Cloud Storage, and by uploading the access logs to the images to Google BigQuery, I was able to produce simple pie charts in Google Data Studio. I’ve addressed Google Data Studio and Google Cloud Storage in a previous article.
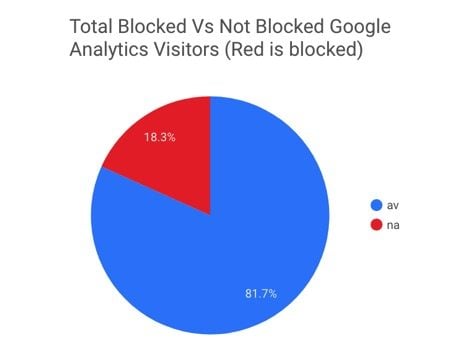
By uploading the access logs to the images to Google BigQuery, the author produced simple pie charts in Google Data Studio.
We named the 1×1 pixel images gaav (Google Analytics available), and gana (Google Analytics not available). In Google Data Studio, we created a new dimension to create the pie chart with this setting :
REGEXP_EXTRACT(cs_object, "_ga(av|na)")
The second step involves bypassing the ad blockers by sending server side events to Google Analytics when the analytics tracking script failed to load. We used Google Analytics measurement protocol for this. This library at GitHub can get you started with sending Google Analytics events server side.
Let’s develop the initial script a bit further. This code requires jQuery and Fingerprintjs2 from https://github.com/Valve/fingerprintjs2.
<script>

// these variables we pass to unblockga are the minimal stuff
 // we need to ID users and are only available on original page
 // creation, not from unblockga.php
 var screenColors =  screen.colorDepth + '-bit';
 var screenResolution = screen.width + 'x' + screen.height;
 var viewportSize = document.documentElement.clientWidth + 'x' + document.documentElement.clientHeight;
 var referrer = document.referrer;
 var fp = new Fingerprint2();

//save existing body onload
 var _onload_fn = document.body.onload;

document.body.onload = function () {

if(_onload_fn)
 _onload_fn();

if(!ga || (ga && ga.name != "Z")){

console.log("GA not loaded");

fp.get(function(result){
     // callback from fingerprint process does AJAX post via jQuery to PHP GA proxy
     // returns GA tracker code that gets eval'd as script
     var browserid = result;
     jQuery.post("/unblockga.php",
    {
                screenColors: screenColors,
                screenResolution: screenResolution,
                viewportSize: viewportSize,
                browserid: browserid,
                referrer: referrer
    },
    null,
    "script"
     );
 });

}

}
Place the script on an external file, and load it asynchronously using:
<script src=”...” async></script>
This will avoid page time issues.