The definition of bank marketing keeps expanding. Decades ago, the usual choices were newspaper advertising, outdoor, local radio and TV, and maybe some focus groups. Today financial marketers’ palette is far bigger with social media marketing, search engine marketing and optimization, and content marketing added to the traditional methods. And beyond that “martech,” big data and analytics are part of Marketing to varying degrees.
The chief marketing officer’s task — and talent — lies in finding the ideal blend of all of these options and tools to reach and sell the bank’s target audiences. The mix differs for every institution, but the question facing every marketing director remains: Is my marketing budget large enough?
Marketing spending is never in a vacuum. Not only does it need to take into account other banks’ and credit unions’ budgeting decisions, but spending by fintech players must increasingly be considered.
A Means of Measuring Where Your Bank Stands
To help our readers gain some context as they evaluate their own budgeting decisions, The Financial Brand pulled the marketing budgets of a random sampling of banks ranging from about $250 million in assets up to about $50 billion in assets from FDIC’s call report database. We gathered yearend totals for 2015 and 2018 from the “advertising and marketing” line item, culling from the initial list those institutions that had been acquired since yearend 2018 as well as those institutions that for whatever reason did not report such expenditures for both years. Marketing expenditures don’t always fall neatly into the call report’s category — marketing technology spending, for example, may come out of the IT budget — but looking at the advertising and marketing line makes a reasonable proxy for discussion.
This database became the raw material for the calculations and analysis in this article. (Appearing elsewhere on The Financial Brand is a similar study of credit union marketing budgets.)
Some basics about the final sample:
| Number of Banks in Study | 210 |
| Average Marketing Budget | $2,582,019 |
| Median Marketing Budget | $921,000 |
| Marketing Budget as a % of Assets (Average) | 0.068% |
| Marketing Budget as a % of Assets (Median) | 0.076% |
| Largest Bank by Assets: First-Citizens Bank, Raleigh, N.C. | $35.3 billion |
| Smallest Bank by Assets: Peoples Bank of Hazard, Ky. | $249.2 million |
| Biggest Marketing Budget, 2018: Frost Bank | $32.5 million 0.10% of assets |
| Smallest Marketing Budget, 2018: First Commercial Bank, Fort Worth, Texas | $16,000 0.002% of assets |
An Overview of Bank Marketing Budget Findings
Each institution’s figures tells its own story, but across the entire sample banks allocate an average of 0.07% of assets to marketing.
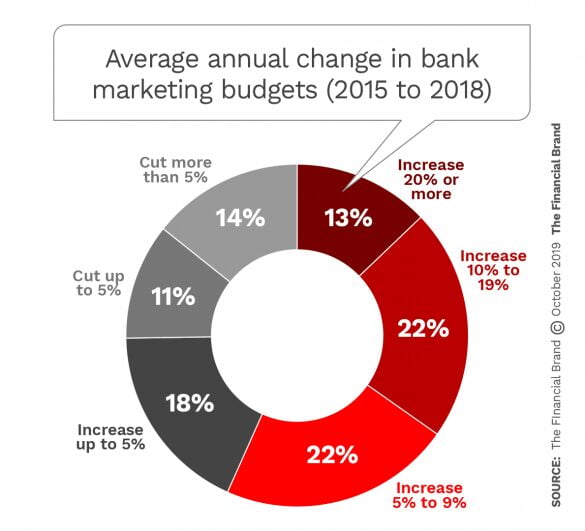
Note that three banks out of four in the sample, as shown in the pie chart below, increased annual marketing budgets in the 2015-2018 period. More than one in ten increased marketing budgets by 20% or more, on average.

As a rule, the smaller the bank, the smaller the percentage increase in their marketing budget each year. Banks with over $10 billion in assets tended to be much more aggressive. They increased their marketing budgets by an average of 10.6% every year between 2015 and 2018, and 40.3% over the study period. Banks with less than $500 million in assets, by contrast, increased their marketing budgets by half as much — only 5.0% over the same timeframe, and 21% over the study period.
The table below, organized by asset tiers, includes budget figures for all asset ranges included in the study, along with other measures of profitability and their correlation with marketing budgets.
Considering the Significance of Marketing Spending
Attempting to establish a definitive relationship of marketing spending to any measure of results ignores the fact that a bank is a machine of many moving parts. Brilliant marketing could be undermined by a local economic downturn. Successful marketing that produces strong loan growth that ought to produce strong net income could be negated by a major loan loss. But with care a marketing officer can make a case for ensuring that in today’s competitive environment no brand need face the battle with inadequate ammunition and support.
Key marketing measures by asset tier
| Over $10 Billion | $5 Billion up to $10 Billion | $1 Billion up to $5 Billion | $500 Million up to $1 Billion | Less than $500 Million | |
|---|---|---|---|---|---|
| Marketing as a % of Assets (2015) | 0.0678% | 0.0841% | 0.0742% | 0.0730% | 0.0736% |
| Marketing as a % of Assets (2018) | 0.0668% | 0.0772% | 0.0719% | 0.0730% | 0.0718% |
| Increase in Marketing Budgets (2015-2018) | 40.3% | 33.7% | 38.0% | 31.7% | 21.0% |
| Average Annual Increase in Marketing Budget | 10.6% | 9.1% | 8.8% | 6.9% | 5.0% |
| Profit Per $1 in Marketing Spent (2018) | $26.74 | $18.30 | $24.89 | $41.68 | $18.83 |
| Change in Profit Per $1 in Marketing Spent (2015-2018) | $7.93 | $0.03 | $4.98 | $12.49 | $1.55 |
| Asset Growth (2015-2018) | 38.1% | 37.4% | 30.0% | 26.4% | 18.8% |
| Increase in Net Income (2015-2018) | 97.0% | 90.7% | 73.3% | 60.8% | 66.3% |
| Profit Per $1 in Marketing Spent (2015) | $18.80 | $18.27 | $19.91 | $29.19 | $17.28 |
| ROA (2018) | 1.34 | 1.26 | 1.21 | 1.19 | 1.11 |
| Change in ROA (2015-2018) | 0.34 | -0.05 | 0.20 | 0.17 | 0.21 |
| ROE (2018) | 11.00 | 10.96 | 11.63 | 11.59 | 10.25 |
| Change in ROE (2015-2018) | 2.69 | 0.47 | 1.71 | 1.75 | 1.69 |
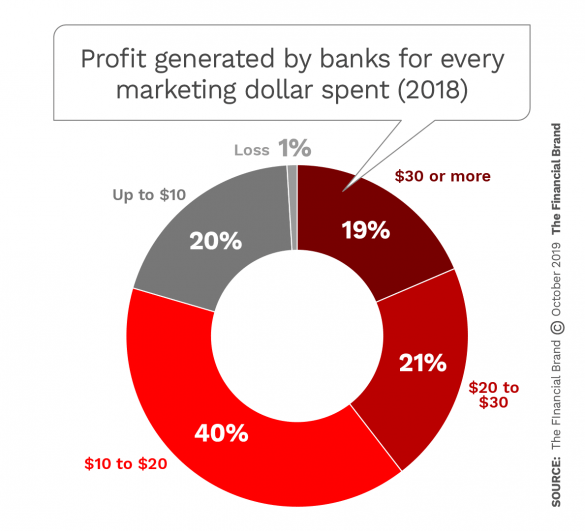
In 2018, banks generated, on average, $18.34 for every dollar spent on marketing, up from 2015’s average of $14.48. As a group, banks between $500 million and $1 billion averaged the highest profit per dollar spent on marketing, with the largest asset class, those over $10 billion, coming in behind that.
Looking at the above table based on asset tiers, it is notable that the three middle tiers, covering banks between $500 million and $10 billion, as a group spend more on marketing as a percentage of assets than the largest and smallest categories in the study sample.
Conceivably this reflects the urge to grow not only for growth’s own sake, but for strategic reasons. In recent years crossing the $1 billion mark and the $10 billion mark have become priorities for banks. This reflects a mixture of influences, including the quest for overall efficiency; the need to grow larger to support the costs of ongoing digitization; and overcoming the drag of compliance, often a fixed cost.
Mergers are another factor. Between 2015 and 2018 over 1,000 bank merger deals were done, according to S&P Global Market Intelligence. When one institution acquires another, it faces the risk of losing the customers that made that acquisition important. Marketing can help retain these people by reaching out to welcome them and assure them that the new management will work to meet their needs.
Concerning the smallest institutions in the study, which spent less as a percentage of assets than the next three largest asset tiers in 2018, one factor may be a matter of banking specialty. In many ways bank marketing is more retail- than business-banking oriented. This has been changing over time, but, especially for community banks, which tend to be business-focused, marketing remains a more personal matter. These institutions still press the flesh with business leaders who want to deal with a human and not a Kabbage.

REGISTER FOR THIS FREE WEBINAR
Gen Z is Here: 6 Tips to Drive Engagement with the Next Generation
Join EVERFI for a webinar exploring Gen Z financial attitudes and behaviors, as well as the six key tips for brands to engage with this growing consumer base.
TUESDAY, October 15tH at 2pm (ET)
Looking at Some of the Biggest Spenders
26 institutions out of the 210-bank study universe devoted 0.12% of assets or more to promoting their brand in 2015. In 2018, while this dropped to 17 banks, 11 of those banks appeared on both lists, suggesting a stronger-than-average commitment to investing in marketing. Among the 2018 top spenders, ten had ROAs above 1.0% and seven had ROEs of at least 15%.
(On the other hand, six of the 2018 leaders had ROEs below 10%. Among all banks in The Financial Brand study, both the average and median ROA were 1.21%. The average ROE was 11.24% and the median was 10.92%.)
Some interesting reasons for spending beyond average emerged among the institutions that were large spenders for 2018.
Take, for example, Axos Bank, which appeared on the 2018 ranking. The San Diego-based bank started in 2000 as Bank of Internet USA. It was one of the first internet-based financial institutions. Since then it has acquired several other institutions and its parent, Axos Financial, has moved into multiple financial businesses related to banking.
In 2018, Axos, which topped $10 billion in assets in 2019, devoted $16.3 million to marketing. This represented 0.17% of assets, versus the average of 0.068% of assets among all banks in the study. 2018 marked the year of its rebrand, in October, to the radically different Axos name and look. The new brand’s tagline is “Banking, Evolved.”

One of the highest percentages seen among the study sample both years was that of FirstBank, Nashville, Tenn., which spent over $13 million on marketing in 2018, amounting to 0.26% of assets, nearly four times the study average. It’s not hard to see the drift of what’s been going on for FirstBank. The institution has undergone three mergers since 2015 and went public in 2016, listing on the New York Stock Exchange. It has has branched into northern Georgia and northern Alabama and has mortgage operations throughout the Southeast.

Meridian Bank, headquartered in Paoli, Pa., near Philadelphia, branched into the historic city in 2017, pursuing its mix of retail and commercial. It devoted 0.24% of assets to marketing in 2018, almost twice the level that put it among leaders in the 2015 tally.

Bank of Springfield, Ill., which put 0.17% of assets into marketing in 2018, typifies a number of institutions identified in this year’s study that pay for naming rights on public venues, such as sports stadiums, multi-purpose public spaces, and even museum exhibitions.
Spending Amounts Aside, What Do You Get for It?
Some inferences about what percentage of assets should be devoted to marketing could be drawn from the data and examples given thus far. But they really only represent part of the picture. Ultimately, what you spend isn’t as important as what you get for what you spend.
We looked at this aspect of spending in several ways.The first is: Does spending on marketing effectively help increase the size of the bank?
In examining this question, The Financial Brand evaluated the correlation of spending on three factors: asset growth, loan growth and deposit growth. We found that the patterns for loan and deposit increases so closely follow those for asset growth that there was no need to go beyond the latter in this presentation.
One quarter of the banks in this study — 25.2% — increased assets by at least 40% over the three-year period reviewed. Of those 53 banks, 24 of them increased their marketing budget by an average of at least 15% year over year between 2015 and 2018.
Marketing spending among banks with most asset growth
| Bank | Assets in 2018 (in millions) | Asset Growth (2015-18) | Average YoY Increase in Marketing Budget (2015-18) | Marketing as a % of Assets (2018) |
|---|---|---|---|---|
| Commercial Bank of California | $986,712,000 | 200.4% | 75.3% | 0.07% |
| Northpointe Bank | $1,279,654,000 | 178.7% | 46.1% | 0.20% |
| Bank OZK | $22,388,030,000 | 126.8% | 55.2% | 0.05% |
| Prudential Bank | $1,115,161,000 | 113.6% | 21.1% | 0.02% |
| Sterling Bank and Trust | $3,198,235,000 | 87.0% | 28.9% | 0.05% |
| Summit Bank | $416,468,000 | 76.2% | 32.4% | 0.09% |
| Legacy Bank | $252,063,000 | 75.1% | 48.1% | 0.05% |
| Spirit of Texas Bank | $1,465,892,000 | 73.2% | 73.4% | 0.06% |
| Old National Bank | $19,633,838,000 | 65.7% | 20.4% | 0.06% |
| Merchants Bank of Indiana | $3,710,275,000 | 63.5% | 41.5% | 0.01% |
| Wintrust Bank | $5,889,864,000 | 61.7% | 18.3% | 0.05% |
| Horizon Bank | $990,721,000 | 59.1% | 21.6% | 0.20% |
| Entegra Bank | $1,635,609,000 | 58.7% | 19.2% | 0.06% |
| Empire National Bank | $988,203,000 | 57.1% | 28.9% | 0.07% |
| First Reliance Bank | $583,054,000 | 56.1% | 21.6% | 0.10% |
| California Bank of Commerce | $1,005,544,000 | 54.0% | 25.6% | 0.05% |
| Level One Bank | $1,413,654,000 | 53.1% | 18.6% | 0.07% |
| Meridian Bank | $997,388,000 | 50.4% | 37.4% | 0.24% |
| North American Banking Co. | $582,603,000 | 47.8% | 50.6% | 0.10% |
| Axos Bank | $9,796,674,000 | 47.2% | 36.0% | 0.17% |
Only four institutions identified as “big marketing spenders” appear in the table above. They are Northpointe Bank, Grand Rapids, Mich., which spent 0.20% of assets on marketing in 2018; Horizon Bank, Austin, Texas, which spent 0.20% as well; Meridian Bank, at 0.24%; and Axos Bank, at 0.17%.
Topping the table is Irvine, Calif.’s Commercial Bank of California which grew assets by a whopping 200% over the three-year study period. That rapid growth had been a deliberate goal for Ash Patel, President and CEO, as was the strategy to move away from being a traditional bank into a diversified financial services and technology company. While the bank’s marketing budget-to-assets ratio of 0.07% is about average for the group, it has increased marketing spend by 75% over the three-year study period, to a total of $733,000 in 2018.
Another major growth story is seen in Bank OZK, which acquired 15 other banks from 2010 to present, two of them in the study period. In 2018 the institution, based in Little Rock, Ark., changed its name from Bank of the Ozarks to Bank OZK. In 2015-2018 the institution grew 127% in assets while upping its marketing investment to 55.2%. In 2018 it had a marketing spend of over $10 million, spread over a ten-state banking organization.

Considering a Fresh Concept: ‘Marketing ROI’
It’s a basic of bank management that you can run a bank for growth or you can run a bank for profitability, but not both. We’ve discussed growth above. Now let’s look at the question of what a bank can expect for its “marketing return on investment.”
More than half — 55.7% — of the 210 banks studied allocated at least 0.07% of their assets to marketing. Of these 117 banks, 39 were able to generate at least $15 profit for every dollar spent on marketing. The table below lists the top 20 of that number, as ranked by profit per $1 spent. A handful almost doubled that $15 figure.
Top banks by profit per dollar of marketing spend
| Bank | Assets (in millions) | Marketing as a % of Assets | Profit Per $1 in Marketing Spent | ROA | ROE |
|---|---|---|---|---|---|
| Quantum National Bank | $489.8 | 0.07% | $36.92 | 2.79 | 24.87 |
| Citizens National Bank of Bluffton | $858.4 | 0.07% | $28.12 | 1.95 | 20.90 |
| Rock Canyon Bank | $416.3 | 0.07% | $26.66 | 1.89 | 18.52 |
| Rockland Trust Company | $8,850.5 | 0.07% | $21.18 | 1.49 | 11.90 |
| Benchmark Bank | $582.8 | 0.11% | $20.93 | 2.30 | 22.81 |
| Frandsen Bank & Trust | $1,706.9 | 0.07% | $20.89 | 1.51 | 12.91 |
| Texas Bank | $2,528.0 | 0.07% | $20.83 | 1.49 | 13.49 |
| Glacier Bank | $12,102.8 | 0.08% | $20.39 | 1.71 | 12.81 |
| American Bank Center | $1,426.0 | 0.07% | $20.18 | 1.44 | 16.61 |
| ANB Bank | $2,567.1 | 0.07% | $19.93 | 1.34 | 17.33 |
| Bank of Odessa | $249.8 | 0.07% | $19.58 | 1.42 | 6.85 |
| First Financial Bank | $2,923.8 | 0.08% | $19.52 | 1.51 | 11.08 |
| Carrollton Bank | $1,637.6 | 0.07% | $19.41 | 1.30 | 15.90 |
| The Moody National Bank | $1,000.2 | 0.08% | $19.35 | 1.49 | 10.43 |
| Bank of Utah | $1,422.6 | 0.09% | $18.87 | 1.81 | 14.93 |
| Focus Bank | $738.4 | 0.07% | $18.28 | 1.32 | 12.70 |
| Farmers & Merchants Bank | $778.6 | 0.07% | $17.82 | 1.19 | 10.11 |
| Hancock Whitney Bank | $28,215.4 | 0.07% | $17.77 | 1.21 | 11.25 |
| Alpine Bank | $3,706.4 | 0.09% | $17.68 | 1.59 | 17.36 |
| First Bank and Trust | $923.8 | 0.10% | $17.62 | 1.73 | 17.84 |
Who Gets the Biggest Bang for the Buck?
There’s another way to look at the potential return on marketing expenditures. Out of the 210 banks in this study, 73, or 34.8%, increased their budgets by an average of at least 20% during the study period. Among that group, 13 saw their net income increase by an average of at least 20% during this time, saw their ROA improve by at least 0.5 points, and saw their ROE improve by at least 3.0 points.
Correlation of marketing spend with return measures
Appearing elsewhere on The Financial Brand is a similar study of credit union marketing budgets.)