Biomaterials Market Overview:
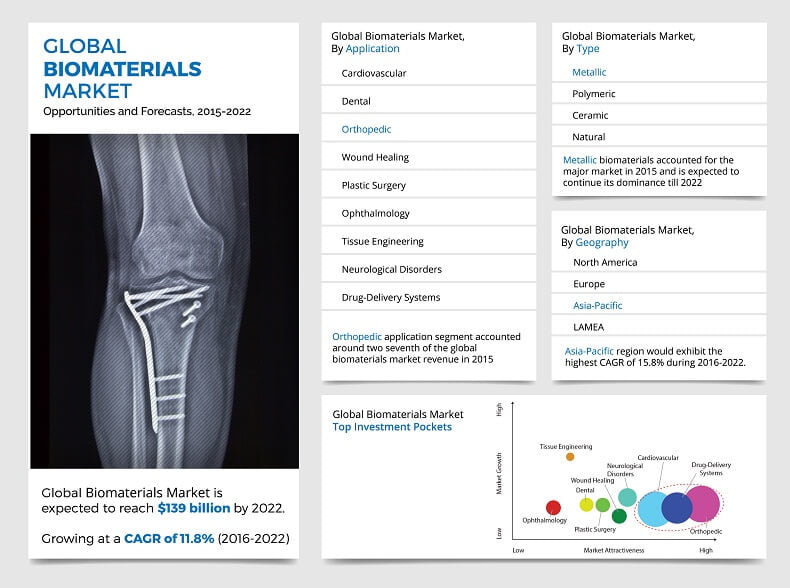
The global biomaterials market is estimated to reach $139 Billion by 2022, growing at a CAGR of 11.8% from 2016 to 2022. Metallic biomaterials segment is expected to contribute significantly to the global market revenue until 2022. North America held the leading position in the global market in 2015, and is expected to maintain its lead throughout the study period.
Biomaterials are artificially derived synthetic or natural materials that are used in medical technology to improve the functionality of damaged tissues and organs. These biomaterials are used to interact with biological systems for medical purposes and treatments of cardiovascular, dental, orthopedic, and neurological disorders. Moreover, biomaterials science can be implemented in various advanced medical technologies such, tissue engineering, plastic surgery, drug delivery devices, and other medical implants. Biomaterial applications are finding prominence in the research on biomed engineering, biomineralization, and biomolecules.
Increase in geriatric population, high prevalence of cardiovascular, neurological, & orthopedic disorders, and heavy funding by government organizations to launch new products, increase awareness regarding the advantages of biomaterials products, increase production of implantable products, and advancements in medical technology are the key drivers of the market. The growth of the market is hindered by factors, such as high cost of biomaterial production, occurrence of inflammatory responses due to compatibility issues, and complications associated with the use of these products.
The report analyzes the biomaterials industry based on type, namely, metallic, polymeric, ceramic, and natural types. Metallic biomaterials are further segmented into stainless steel, titanium & titanium alloys, cobalt-chrome alloys, gold, and silver type. Polymeric biomaterials are further divided into polymethyl methacrylate (PMMA), polyethylene, polyester, polyvinylchloride, silicone rubber, nylon, and polyetheretherketone. Ceramic biomaterials are further segmented into calcium phosphate, zirconia, aluminum oxide, calcium sulfate, carbon, and glass. Natural biomaterials include hyaluronic acid, collagen & gelatin, fibrin, cellulose, chitin, alginates, and silk. The market is segmented based on application into cardiovascular, dental, orthopedic, wound healing, plastic surgery, ophthalmology, tissue engineering, neurological disorders, and drug-delivery systems. The report includes the revenue generated through sales in these aforementioned segments of the market.
Metallic biomaterial segment presently dominates the global market, whereas polymeric biomaterial segment is projected to grow rapidly during the forecast period. Metallic biomaterials are widely used in orthopedic procedures for bone support and replacement, as they are strong and resistant to fatigue degradation. They are used in dental, cardiovascular, and cosmetic surgeries. Moreover, metals are used in neuromuscular stimulation devices due to their good electrical conductivity.
Orthopedic disorder is the largest application segment of the biomaterial market, owing to the increase in the number of orthopedic surgeries using implants. Biomaterials are used for developing orthopedic implants, which are used in various orthopedic procedures, such as orthobiologics, bioresorbable tissue fixation products, joint replacements, spine implants, visco-supplementation, and nonconventional modular tumor implants.
The global biomaterials market size is driven by factors including an increase in geriatric population who are susceptible to diseases, such as cardiovascular, dental, orthopedic, and neurological conditions. Biomaterials are extensively used in hip and knee replacement surgeries. The high demand for implantable devices has boosted the market growth. These implantable devices are widely used in chronic degenerative diseases, such as orthopedic ailments and cardiovascular disorders.
Technological advancement in medical technology, such as development of smart biomaterials and improving healthcare infrastructure fuel the market growth. Government and private initiatives have increased awareness regarding biomaterials application and increased incidence of neurological disorders; thereby, driving the market growth in the Asia-Pacific region. However, high cost associated with biomaterial production, abrasive wear of implantable products, and biocompatibility issues with the products hamper the market growth.
The report provides comprehensive analysis of the key players operating in the global biomaterials industry, which include Royal DSM, Wright Medical Technology, Inc., Corbion N.V., Zimmer Biomet Holdings, Inc., Bayer AG, Carpenter Technology Corporation, Technologies Ltd., Evonik Industries AG, BASF SE, Invibio Ltd., and Collagen Matrix. The report presents competitive study of the market by analyzing market shares and position of major players, recent strategic moves, and detailed profiles of these players.
Get more information on this report : Request Sample Pages
BIOMATERIALS MARKET KEY BENEFITS
- This report provides an extensive analysis of the current and emerging market trends and dynamics in the global biomaterials industry.
- In-depth analysis of the market is based on market estimations of key market segments for the period of 2014-2022.
- This study analyzes the competitive landscape and value chain to understand the competitive scenario across the geographies.
- The report provides region-wise and country-wise analysis of the biomaterials market share.
- The market scenario is comprehensively analyzed with respect to the type, and application.
BIOMATERIALS MARKET KEY SEGMENTS
By Types
- Metallic
- Stainless Steel
- Titanium & Titanium Alloys
- Cobalt-Chrome Alloys
- Gold
- Silver
- Polymeric
- Polymethylmethacrylate (PMMA
- Polyethylene
- Polyester
- Polyvinylchloride
- Silicone Rubber
- Nylon
- Polyetheretherketone
- Ceramic
- Calcium Phosphate
- Zirconia
- Aluminum Oxide
- Calcium Sulfate
- Carbon
- Glass
- Natural
- Hyaluronic Acid
- Collagen & Gelatin
- Fibrin
- Cellulose
- Chitin
- Alginates
- Silk
By Application
- Cardiovascular
- Dental
- Orthopedic
- Wound Healing
- Plastic Surgery
- Ophthalmology
- Tissue Engineering
- Neurological Disorders
- Drug-Delivery Systems
By Geography
- North America
- Europe
- Germany
- France
- United Kingdom
- Others
- Asia-Pacific
- Latin America, Middle East and Africa (LAMEA)
- Brazil
- Turkey
- Saudi Arabia
- Republic of South Africa
- Others
CHAPTER 1 INTRODUCTION
1.1 Report description
1.2 Key benefits
1.3 Key market segments
1.4 Research methodology
1.4.1 Secondary research
1.4.2 Primary research
1.4.3 Analyst tools and models
CHAPTER 2 EXECUTIVE SUMMARY
2.1 CXO Perspective
CHAPTER 3 MARKET OVERVIEW
3.1 Market definition and scope
3.2 Key findings
3.2.1 Top investment pockets
3.2.2 Top winning strategies
3.3 Porters five forces analysis
3.3.1 Bargaining power of suppliers
3.3.2 Bargaining power of buyers
3.3.3 Threat of new entrants
3.3.4 Threat of substitutes
3.3.5 Competitive rivalry
3.4 Market dynamics
3.4.1 Drivers
3.4.1.1 Rise in geriatric population
3.4.1.2 Rise in prevalence of cardiovascular and orthopedic disorders
3.4.1.3 Rising demand for implantable devices
3.4.1.4 Advancements in medical technology
3.4.1.5 Advantages of biomaterials products
3.4.1.6 Heavy funding by government agencies
3.4.2 Restraints
3.4.2.1 High cost of biomaterial production
3.4.2.2 Compatibility issues
3.4.2.3 Difficulty in wearing the products
3.4.3 Opportunities
3.4.3.1 Introduction of decellularized dermal matrixes for grafting and hydrogel scaffolding
3.4.3.2 Introduction of new products in plastic surgery, wound healing, and neurology sector
CHAPTER 4 WORLD BIOMATERIALS MARKET, BY TYPE, 2014-2022
4.1 Overview
4.1.1 Market size and forecast
4.2 Metallic
4.2.1 Key market trends
4.2.2 Key growth factors and opportunities
4.2.3 Market size and forecast
4.2.4 Stainless steel
4.2.6 Titanium & titanium alloys
4.2.8 Cobalt-chrome alloys
4.2.10 Gold
4.2.12 Silver
4.3 Polymeric
4.3.1 Key market trends
4.3.2 Key growth factors and opportunities
4.3.3 Market size and forecast
4.3.4 Polymethylmethacrylate (PMMA)
4.3.6 Polyethylene
4.3.8 Polyester
4.3.10 Polyvinylchloride
4.3.12 Silicone rubber
4.3.14 Nylon
4.3.16 Polyetheretherketone
4.4 Ceramic
4.4.1 Key market trends
4.4.2 Key growth factors and opportunities
4.4.3 Market size and forecast
4.4.4 Calcium phosphate
4.4.5 Calcium phosphate market size & forecast
4.4.6 Zirconia
4.4.8 Aluminum oxide
4.4.10 Calcium sulfate
4.4.12 Carbon
4.4.14 Glass
4.5 Natural
4.5.1 Key market trends
4.5.2 Key growth factors and opportunities
4.5.1 Market size and forecast
4.5.2 Hyaluronic acid
4.5.4 Collagen & gelatin
4.5.6 Fibrin
4.5.8 Cellulose
4.5.10 Chitin
4.5.12 Alginates
4.5.14 Silk
CHAPTER 5 WORLD BIOMATERIALS MARKET, BY APPLICATION, 2014-2022
5.1 Overview
5.1.1 Market size and forecast
5.2 Cardiovascular
5.2.1 Market size and forecast
5.3 Dental
5.3.1 Market size and forecast
5.4 Orthopedic
5.4.1 Market size and forecast
5.5 Wound healing
5.5.1 Market size and forecast
5.6 Plastic surgery
5.6.1 Market size and forecast
5.7 Ophthalmology
5.7.1 Market size and forecast
5.8 Tissue engineering
5.8.1 Market size and forecast
5.9 Neurological disorders
5.9.1 Market size and forecast
5.10 Drug delivery systems
5.10.1 Market size and forecast
CHAPTER 6 WORLD BIOMATERIALS MARKET, BY GEOGRAPHY, 2014-2022
6.1 Overview
6.1.1 Market size and forecast
6.1 North America
6.1.1 Key market trends
6.1.2 Key growth factors and opportunities
6.1.3 Market size and forecast
6.1.4 U.S. market size and forecast
6.1.5 Canada market size and forecast
6.1.6 Mexico market size and forecast
6.2 Europe
6.2.1 Key market trends
6.2.2 Key growth factors and opportunities
6.2.3 Market size and forecast
6.2.4 Germany market size and forecast
6.2.5 France market size and forecast
6.2.6 U.K. market size and forecast
6.2.7 Italy market size and forecast
6.2.8 Spain market size and forecast
6.2.9 Russia market size and forecast
6.2.10 Others market size and forecast
6.3 Asia-Pacific
6.3.1 Key market trends
6.3.2 Key growth factors and opportunities
6.3.3 Market size and forecast
6.3.4 Japan market size and forecast
6.3.5 China market size and forecast
6.3.6 Australia market size and forecast
6.3.7 India market size and forecast
6.3.8 South Korea market size and forecast
6.3.9 Taiwan market size and forecast
6.3.10 Others market size and forecast
6.4 LAMEA
6.4.1 Key market trends
6.4.2 Key growth factors and opportunities
6.4.3 Market size and forecast
6.4.4 Brazil market size and forecast
6.4.5 Turkey market size and forecast
6.4.6 Venezuela market size and forecast
6.4.7 Saudi Arabia market size and forecast
6.4.8 Republic of South Africa market size and forecast
6.4.9 Others market size and forecast
CHAPTER 7 COMPANY PROFILES
7.1 Royal DSM
7.1.1 Company overview
7.1.2 Operating business segments
7.1.3 Business performance
7.1.4 Key strategic moves & developments
7.2 Wright Medical Group N.V.
7.2.1 Company overview
7.2.2 Operating business segments
7.2.3 Business performance
7.2.4 Key strategic moves & developments
7.3 Corbion N.V.
7.3.1 Company overview
7.3.2 Operating business segments
7.3.3 Business performance
7.3.4 Key strategic moves & developments
7.4 Zimmer Biomet Holdings, Inc.
7.4.1 Company overview
7.4.2 Operating business segments
7.4.3 Business performance
7.4.4 Key strategic moves & developments
7.5 Bayer AG
7.5.1 Company overview
7.5.2 Operating business segments
7.5.3 Business performance
7.6 Carpenter Technology Corporation
7.6.1 Company overview
7.6.2 Operating business segments
7.6.3 Business performance
7.7 Covalon Technologies Ltd.
7.7.1 Company overview
7.7.2 Operating business segments
7.7.3 Business performance
7.8 Evonik Industries AG
7.8.1 Company overview
7.8.2 Operating business segments
7.8.3 Business performance
7.8.4 Key strategic moves & developments
7.9 BASF SE
7.9.1 Company overview
7.9.2 Operating business segments
7.9.3 Business performance
7.10 Victrex plc.
7.10.1 Company overview
7.10.2 Operating business segments
7.10.3 Business performance
7.10.4 Key strategic moves & developments
7.11 Collagen Matrix, Inc.
7.11.1 Company overview
7.11.2 Operating business segments
List of Figures
FIG. 1 TOP INVESTMENT POCKETS IN WORLD BIOMATERIALS MARKET
FIG. 2 TOP WINNING STRATEGIES: PERCENTAGE DISTRIBUTION (2014-2016)
FIG. 3 TOP WINNING STRATEGIES
FIG. 4 PORTERS FIVE FORCES ANALYSIS
FIG. 5 TOP IMPACTING FACTORS
FIG. 6 STAINLESS STEEL BIOMATERIALS MARKET, 2014-2022 ($MILLION)
FIG. 7 TITANIUM & TITANIUM ALLOYS BIOMATERIALS MARKET, 2014-2022 ($MILLION)
FIG. 8 COBALT-CHROME ALLOYS BIOMATERIALS MARKET, 2014-2022 ($MILLION)
FIG. 9 GOLD BIOMATERIALS MARKET, 2014-2022 ($MILLION)
FIG. 10 SILVER BIOMATERIALS MARKET, 2014-2022 ($MILLION)
FIG. 11 POLYMETHYLMETHACRYLATE BIOMATERIALS MARKET, 2014-2022 ($MILLION)
FIG. 12 POLYETHYLENE BIOMATERIALS MARKET, 2014-2022 ($MILLION)
FIG. 13 POLYESTER BIOMATERIALS MARKET, 2014-2022 ($MILLION)
FIG. 14 POLYVINYLCHLORIDE BIOMATERIALS MARKET, 2014-2022 ($MILLION)
FIG. 15 SILICONE RUBBER BIOMATERIALS MARKET, 2014-2022 ($MILLION)
FIG. 16 NYLON BIOMATERIALS MARKET, 2014-2022 ($MILLION)
FIG. 17 POLYETHERETHERKETONE BIOMATERIALS MARKET, 2014-2022 ($MILLION)
FIG. 18 CALCIUM PHOSPHATE BIOMATERIALS MARKET, 2014-2022 ($MILLION)
FIG. 19 ZIRCONIA BIOMATERIALS MARKET, 2014-2022 ($MILLION)
FIG. 20 ALUMINUM OXIDE BIOMATERIALS MARKET, 2014-2022 ($MILLION)
FIG. 21 CALCIUM SULFATE BIOMATERIALS MARKET, 2014-2022 ($MILLION)
FIG. 22 CARBON BIOMATERIALS MARKET, 2014-2022 ($MILLION)
FIG. 23 GLASS BIOMATERIALS MARKET, 2014-2022 ($MILLION)
FIG. 24 HYALURONIC ACID BIOMATERIALS MARKET, 2014-2022 ($MILLION)
FIG. 25 COLLAGEN & GELATIN BIOMATERIALS MARKET, 2014-2022 ($MILLION)
FIG. 26 FIBRIN BIOMATERIALS MARKET, 2014-2022 ($MILLION)
FIG. 27 CELLULOSE BIOMATERIALS MARKET, 2014-2022 ($MILLION)
FIG. 28 CHITIN BIOMATERIALS MARKET, 2014-2022 ($MILLION)
FIG. 29 ALGINATES BIOMATERIALS MARKET, 2014-2022 ($MILLION)
FIG. 30 SILK BIOMATERIALS MARKET, 2014-2022 ($MILLION)
FIG. 31 U.S. BIOMATERIALS MARKET, 2014-2022 ($MILLION)
FIG. 32 CANADA BIOMATERIALS MARKET, 2014-2022 ($MILLION)
FIG. 33 MEXCIO BIOMATERIALS MARKET, 2014-2022 ($MILLION)
FIG. 34 GERMANY BIOMATERIALS MARKET, 2014-2022 ($MILLION)
FIG. 35 FRANCE BIOMATERIALS MARKET, 2014-2022 ($MILLION)
FIG. 36 U.K. BIOMATERIALS MARKET, 2014-2022 ($MILLION)
FIG. 37 ITALY BIOMATERIALS MARKET, 2014-2022 ($MILLION)
FIG. 38 SPAIN BIOMATERIALS MARKET, 2014-2022 ($MILLION)
FIG. 39 RUSSIA BIOMATERIALS MARKET, 2014-2022 ($MILLION)
FIG. 40 OTHERS BIOMATERIALS MARKET, 2014-2022 ($MILLION)
FIG. 41 JAPAN BIOMATERIALS MARKET, 2014-2022 ($MILLION)
FIG. 42 CHINA BIOMATERIALS MARKET, 2014-2022 ($MILLION)
FIG. 43 AUSTRALIA BIOMATERIALS MARKET, 2014-2022 ($MILLION)
FIG. 44 INDIA BIOMATERIALS MARKET, 2014-2022 ($MILLION)
FIG. 45 SOUTH KOREA BIOMATERIALS MARKET, 2014-2022 ($MILLION)
FIG. 46 TAIWAN BIOMATERIALS MARKET, 2014-2022 ($MILLION)
FIG. 47 OTHERS BIOMATERIALS MARKET, 2014-2022 ($MILLION)
FIG. 48 BRAZIL BIOMATERIALS MARKET, 2014-2022 ($MILLION)
FIG. 49 TURKEY BIOMATERIALS MARKET, 2014-2022 ($MILLION)
FIG. 50 VENEZUELA BIOMATERIALS MARKET, 2014-2022 ($MILLION)
FIG. 51 SAUDI ARABIA BIOMATERIALS MARKET, 2014-2022 ($MILLION)
FIG. 52 REPUBLIC OF SOUTH AFRICA BIOMATERIALS MARKET, 2014-2022 ($MILLION)
FIG. 53 OTHERS BIOMATERIALS MARKET, 2014-2022 ($MILLION)
FIG. 54 ROYAL DSM: REVENUE BY YEAR ($MILLION)
FIG. 55 ROYAL DSM: REVENUE BY SEGMENT, 2015 (%)
FIG. 56 ROYAL DSM: REVENUE BY GEOGRAPHY, 2015 (%)
FIG. 57 WRIGHT MEDICAL: REVENUE BY YEAR ($MILLION)
FIG. 58 WRIGHT MEDICAL: REVENUE BY SEGMENT, 2015 (%)
FIG. 59 WRIGHT MEDICAL: REVENUE BY GEOGRAPHY, 2015 (%)
FIG. 60 CORBION N.V.: REVENUE BY YEAR ($MILLION)
FIG. 61 CORBION N.V.: REVENUE BY SEGMENT, 2015 (%)
FIG. 62 CORBION N.V.: REVENUE BY GEOGRAPHY, 2015 (%)
FIG. 63 ZIMMER BIOMET: REVENUE BY YEAR ($MILLION)
FIG. 64 ZIMMER BIOMET: REVENUE BY SEGMENT, 2015 (%)
FIG. 65 ZIMMER BIOMET: REVENUE BY GEOGRAPHY, 2015 (%)
FIG. 66 BAYER: REVENUE BY YEAR ($MILLION)
FIG. 67 BAYER: REVENUE BY SEGMENT, 2015 (%)
FIG. 68 BAYER: REVENUE BY GEOGRAPHY, 2015 (%)
FIG. 69 CARPENTER: REVENEU BY YEAR ($MILLION)
FIG. 70 CARPENTER: REVENUE BY SEGMENT, 2015 (%)
FIG. 71 CARPENTER: REVENUE BY MARKET, 2015 (%)
FIG. 72 CARPENTER: REVENUE BY GEOGRAPHY, 2015 (%)
FIG. 73 COVALON: REVENUE BY YEAR ($MILLION)
FIG. 74 EVONIK: REVENUE BY YEAR ($MILLION)
FIG. 75 EVONIK: REVENUE BY SEGMENT, 2015 (%)
FIG. 76 EVONIK: REVENUE BY GEOGRAPHY, 2015 (%)
FIG. 77 BASF SE: REVENUE BY YEAR ($MILLION)
FIG. 78 BASF SE: REVENUE BY SEGMENT, 2015 (%)
FIG. 79 BASF SE: REVENUE BY GEOGRAPHY, 2015 (%)
FIG. 80 VICTREX: REVENUE BY YEAR ($MILLION)
FIG. 81 VICTREX: REVENUE BY SEGMENT, 2015 (%)
FIG. 82 VICTREX: REVENUE BY GEOGRAPHY, 2015 (%)
List of Tables
TABLE 1 WORLD BIOMATERIALS MARKET, BY TYPE, 2014-2022 ($MILLION)
TABLE 2 WORLD METALLIC BIOMATERIALS MARKET, BY TYPE, 2014-2022 ($MILLION)
TABLE 3 WORLD POLYMERIC BIOMATERIALS MARKET, BY TYPE, 2014-2022 ($MILLION)
TABLE 4 WORLD CERAMICS BIOMATERIALS MARKET, BY TYPE, 2014-2022 ($MILLION)
TABLE 5 WORLD NATURAL BIOMATERIALS MARKET, BY TYPE, 2014-2022 ($MILLION)
TABLE 6 WORLD BIOMATERIALS MARKET, BY APPLICATION, 2014-2022 ($MILLION)
TABLE 7 WORLD CARDIOVASCULAR BIOMATERIALS MARKET, BY REGION, 2014-2022 ($MILLION)
TABLE 8 WORLD DENTAL BIOMATERIALS MARKET, BY REGION, 2014-2022 ($MILLION)
TABLE 9 WORLD ORTHOPEDIC BIOMATERIALS MARKET, BY REGION, 2014-2022 ($MILLION)
TABLE 10 WORLD WOUND HEALING BIOMATERIALS MARKET, BY REGION, 2014-2022 ($MILLION)
TABLE 11 WORLD PLASTIC SURGERY BIOMATERIALS MARKET, BY REGION, 2014-2022 ($MILLION)
TABLE 12 WORLD OPHTHALMOLOGY BIOMATERIALS MARKET, BY REGION, 2014-2022 ($MILLION)
TABLE 13 WORLD TISSUE ENGINEERING BIOMATERIALS MARKET, BY REGION, 2014-2022 ($MILLION)
TABLE 14 WORLD NEUROLOGICAL DISORDERS BIOMATERIALS MARKET, BY REGION, 2014-2022 ($MILLION)
TABLE 15 WORLD DRUG DELIVERY SYSTEMS BIOMATERIALS MARKET, BY REGION, 2014-2022 ($MILLION)
TABLE 16 WORLD BIOMATERIALS MARKET, BY REGION, 2014-2022 ($MILLION)
TABLE 17 NORTH AMERICA BIOMATERIALS MARKET, BY COUNTRY, 2014-2022 ($MILLION)
TABLE 18 NORTH AMERICA BIOMATERIALS MARKET, BY TYPE, 2014-2022 ($MILLION)
TABLE 19 NORTH AMERICA BIOMATERIALS MARKET, BY APPLICATION, 2014-2022 ($MILLION)
TABLE 20 EUROPE BIOMATERIALS MARKET, BY COUNTRY, 2014-2022 ($MILLION)
TABLE 21 EUROPE BIOMATERIALS MARKET, BY TYPE, 2014-2022 ($MILLION)
TABLE 22 EUROPE BIOMATERIALS MARKET, BY APPLICATION, 2014-2022 ($MILLION)
TABLE 23 ASIA-PACIFIC BIOMATERIALS MARKET, BY COUNTRY, 2014-2022 ($MILLION)
TABLE 24 ASIA-PACIFIC BIOMATERIALS MARKET, BY TYPE, 2014-2022 ($MILLION)
TABLE 25 ASIA-PACIFIC BIOMATERIALS MARKET, BY APPLICATION, 2014-2022 ($MILLION)
TABLE 26 LAMEA BIOMATERIALS MARKET, BY COUNTRY, 2014-2022 ($MILLION)
TABLE 27 LAMEA BIOMATERIALS MARKET, BY TYPE, 2014-2022 ($MILLION)
TABLE 28 LAMEA BIOMATERIALS MARKET, BY APPLICATION, 2014-2022 ($MILLION)
TABLE 29 ROYAL DSM – COMPANY SNAPSHOT
TABLE 30 ROYAL DSM – SEGMENT INFORMATION
TABLE 31 WRIGHT MEDICAL – COMPANY SNAPSHOT
TABLE 32 WRIGHT MEDICAL – OPERATING SEGMENTS
TABLE 33 CORBION N.V. – COMPANY SNAPSHOT
TABLE 34 CORBION N.V. – BUSINESS SEGMENT
TABLE 35 ZIMMER BIOMET – COMPANY SNAPSHOT
TABLE 36 ZIMMER BIOMET – OPERATING SEGMENTS
TABLE 37 BAYER – COMPANY SNAPSHOT
TABLE 38 BAYER – OPERATING SEGMENTS
TABLE 39 CARPENTER – COMPANY SNAPSHOT
TABLE 40 CARPENTER – OPERATING SEGMENTS
TABLE 41 COVALON – COMPANY SNAPSHOT
TABLE 42 COVALON – BUSINESS SEGMENTS
TABLE 43 EVONIK – COMPANY SNAPSHOT
TABLE 44 EVONIK – BUSINESS SEGMENT
TABLE 45 BASF SE – COMPANY SNAPSHOT
TABLE 46 BASF SE – OPERATING SEGMENTS
TABLE 47 VICTREX – COMPANY SNAPSHOT
TABLE 48 VICTREX – OPERATING SEGMENTS
TABLE 49 COLLAGEN MATRIX – COMPANY SNAPSHOT
TABLE 50 COLLAGEN MATRIX – OPERATING SEGMENTS