Conversion Probability is a new report within Google Analytics. This new Beta report allows you to view your data with the ability to see how probable your users are to convert. Values range from 1-100 which are calculated for each user and values closer to 1 being less likely to convert and values closer to 100 being more likely to convert.
This report will allow you to see which conversion paths are more effective as well as see where you may be able to deliver a better targeted ad in order to effectively convert your users.
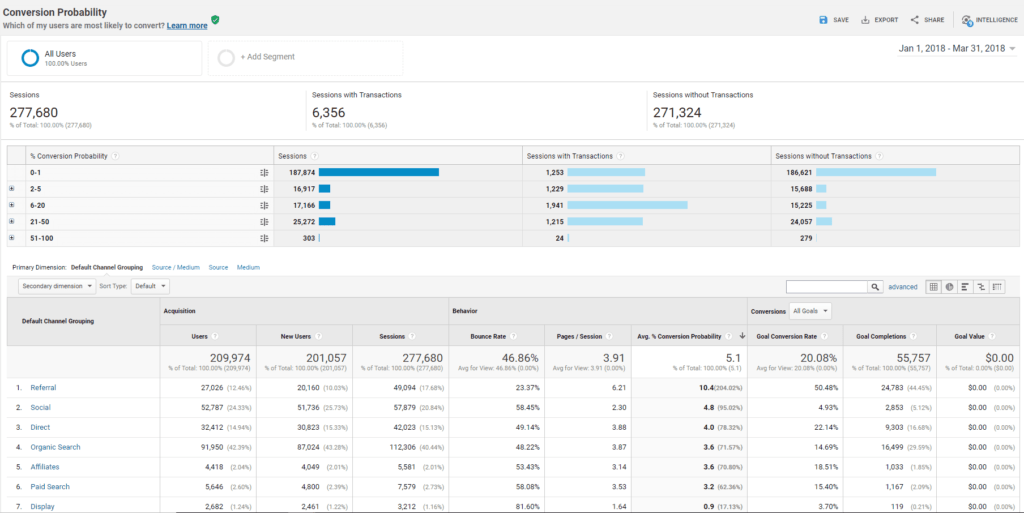
The Conversion Probability Report also ties in your user sessions with and without transactions so you can determine which users have a strong likelihood to convert and what that number looks like when compared to your overall user base.
This report does however require a few prerequisites in order to calculate this data.
You will need Ecommerce tracking implemented on your website and a minimum of 1000 Ecommerce transactions per month. Once you have reached the 1000 transaction threshold, Analytics then will need 30 days of data to model.
If you have Ecommerce Tracking on your website you can view these reports under Audience > Behavior > Conversion Probability. Please note that this is a Beta Report and not yet 100% rolled out.