The coronavirus pandemic is still gripping communities worldwide. The first release of our multinational study into 13 global markets proved to what scale it’s impacting the consumer landscape.
The second wave of this study, fielded in 17 markets between March 31 – April 2 shows us how that picture is evolving.
Analyzing the impact across Australia, Brazil, Canada, China, France, Germany, India, Ireland, Italy, Japan, New Zealand, Philippines, South Africa, Singapore, Spain, UK and the U.S., this study explores how concern is growing for most, behaviors are changing, and attitudes towards advertising are twofold.
As with all of our dedicated research on this topic, the data and reports are free and ungated for everyone to access. Here we’ve summarized eight crucial insights from the research. You can download the full report for more detail or analyze the data for yourself in our platform.
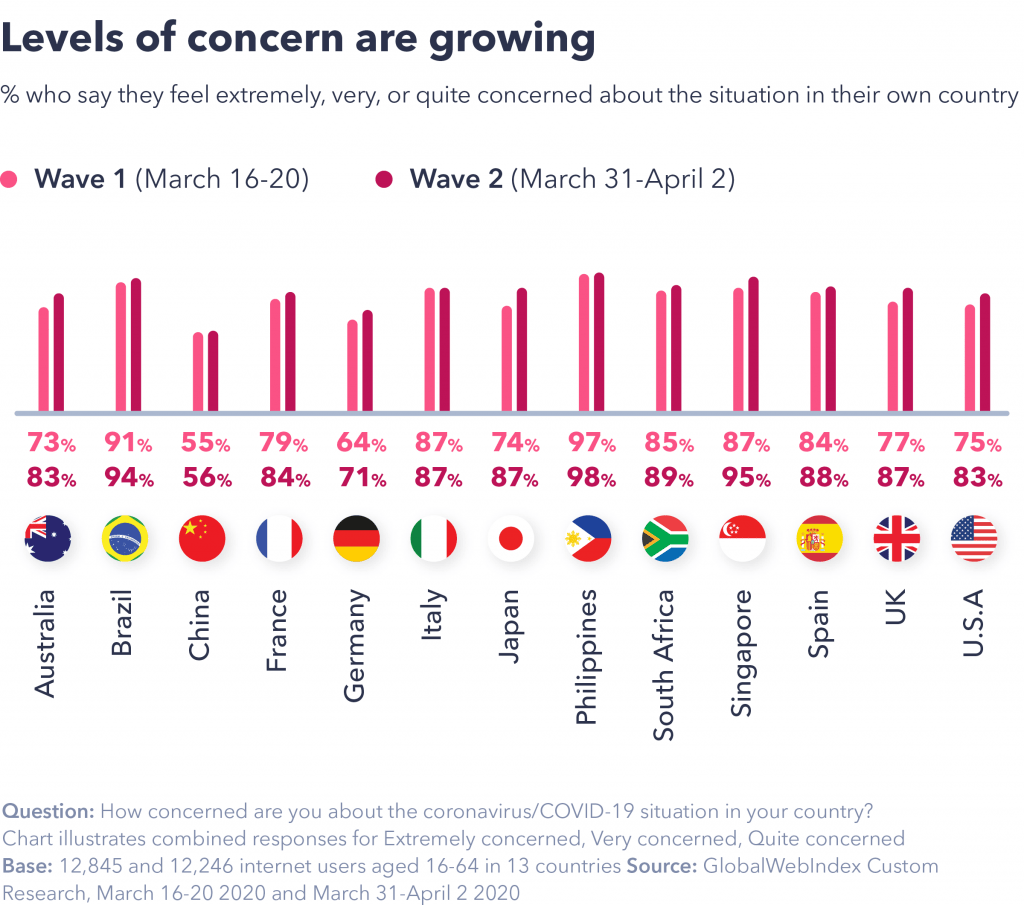
1. Levels of concern are rising – except for in China.
Levels of concern about coronavirus in one’s own country continue to increase.
In 10 of the 13 markets where this data can be trended, concern has risen materially since the middle of March.
This is especially true in Australia, the UK and the U.S., all of which were only in, or approaching, the initial stages of “lockdown” during the first wave of research.
Japan has also seen a notable shift, as it has for several other questions tracked in this study; in this country, the postponement of the Olympics as well as more vocal criticism of how Prime Minister Shinzō Abe has responded to the crisis appear to have exerted a strong impact on sentiment among Japanese consumers.
The only countries to buck this trend are China, the Philippines and Italy; all three have remained stable, but Italy and the Philippines had already registered high figures in the first wave.
China therefore remains the outlier, recording by far the lowest figure of any market tracked: over 50% still remain concerned, but this reflects a constant theme we’re seeing by which Chinese consumers believe the situation to be better in their country than the global one. This is particularly evident if we look at those who say they’re “extremely” or “very” concerned about the situation in their country:
Only around 3 in 10 in China say this, compared to around 90% in places like India and the Philippines.
Concern about the global situation (as opposed to one’s own country) is on the rise too: almost all countries surveyed in both waves have seen an increase in the past two weeks. China follows the trend here and records figures more in line with other markets. The biggest increases were recorded in Australia, France, Germany, Japan, and the UK.
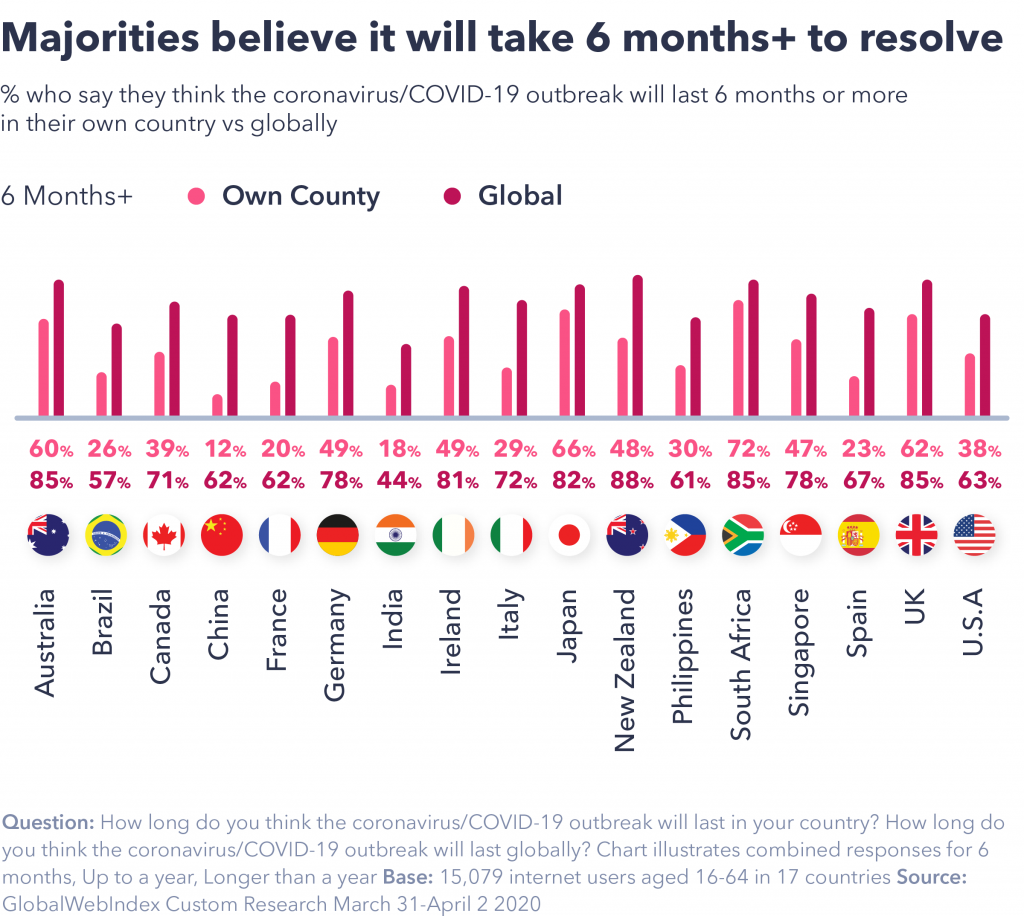
2. Most consumers expect the global situation to go on longer than the national one.
In every one of the 17 countries surveyed, people expect the global situation to take longer to solve than the one in their own country – indicating that people place more hope in their national systems than in the global response. It also reflects a tendency in situations like these for people to think their own situation will be better than the general one.
If we look at those selecting 6 months+ for their own country versus 6 months+ for the global situation, the latter is more than 20 points ahead in almost every place (Japan and Singapore being the only exceptions, both having been some of the most pessimistic about their own national situations).
The gap is typically largest in countries that encountered serious problems the earliest, such as China, France, Spain, and Italy.
Here, there’s a sentiment that they’re over the worst and that other countries will now follow suit.
India is more optimistic – only about a fifth expect their national situation to take more than six months to resolve. It’s also the only country surveyed where fewer than 50% expect the global situation to require six months or more.
Compared to the middle of March, a higher proportion of consumers in 11 of the 13 markets surveyed in both waves now expect the situation in their own country to take six months or longer to resolve (Brazil and South Africa being the only two to see no real change).
China remains the most optimistic of all, with less than 15% thinking this (but it’s a figure which has increased since mid-March). France, India and Spain are also at the more hopeful end of the scale, with around a fifth to a quarter expecting this timeframe.
Among the most pessimistic are Australia, Japan and the UK, where close to two-thirds are anticipating a 6 month+ period. All three countries have recorded increases since the first wave of research, but particularly in Japan where the postponement of the Olympics appears to have dented the consumer psyche very considerably.
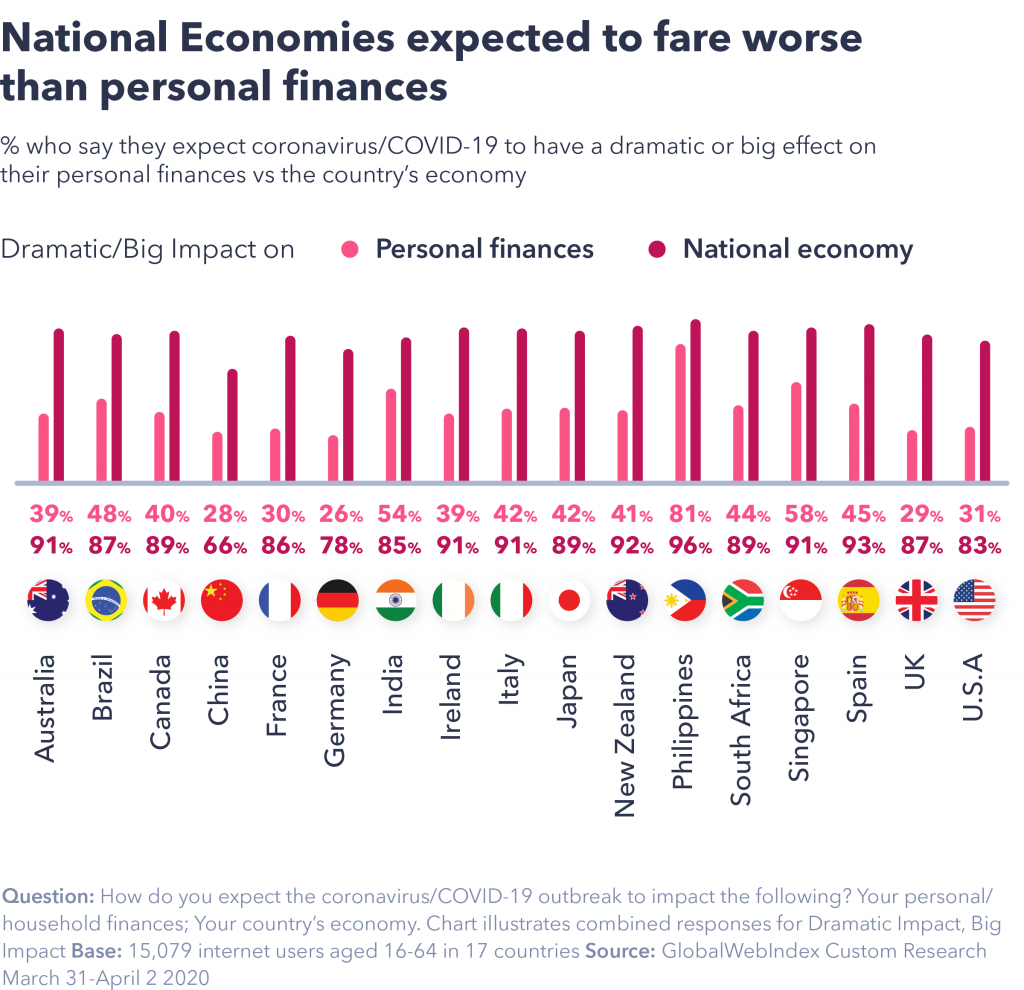
3. Concerns about the financial impact are growing.
Since our first wave of research in mid-March, 7 of the 13 markets tracked in both studies have seen a notable increase in consumers expecting the situation to have a big or dramatic impact on their personal finances. These are Australia, Brazil, Germany, Japan, Philippines, Singapore, and South Africa.
In the other 5 markets, sentiment has remained unchanged. Overall, though, it’s still less than 50% in almost all 17 countries tracked in wave two who expect a big or dramatic impact on their personal finances, only moving to a majority in India, the Philippines, and South Africa.
In stark contrast, large majorities in all countries now expect this to have a big or dramatic impact on the country’s economy; only in China does this fall below 70%.
The figure for the country’s economy exceeds 90% in Australia, Ireland, Italy, New Zealand, Philippines, South Africa, and Spain. We’ve also seen concerns grow in many countries here since our first wave of research – figures are up notably Australia, Germany, Singapore, and the UK.
Currently, the biggest gaps in terms of the expected impact on personal vs national finances are found in Australia, France, Germany, Ireland, New Zealand, the UK and the U.S. – all of them record at least a 50-point difference. In the UK, this hits a 58-point difference.
By generation, 35% of baby boomers expect it to have a big / dramatic impact on their personal finances, while 83% think it will have a big / dramatic impact on their country’s economy. The higher income group (45-point gap) are ahead of the lower income group (38-point gap).
The expected impact on the global economy is where consumers become most pessimistic. It’s 80% or more in all markets who anticipate a big or dramatic impact.
As we’ve seen elsewhere in this research, these results reflect a tendency from consumers to expect a better situation for themselves vs everyone else; effectively, it’s a protectionist or preservation mindset kicking in for the individual, showing that support is likely to be needed as the true impacts on personal finances begin to emerge more clearly.
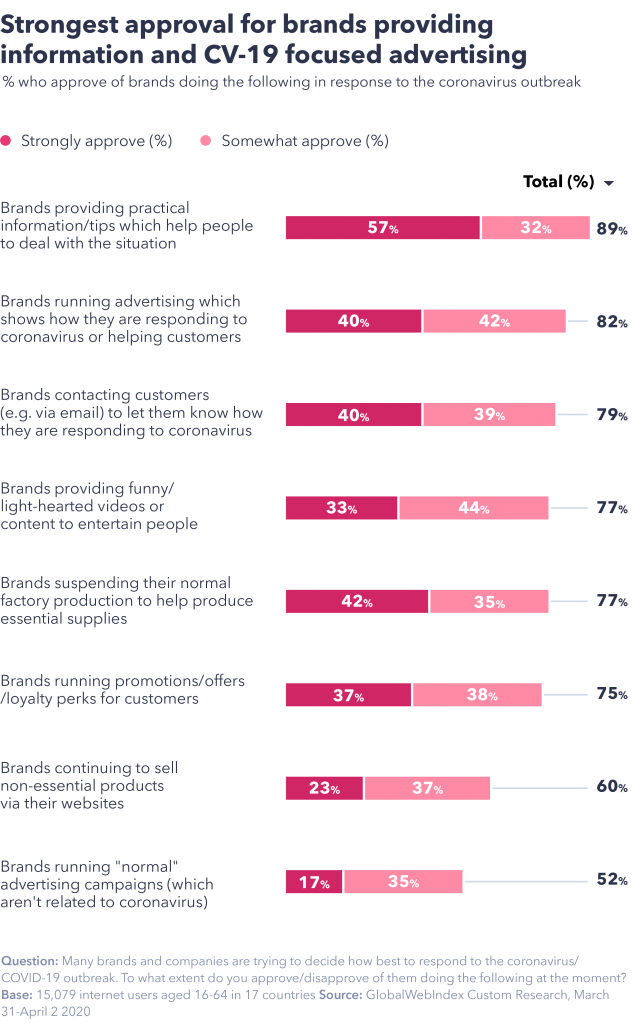
4. 7 in 10 approve of advertising linked to the crisis.
Globally, about 50% say they approve of brands running “normal” advertising campaigns which aren’t linked to coronavirus; only around 20% express disapproval, with the rest being neutral.
Of the eight brand roles / reactions we asked about, “normal” advertising is the only one to see disapproval ratings climb towards 20%.
Similarly, we see higher approval ratings for brands running campaigns which show how they are responding to coronavirus / helping customers, as well as for contacting customers to let them know how they are responding (both at around 80%).
Country variation is notable here; consumers express the highest approval for “normal” advertising in Brazil, India, and Italy (60%+, compared to 40-50% in most other places). The highest disapproval is found in New Zealand and South Africa, at around 25%.
There’s little difference by income or gender. Age has a more tangible impact; whereas around 60% of Gen Z approve, that figure dips to 40% among boomers.
The highest approval ratings of all come for brands providing practical information / tips which help people to deal with the situation – close to 90% support this.
Conversely, the lowest scores are seen for “normal” advertising (52%) and brands continuing to sell non-essential products online (60%). It’s still majorities who support these two activities, but it’s an indicator that any “business as normal” activities need to be managed very carefully.
5. 3 in 4 are keeping fit during the outbreak.
Globally, around 85% of consumers report undertaking some form of exercise / keep-fit activity during the pandemic (including going for walks).
Home workouts are by far the most popular (51%), followed by walks (33%).
Minorities of around 2 in 10 are running or taking part in live-streamed classes/sessions; about 1 in 10 are cycling or dancing.
As might be expected, there are strong age-related patterns at play here. Boomers are most likely to be taking walks, Gen Z lead for cycling and dancing, while millennials are ahead for running. Around a quarter of both the youngest generations say they are live-streaming. Boomers are the most likely to report not doing any activity (around 1 in 4 of this generation report such a status).
By gender, there’s a clear distinction globally: men are slightly more likely to be doing out-of-home activities or those which require equipment, whereas women move a little ahead for some of the in-home ones which don’t require equipment (especially pronounced for dancing, but also present for live streaming).
Income exerts a role too – higher income groups are ahead for many activities, whereas the lowest income group are most likely to say they’re doing no physical activities.
At country level, some of the notable peaks are for cycling in Germany, for running in China, Germany and Singapore, and for walks in most of the more developed countries with their older comparative populations (Australia, Canada, Germany, Ireland, New Zealand, UK and U.S.). The countries most likely to report no exercise at all are Italy and Japan.
Pre-pandemic exercise behaviors are key to the trends we are seeing here. Just 3% of those who didn’t go running before the outbreak report that they are doing so now (compared to about a quarter of those who went running at least once a week).
Similarly, those who reported in our Core data that they normally go running regularly are 10-points ahead of occasional runners for using home exercise equipment and over 20-points ahead of those who say they never went running.
In a similar vein, those who reported an interest in health & fitness or playing sport are more likely to be undertaking almost all of the physical activities tracked here compared to those who reported an interest in watching sport.
The only exception to this is going for walks. In other words, while a majority are trying to undertake physical activity during the outbreak, it’s those who were already active who are doing this the most.
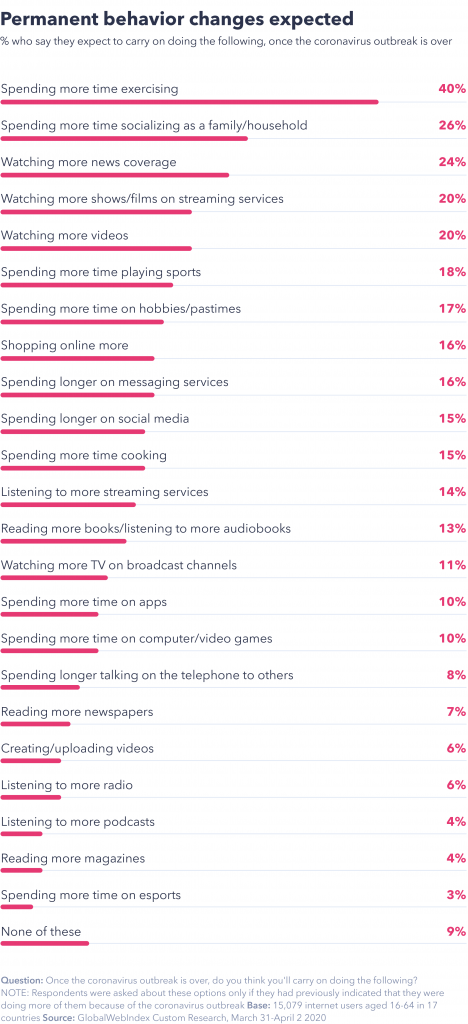
6. Most consumers expect to spend more time exercising in future.
Once the coronavirus outbreak is over, consumers most expect to continue spending more time exercising.
40% globally plan to do this, and in all of the 17 countries surveyed it’s the top option chosen out of 20+ possibilities.
Of course, it’s hard to know the extent to which these plans and expectations will convert to reality, but this is a clear sign that consumers have appetite to stay healthier and are likely to respond to support and initiatives designed to facilitate this.
Beyond exercise, there are plenty of other opportunities for brands to respond to consumer intentions. At least 20% say they plan to watch more news coverage, watch more streaming services, watch more videos, or spend more time socializing together as a family.
Gen Z typically record some of the highest figures for the activities they plan to continue; around 25% plan to spend more time on music streaming, watching videos and on TV streaming services such as Netflix, for example. Nevertheless, Gen X and boomers are some of the most likely to predict that they will listen to more radio and watch more broadcast TV.
The highest income group and millennials are the most likely to say they plan to shop online more in the future (20%).
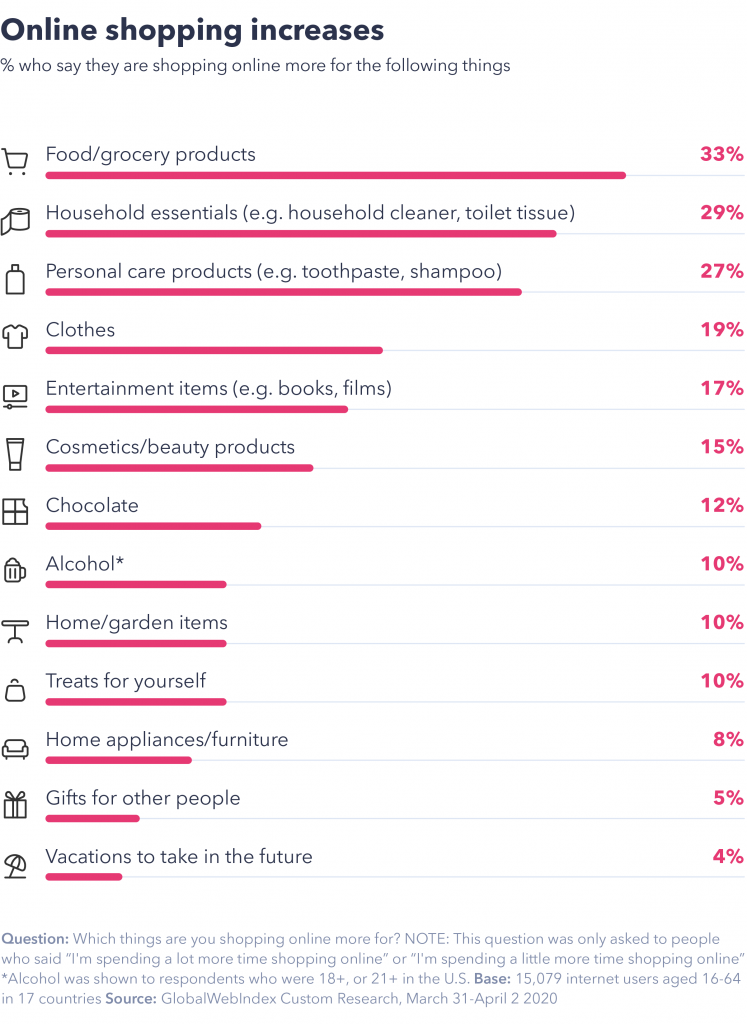
7. Almost 1 in 2 are doing more online shopping.
Across the 17 markets surveyed, almost half report that they are doing more online shopping.
China is at the forefront of increased online shopping; around two thirds report doing this a lot or a little more, perhaps in part because consumers there consider the worst to be over, and yet normal bricks-and-mortar infrastructure has not yet reverted to normal status in all parts of the country.
Conversely, respondents in the Philippines are most likely to report a decrease in online shopping; around 1 in 3 there say they are doing it a lot or a little less.
Generations follow a predictable pattern; Gen Z and millennials are most likely to report an increase, whereas Boomers are most likely to say their habits haven’t changed. Similarly, when we look at income it’s the higher group which reports the biggest increase (1 in 3 from the top 25% are shopping online more, compared to 1 in 5 in the lower 25%).
Among those who report that their online shopping has increased, there’s a clear focus on essentials: food/grocery products, household essentials and personal care products are at the top of the list.
Nevertheless, as fashion retailers consider how to weather the storm, there will be some positivity from almost 2 in 10 online consumers saying that they are shopping more for clothing. This is linked strongly to age, with the figure approaching 25% among Gen Z and Millennials (before dipping to 9% among Boomers).
That said, among those who report a decrease in their online shopping it is clothing which has suffered most; 8% report a decrease here, led by Gen Z. It’s therefore a polarized picture; within existing customers bases, some groups will be searching more intensively but others will have seen decreased activity.
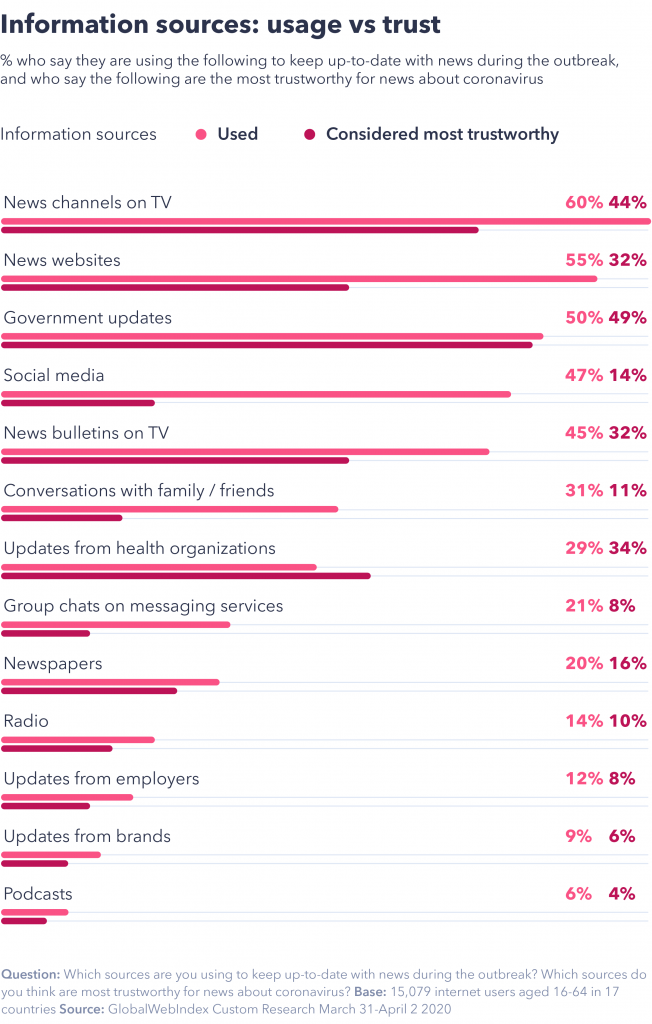
8. News channels and government updates are the most trusted sources of information, with social media lagging behind.
Globally, people are most likely to be turning to news channels (60%), news websites (55%), news bulletins (45%), government updates (50%) and social media (47%) to keep informed about the outbreak. Around a third are keeping up-to-date via conversations with friends / family or updates from health organizations.
When we ask people which sources they consider to be most trustworthy, the list looks quite different. Government updates move to the top of the list (around 50%), with no real difference between the number of people using them and the number who say they are trustworthy. Following behind are news channels and then updates from health organizations.
Social media has the biggest “trust gap” of any source – while 47% are keeping-to-date via this channel, only 14% believe it to be one of the most trustworthy sources. Users of individual platforms are in line with these figures.
In part, the question of trust gives context for what people say they want from social media: around two thirds say platforms should be providing fact-checked content, with a similar proportion wanting them to filter “fake news”.