Happy new year to you all!
First: Apologies to all that it took so long to finally kick off this new series which I promised some time ago…
But here it finally ist. As for my other guides you can find the whole thing on my blog as well including some more screenshots and images which might make it easier to follow. But the content is the same as I’ll post here. All free and no strings attached :).
Overall the series will have 4 lessons (including this intro lesson), which I’ll all link here. So let’s get started!
—————————————————————–
You probably know this feeling of drowning in customer data: You have the whole transaction history for each of your customers. You know when they bought, how much they bought and the last time they bought something. And there is this feeling that you should be able to use that data, e.g. to increase sales, brand awareness or customer growth.
That’s why you spend a lot of (maybe too much?) time playing around with the data… but it just seems to be impossible to gain any meaningful learnings from it. It’s frustrating – you struggle to make any sense of the data: Namely gaining insights and translating them into actionable tasks for marketing and the business.
That’s where the RFM analysis comes into play. It’s a simple to understand and easy to apply data analysis model to segment your customers. The following is a step-by step tutorial on how to create such a model in Google Sheets. Furthermore it shows you specific strategy recommendations for each of the key customer clusters (and if you want to get started quickly you can plug-in your data into the provided workbook to use it as a template in order to segment your clients right away).
The workbook.
The recency frequency monetary (RFM) analysis
The recency frequency monetary analysis (RFM analysis) is a classic analysis model for behavior based consumer segmentation. It segments customers by scoring them on a 1-5 scale in regards to how recently, how often, and how much they have bought (different scales may be used, however the 1-5 is usually the one used in a commercial context). Those three factors can then be used to predict how likely it is that a customer will purchase (or for some business models engage, e.g. apps) again.
Furthermore those segments can be grouped into clusters allowing you to develop targeted individualized content and promotion strategies which are more likely to convert with the customers in each cluster. Because each cluster is assigned a monetary value high value high-value customers can be identified easily and marketing spend can be allocated accordingly.
This guide gives a RFM Analysis example and shows step-by-step how to conduct a recency frequency monetary analysis with your data in Google Sheets. Afterwards it explains the content and promotion strategies, which can be applied to each individual cluster.
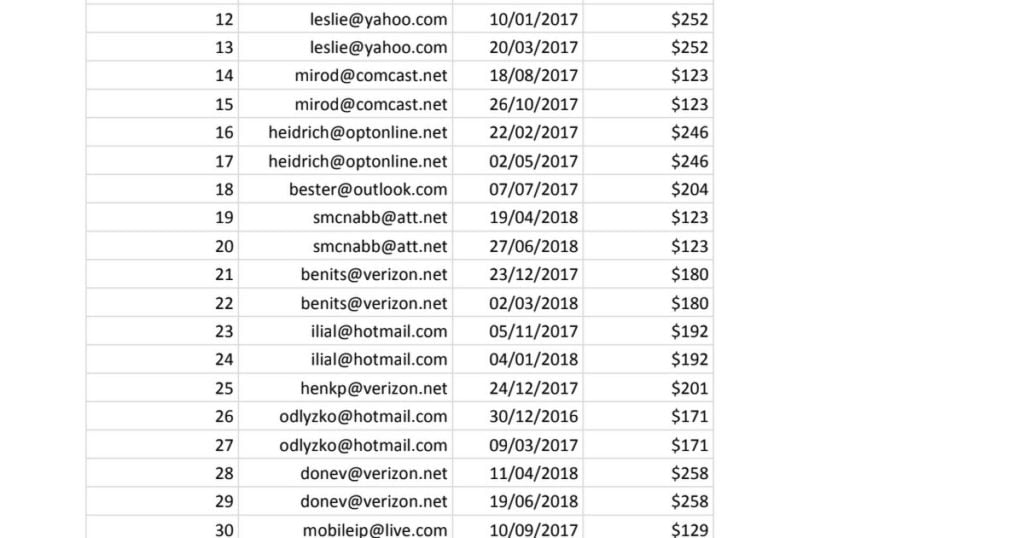
As usual I recommend working along in the above provided Google Sheet in order to understand everything. The workbook contains two sheets: Sample Data includes dummy data representing a transaction list (this could be anything from software sales to ecommerce store orders) and RFM Model which includes the solution to the RFM analysis example this guide is working towards.
If you are in a hurry: It is possible to replace to the dummy with your own data to use the RFM Model as a ready made template.
This guide is structured into three stages. We’ll start by doing the actual analysis in Google Sheets, continue with messaging for the different segments in stage two and end with some strategies on how you can use the segments for your paid advertising campaigns. While the first part might seem a little bit technical I promise you it is not and all will be done in Google Sheets. It’s totally doable for everyone, even if you consider yourself not to be a math or technical person.
Below find the links to the individual posts:
Building the RFM model
How to use Google Sheets to segment your customer base including gaining insights on the attributes of each segment such as average lifetime value, frequency of orders and more.
Defining the messaging strategy
How to address each segment with the most efficient messaging strategy.
Improving your paid advertising
How to use your high value segments to find similar customers via paid advertising – with better conversion rates and lower costs per acquisition (=incremental sales). And how to use your other segments to retain & grow existing customers via paid ads (=incremental revenue per customer).