There’s an old saying: Tell me and I forget, teach me and I may remember, involve me and I learn. I’m guilty of this in a big way — I was never much on classroom learning. But if I build something or write some code, I’m more likely to understand how it works and why.
Circuit simulation and software workbooks like Matlab and Jupyter are great for being able to build things without a lot of overhead. But these all have some learning curve and often use clever tricks, abstractions, or library calls to obscure what’s really happening. Sometimes it is easier to build something in a spreadsheet. In fact, I often do little circuit design spreadsheets or even digital design because it forces me to create a mathematical model which, in turn, helps me understand what’s really going on.
In this article I’m going to use Google Sheets — although you could do the same tricks in just about any spreadsheet — to generate some data and apply a finite impulse response (FIR) filter to it. Of course, if you had a spreadsheet of data from an instrument, this same technique would work, too.
This is the first of a series about developing intuition and understanding of signal processing using — mostly — spreadsheets. You probably won’t get a lot of practical use out of this — although if you were logging data from a sensor into a spreadsheet and wanted to filter the readings, this might be your go-to technique. By necessity, we need to learn a bit about generating signals mathematically, but since that’s fairly easy, I’m going to put off the details for a future installment. However, for just about any signal processing job we want to do we’ll need filters. There are several kinds of filters we can have and this post is about the FIR filter.
About FIR
FIR stands for finite impulse response and it is a type of digital filter that might seem like magic. There are plenty of ways to explain it, but here’s the thing: making one is dead simple. The idea is to take a bunch of weights, multiply your data by the weights, and then sum it up. The weights are known as taps and they are just numbers. The more taps you have, the better filter you can make.
As a stupid example, suppose you had data and you had 3 taps of values: 1.1, -0.035, 0.336. These values are stored in an array called TAPS and are used along with another array called DATA. To run the calculation you skip over the first two time points (this calculation must have three data points) and start calculating with the third value:
FILTERED[2]=DATA[2]*TAPS[0]+DATA[1]*TAPS[1]+DATA[0]*TAPS[2]
 That’s it. Instant filter. There are two things, though. One is, a real filter is going to have a lot more taps. That’s easy enough. The other thing is where do we get the value of the taps?
Turns out that’s an article all by itself. However, there’s a simple practical answer: ask the computer to solve it for us. There are plenty of programs that can compute taps and at least one neat web site called t-filter.
The Easy Way to Compute Taps
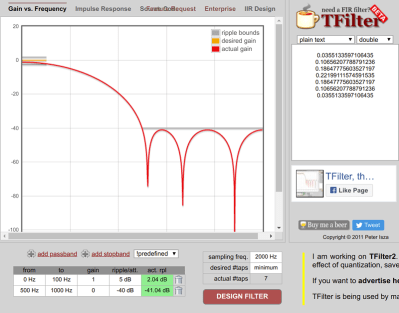
Let’s work out a silly example by hand. Open the t-filter web site and move to the bottom of the screen. The first thing to pick is the sampling frequency. Enter 2000 here. I’m going to keep the sampling rate low to make our spreadsheets more manageable.
You can add passbands or stopbands to the table at the bottom left, but instead, just pick “Low Pass” from the “predefined” dropdown. The page might ask your permission to continue. You’ll wind up with a stock low pass filter that has unity gain at up to 400 Hz and allows 5dB of ripple. There’s also a stopband of 500 Hz to 1000 Hz. Since the sample rate is 2 kHz, it doesn’t make sense to go past half of that. The “desired #taps” box should already say “minimum” and that’s almost always what you want unless you are trying to hit a lesser number of taps.
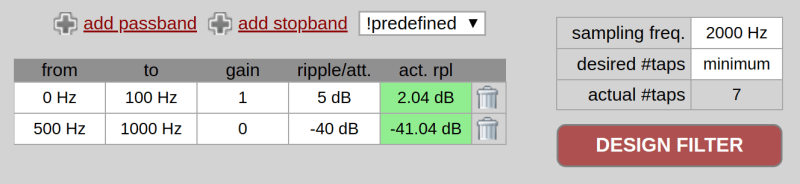
Change the 400 Hz “to” frequency to 100 Hz and press the big red button marked “DESIGN FILTER.” You’ll see seven numbers to the right along with a graph of the filter response. At the bottom, you’ll see that it took 7 taps and the actual ripple figures achieved.
Note the area between 100 Hz and 500 Hz is the “transition band.” The filter doesn’t have to meet any goals in that area. The narrower that transition band is, the more taps you are going to need, in general. For example, if you set a passband of 0 to 100 Hz and a stopband from 110 Hz to 1000 Hz, you’ll get 203 taps (and a long run time, too).
In addition to the taps, you can look at some example code for the filter implementation and the impulse response by using the tabs near the top.
Back to Your Regularly Scheduled Spreadsheet
If you click the “Source Code” tab on t-filter you get C code but that’s not what we are looking for this time. However, we can easily map the calculations in a spreadsheet. I cooked up a spreadsheet on Google Sheets. The sample rate is over in cell J1. The first three rows let you set up to three sine waves that will mix together. You can set the frequency in column B, the amplitude in column F and the phase in column H. If you don’t want a particular frequency you can set its amplitude to zero.


In the spreadsheet, you’ll find two graphs (you might need to scroll right if you’re on a small monitor). The first chart shows the three signals — at least the first bits of them.
The second graph shows the sum of the three signals and the filtered output from column G. That data computes from the signal in column E and the taps in column F. You can copy and paste right from the t-filter site to column F. Using the INDIRECT function, the sheet is smart enough to compute the right value no matter how many taps you have. Here’s how that works (this is a random row from column G):
=IF(ROW()<$J$3,"",SUMPRODUCT(INDIRECT($K$3),INDIRECT("E" & ((ROW()+1)-$J$2 & ":E" & ROW()))))The cell $J$3 is the first row that can have a valid output, so if we are earlier than that, the answer is nothing. This lets us get enough history to do the entire computation with all the taps.
However, if this cell is a live one, we get the indirect reference in $K$3. This is a reference to the filter taps and changes dynamically depending on what you paste in. The formula for K3 is simple: ="F5:F" & (J2+4)
J2 is the tap count (using the COUNT function) and the four is just a fixed offset since F5 is the first tap. There are no dollar signs on J2 here because I assume you won’t duplicate this formula, although they wouldn’t hurt. In the earlier formula, though, we don’t want the spreadsheet to adjust J2 relative to the new locations, so the dollar signs are needed there.
The same indirect trick computes the range in column E for the signal input. It starts at the oldest sample and runs to the current one, again using the length in J2. Once you have the two ranges set (the taps and the raw data) a simple call to SUMPRODUCT does all the math. That’s it. It really is that easy. The only hard part was accommodating the varying number of taps.
I added a few tabs that have taps for different filters: high pass, low pass, and bandpass. With the default signals (400 Hz, 150 Hz, and 30 Hz) you should be able to filter each one out successfully.
Catching a Wave
The wave generation part of the spreadsheet relies on the well-known formula: y=A(t)*Sin(ωt+Φ) that will be the topic of the next post.
In this formula, y is the output, t is the time, A(t) is the amplitude at time t (a constant, in our case), ω is the frequency in radians/second (the frequency in Hz times 2*π), and Φ is the phase in radians.
If you ever wanted to see what aliasing does when you try to output a signal higher than twice the sampling rate, here’s your chance. Try entering 2000 Hz in cell B1 and then change the phase to a few different values.
You would think you could export the spreadsheet to Excel, and you can — sort of. The graphs are a bit uglier, but even worse, the INDIRECT function chokes on column G in Excel 2007 and Excel Online. After a half hour, I figured out that sometimes (but only sometimes) using ROW() inside the INDIRECT call was causing a problem, but I finally gave up.
By the way, if you are more interested in why this kind of digital filtering works, you could do worse than to read this very intuitive paper from [Lavry Engineering]. If you prefer your filtering old school, check out our Don’t Fear the Filter features, along with [Bil’s] take on a universal analog filter.
Next spreadsheet up? Inside signal generation. Stay tuned.