Chart of the Day: Use for benchmarking your ad clickthrough rates (Ecommerce focus)
With the rapid adoption of smartphones by consumers, both Facebook and Google had to move fast to transition their desktop-based revenue model over to smartphone. This involved developing new ad placements for mobile which encouraged clickthrough to maintain their CPCs.
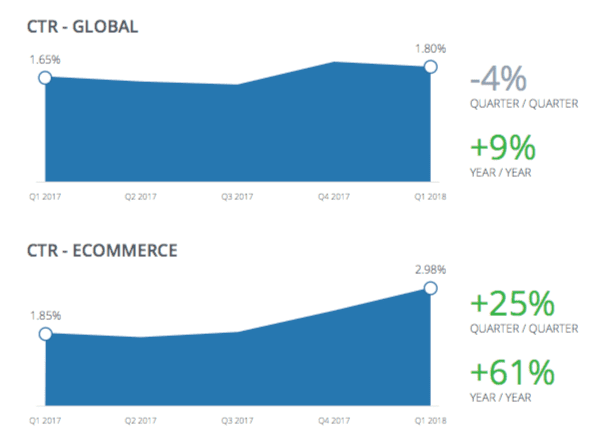
This benchmarking report from Nanigans shows how Facebook has been successful in encouraging relatively high average clickthrough rates of > 2% in retail ecommerce which are much higher than the sub 0.2% average CTRs for banner ads. They’re consistent with the > 2% average CTRs which we see from Google (if budget is sufficient to target the top positions.
Recent changes in CTRs from this report show response moving upward for ecommerce marketers even after increasing in Q4. The average Q1 2018 CTR of 2.98% in Q1 is 25% higher quarter-over-quarter and 61% higher year- over-year. This is at a similar cost of $10.24 CPM, a quarterly decrease of 2%. Average CPCs are $0.34.
Further breakdowns aren’t given for ad type. So, if you’re still making the case for investing in Facebook advertising then this shows what’s possible in terms of response at least.