Page speed improvements are high on most ecommerce to-do lists. The potential for increased revenue as well as better organic search rankings makes the effort worthwhile. But first, everyone wants to know how fast is fast enough. What does it mean to say that your goal is faster page speed?
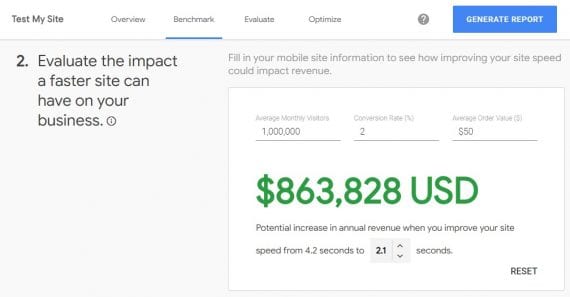
To help, Google offers a revenue calculator, shown below, to estimate the value of optimizing your site’s speed based on its web analytics. Plug in your traffic, conversion rate, and average order value, and Google spits out a revenue projection.
Google offers a revenue calculator that estimates the benefit of improving site speed.
However, you won’t find an easy answer on the search engine optimization side. There is no magic page speed score that equates to an organic rankings boost on Google.
Instead, Google fits each web page into one of two ill-defined speed buckets. “Basically, we are categorizing pages more or less as ‘really good’ and ‘pretty bad,’” Google’s Martin Splitt said last week. “So there’s not really a threshold in between.”
Moreover, there’s no way to know whether your site’s organic search rankings on Google already benefit from its page speed. That leaves ecommerce site owners not knowing how fast to make their site or whether the work is even necessary.
Google has long held that faster sites are not just better for searchers, but also are more likely to drive revenue. Thus, Google asserts, you should make your site faster regardless of whether it helps your organic rankings directly.
I agree with that general logic. But I lament the inability to estimate an SEO benefit for optimized page speed. It would help ecommerce businesses establish priorities.
Page Speed Metrics
One of the barriers to discussing page speed is the lack of a common language between marketing and development teams. Both sides need to understand the metrics beyond “just make it faster.”
The visual page-load timeline below can help.

This page-load timeline shows speed metrics in half-second intervals on home page thumbnails. Click image to enlarge.
Starting at the upper left, for the first 3 seconds the visitor sees nothing but a blank screen. At the 3.5-second mark in the page’s load, the first paint (FP) loads a framework for the site. It’s followed almost simultaneously by the first contentful paint (FCP), which shows the top navigation and other textual headings. Now the visitor is reassured that the site is loading as requested.
A couple more seconds go by without any visual cues before the first meaningful paint (FMP) begins, partially showing the content that will complete the visitor’s understanding. The hero element timing (HET) follows it almost simultaneously when the main visual for the page displays.
Finally, at the 8.5-second mark, visitors reach the time to interactive (TTI) point, when they can perform some action on the page, or click to another page.
| The Experience | The Metric | The Definition |
|---|---|---|
| Is it happening? | First Paint (FP) / First Contentful Paint (FCP) | The server responded and the framework of the page is visible; users can begin planning their first steps. |
| Is it useful? | First Meaningful Paint (FMP) / Hero Element Timing | Enough major text and images are visible that users feel sure of their next steps. |
| Is it usable? | Time to Interactive (TTI) | Users can interact with the page — use navigational menus, click on links, fill out forms. |
| Is it delightful? | Page Load Complete | All page interactions are smooth, natural, and function as intended. |
Free Tools
Google provides quite a few free tools to analyze page speed. They range from high-level data to deep technical debugging.
Google’s Test My Site is helpful to marketers. It offers the ability to benchmark your site speed against others, the aforementioned estimated revenue calculator that assists with cost-benefit analysis, and a list of suggested fixes.
For the technically-minded, Google offers two more toolsets.
- PageSpeed Insights is the more user-friendly of the two. It shows a handy one-size-fits-all PageSpeed Score from 1 to 100 — which sadly does not correlate to whether you’re receiving the page speed rankings boost — alongside some detailed recommendations for how to improve. The recommendations are handy conversation starters with your development team.
- Lighthouse crosses into developer mode with waterfall data for debugging. But it still offers the simple scoring and easier-to-understand recommendations of PageSpeed Insights. Lighthouse’s SEO data is better analyzed elsewhere, which I’ve addressed at “SEO: Using Lighthouse to Improve Site Speed.”
Beyond Lighthouse, Google offers two more technical platforms.
- Chrome Developer Tools is hidden in the Chrome browser menu. It offers a wide variety of tools, including Lighthouse as well as auditing tools. In addition to examining a page’s runtime for debugging, you can use it to view and change elements, modify the CSS and view the results in real-time, simulate other devices, and more.
- WebPageTest is the only third-party tool that Google recommends in its page-speed list. WebPageTest can gauge performance based on locations, devices, and user agents (such as Googlebot). It’s especially helpful in a development or staging environment, even if it is password protected. WebPageTest records screengrabs in a timeline and a page-load video. Both are very useful in presentations when making a case for additional resources.