


In two earlier blogs I compared the Question and Answer types and the General survey settings for 5 different survey tools:
- Microsoft Forms
- SharePoint survey
- SharePoint custom list
- SurveyMonkey free version
- Google Forms
Now it is time to gather the responses and see how they are displayed and what you can do with them. It is quite a long read but there are many screenshots as well!
What to look out for?
- How you can distribute the link to the survey
- What the survey looks like when you respond
- How the results are being displayed by default and if you can export them
- What else you can do with the data
Distribution
All tools allow creating a link or sending an email with the link.
Forms has the additional option to add the form directly on a SharePoint page, which looks very inviting, especially if the survey contains only a few questions. Forms can also generate a QR code to take you to the survey.


Sharing options in Forms at the bottom, from left to right: Link, QR code, Embed, Email
The SharePoint survey and Custom List can be added as a web part on a SharePoint page, but they are not exactly inviting users to enter.
SurveyMonkey has many different ways to get responses.


Next to link and email, SurveyMonkey offers more options to get responses.
Google Forms allows you to add the survey questions directly into an email, which is very convenient.


In Google Forms, you can add the complete survey to the email body. That is very easy for the audience!
User Experience
Of course the user experience is very important. If your survey has a tiny typeface, or takes forever to load, people are not likely to complete it.
You can still check out and complete the surveys below, to have an idea of their look-and-feel. Remember: you do not have to add any real data.
SurveyMonkey (will close after 100 responses – limitation of the free version)
I am sharing some screenshots of remarkable things.
The Net Promotor Score looks special:


The Net Promotor Score column. The image I added made the look-and-feel of the survey different, see David Lozzi’s blog.
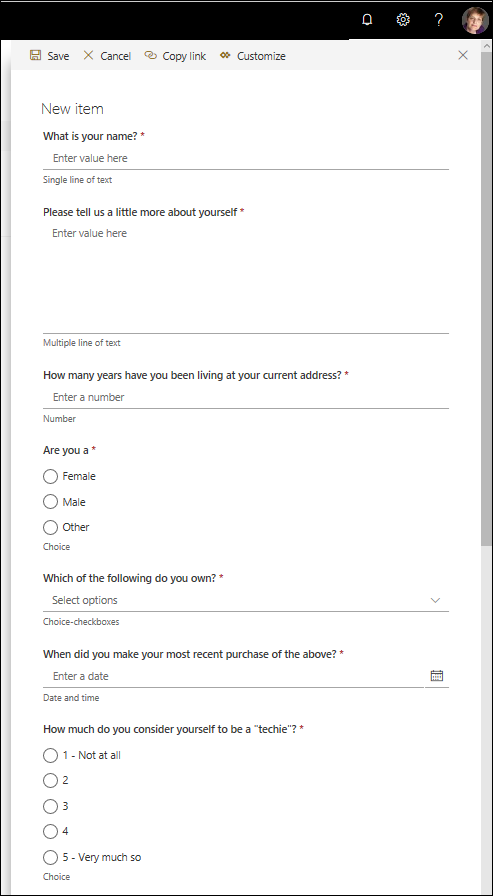
This is the SharePoint Survey, in case you had forgotten what it looks like 🙂


The good old SharePoint survey.
And this is how you enter data into a SharePoint custom list: in the information pane on the right-hand side of the page, which feels a bit strange.

This is the regular input screen in any list for metadata etc.
Next to a rather large font size, SurveyMonkey has the option to create columns for answers, which I really like as they make good use of space:


Those columns are very good when you have many options to choose from.


I also like SurveyMonkey’s slider and the reordering options.
Google Forms has nothing special, but it looks solid and modern.
Responses
Thank you everyone who has responded to one of the surveys! This allows me to show some of the results graphs. This is what the various response pages look like:
Microsoft Forms:


Survey information on top, as well as an option to export everything to Excel. “More details” opens up all responses for a particular question.
Recommended for You
Webcast, January 16th: The Latest in Growth Hacking: Link Retargeting


Colourful graphical summary of the responses.


The last part of the survey. Aha, the Net Promotor Score IS quite a special thing!
SharePoint Survey. I am sharing only part of the graphical summary as I guess you have seen it before and it is not very exciting. Now I remember how annoying that “multiple responses” question is – you need to re-score everything manually! 😦


Graphical summary of the SharePoint survey. Limited options and that “multiple responses” summary is just not useful.
The SharePoint custom list has no graphical summary. You just see the responses as line items in a list.
SurveyMonkey has a very long page of results. All responses are shown with a scroll bar (see the first screenshot) or with a graphical summary first and then the individual responses below. For each chart, you can change the chart type.
I will only show a few screens.


You can see how many people answered and skipped the question. Most recent responses are shown on top; a scroll bar shows all responses.


A question where a pie chart would have been more appropriate in my opinion. But…clicking the “customize” button top right will open a pane to change the chart type.


The multiple-answer question. Looks good.


This is the question which allows you to move answers around.
Google Forms results look like this:


Top of the results page. The green button top right allows an export to spreadsheet.


Useful graph of the multiple-choice-question.


Bottom of the results. The “Net Promotor Score” is displayed as any other result.
Results
I have captured the results in the picture below. You can also view/download this as Excel. Look at the “Responses and Results” tab. Please use and edit it, but I would appreciate if you would mention my name if you share it outside of your organization.
Legend:
- Green/Yes: Available by default, although it may have different names
- Orange: Available with a workaround
- Red/No: Not available


Conclusion
Again, the classic SharePoint options are in a league of their own.
Microsoft Forms appears to have more in common with SurveyMonkey Free and Google Forms than with SharePoint. All three surveys are pleasant to complete and the graphical display of results is much better than with the SharePoint survey.
Overall conclusion
Forms is really the new way to conduct surveys in your organization and possibly with externals. It looks pleasant both on a SharePoint page and when completing it, it has a ton of good options, decent colourful graphs and it works with Flow.
Some people will really like that Net Promoter Score 🙂
I am sure that Forms will continue to develop, so I will try to keep this comparison up-to-date.
The SharePoint survey feels a tad outdated, although you can still conduct good surveys with it. The graphical summary is very inferior to what Forms has to offer. My suggestion would be to use this only when you need one of the more advanced Q & A options, such as selecting a name from someone in your organization. The whole permissions management is also more complicated than with Forms, as described in my “SharePoint Survey lifecycle” blog.
The SharePoint custom list may not be the option that comes to mind first when you talk about a survey, but especially the options to process the data after collection can be the reason to use it. You can group and filter the entries just like any View and edit entries (e.g. mark an item as “Completed” or add a certain category). With the additional column types and the connection with Flow this can be the tool of choice when collecting data from the organization is the starting point for a project or process.
There are no graphics by default, but PowerBI may be used if needed.
Many thanks to my former colleague Scott Lewis who pointed out the benefits of custom lists when combined with Forms and Flow.
SurveyMonkey is of course THE specialized tool for surveys. It has extensive help for your survey questions and many options. It is the only tool that can show columns of responses, which is nice to keep your survey compact. It allows you to change the chart type of the results if desired. However, the free version has a few annoying limitations and I personally find the “management” interface rather cluttered.
For large-scale complicated surveys where you need to analyze responses in-depth the paid version beats Microsoft Forms.
Google Forms is a solid modern tool. Apart from the “display form straight in an email” it does not have any remarkable features.
Hope this comparison is useful to you. Have I missed any that are important for you? Please let me know – also if it has helped to move your colleagues away from SurveyMonkey (free) or GoogleForms! 🙂
Image courtesy of Geralt on Pixabay

