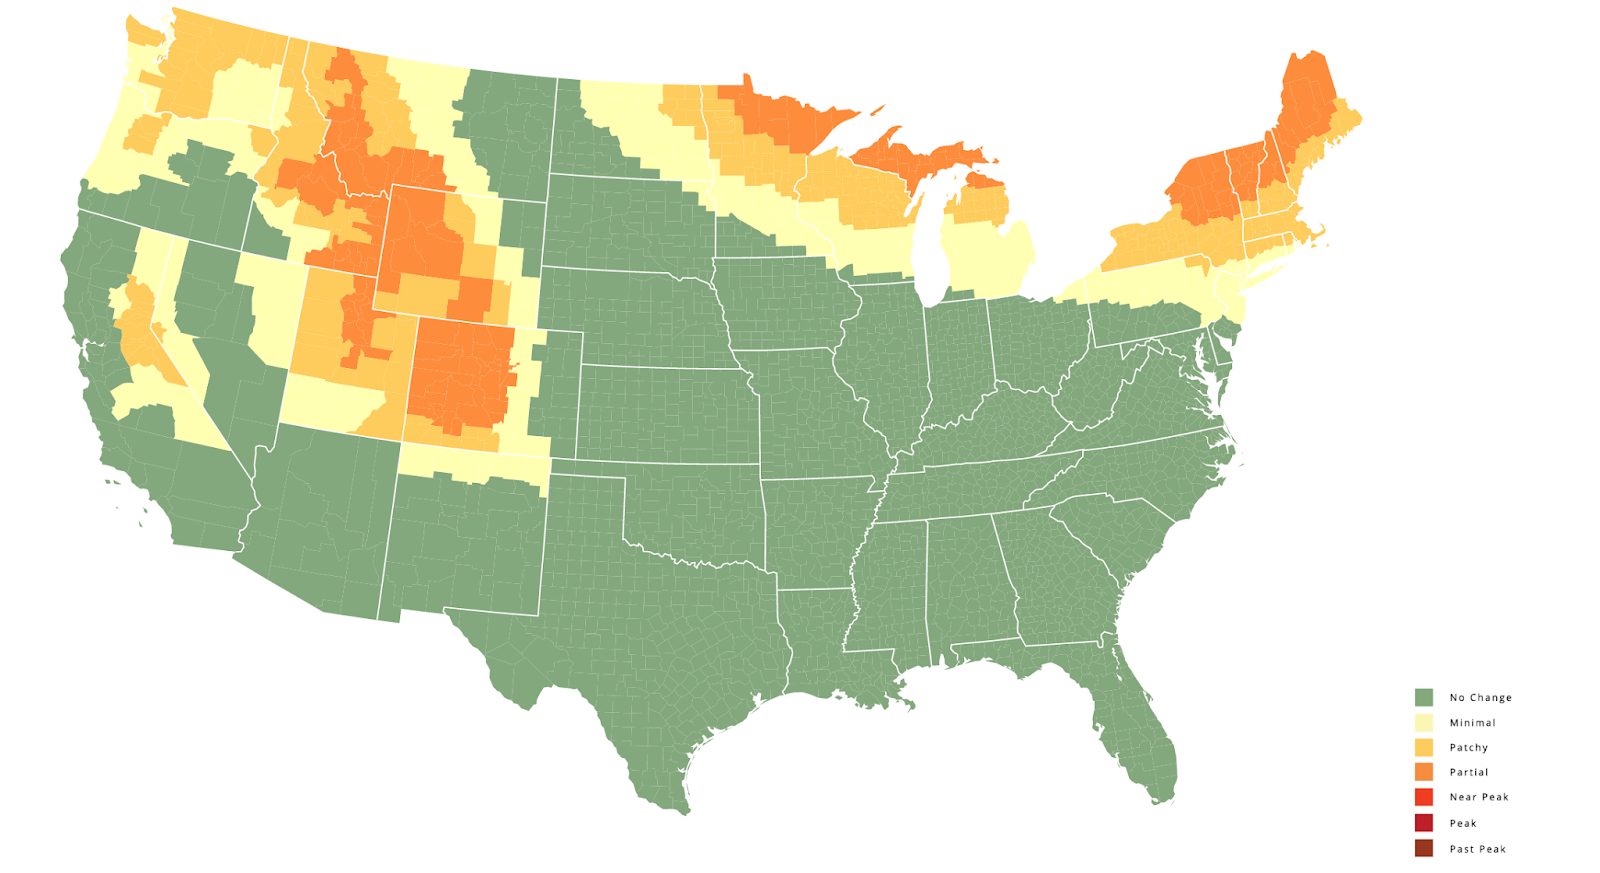
The 2019 Fall Foliage Prediction Map is a feature of the SmokyMountains.com website. The map displays a week-by-week prediction of when leaves in the continental United States will be changing colors from now through the end of November. You can see the predictions change by moving the timeline at the bottom of the map.
On the same page as the 2019 Fall Foliage Prediction Map there is a graph of average temperatures in the United States since 1900. The graph is accompanied by a short explanation of why leaves change colors in the fall and the relationship to air temperatures.
Applications for Education
The 2019 Fall Foliage Prediction Map doesn’t tell the whole story of why leaves change colors at different times in different parts of the country. I’d use the incomplete nature of the map’s explanation as a jumping-off point for students to hypothesize and investigate why leaves change colors at different times in different parts of the country. I might also have them investigate why some trees have brighter leaves than others in the fall.
Additional Resources for Teaching and Learning About Fall Foliage
A couple of weeks ago I shared a couple of good videos that explain why leaves change colors in the fall. Those videos are included below.
For an explanation of why leaves change colors that elementary school students can understand, watch the following SciShow Kids video.