Our compilation of the latest social media statistics of consumer adoption and usage
Social networks are now so well established, that there is a core ‘top 5’ social networks that don’t change much from year-to-year. But, as we’ll see in this post, the most popular social media sites vary a lot by level of usage in different countries and demographics. Understanding these differences in popularity of different social networks is really important when targeting specific audiences. When comparing the most popular social networks it’s best to review them by active account usage, not just the number of user accounts. We’ll also see in this summary that some social networks are growing more rapidly than others while some are now in decline.
2018 social media stats update
We’ll keep this post updated during 2018 as the latest statistics are published drawing on our recommended top 10 digital marketing statistics sources. We’ll be pointing to new data around social media channel penetration in the US from Pew Internet, as well as interactions based on research by Trackmaven, but first, we present the answers to some of the key questions marketers should consider when deciding on how to invest their time in social media. Since it is still early in the year, many graphs will have to rely on stats from Q4 2017 until the stats for Q1 2018 are released.
Download our free Social Media Marketing guide
Our free social media planning checklist will help get you up to speed with the issues you should think about when creating a social media plan, to avoid mistakes and manage your social media updates more effectively
Access the 10 Common Social Media Marketing Mistakes
Q1. Which is the most popular social networks
This compilation of the most popular social networks worldwide prepared by Statista gives a clear picture of the number of active users (in millions) with Facebook ruling supreme. This won’t be a shock to anyone! With over 2 billion active users it holds the majority market share. In January 2017 Facebook’s closest competitor, the Facebook-owned, WhatsApp was leading second, however, YouTube now jumps to second place with 1.5 billion active users. Facebook Messenger and WhatsApp follow behind in 3rd and 4th place.
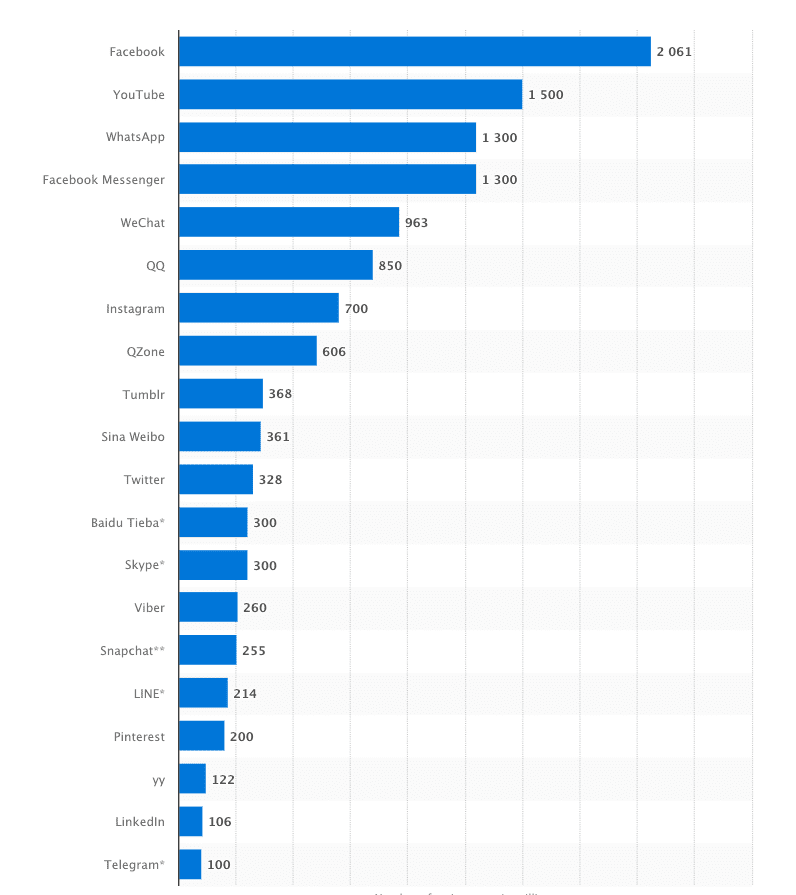
Following from this, we have predominantly APAC favoured platforms, with QQ, WeChat and Qzone all with over 600 million active users, highlighting the array of social platform offerings in the APAC. We then see a cluster of predominantly western social media networks in Tumblr, Instagram, and Twitter.
Q2. Which are the fast-growing social networks?
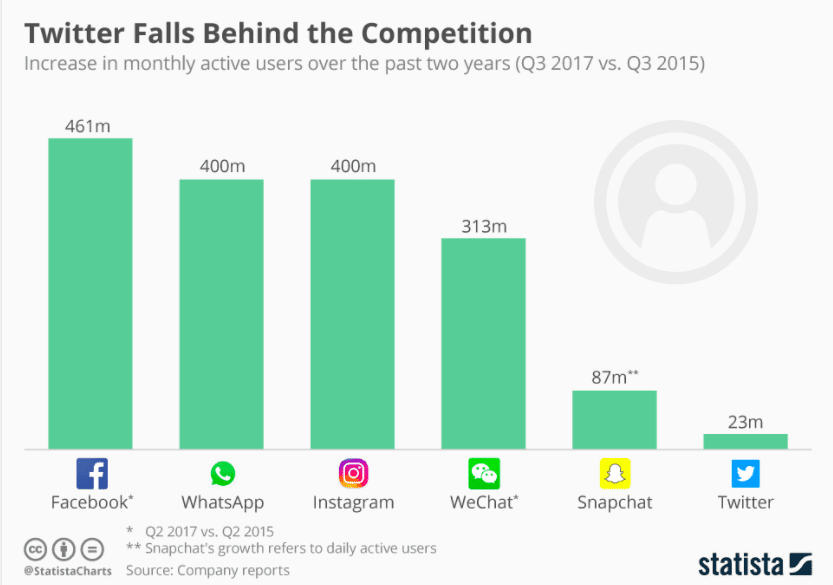
Every marketer has limited time for social media marketing, so which social network should you focus your efforts on? From 2010-2017 Twitter had the slowest growth of 313 million users compared to its biggest competitors, Facebook, WhatsApp and China’s WeChat. Instagram was created in 2013 and by 2014 had already surpassed the number of Twitter’s users.
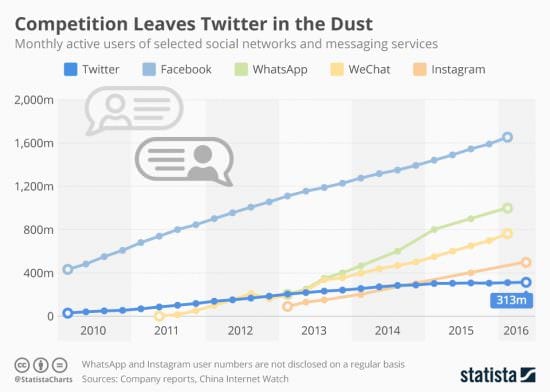
New research by Statista shows that in 2017 Twitter still falls behind its competition. It has the lowest increase in monthly active users from Q3 2015-Q3 2017 with only 23 million, compared to Facebook’s 461 million growth. Twitter is clearly losing ground – sad since we love it!
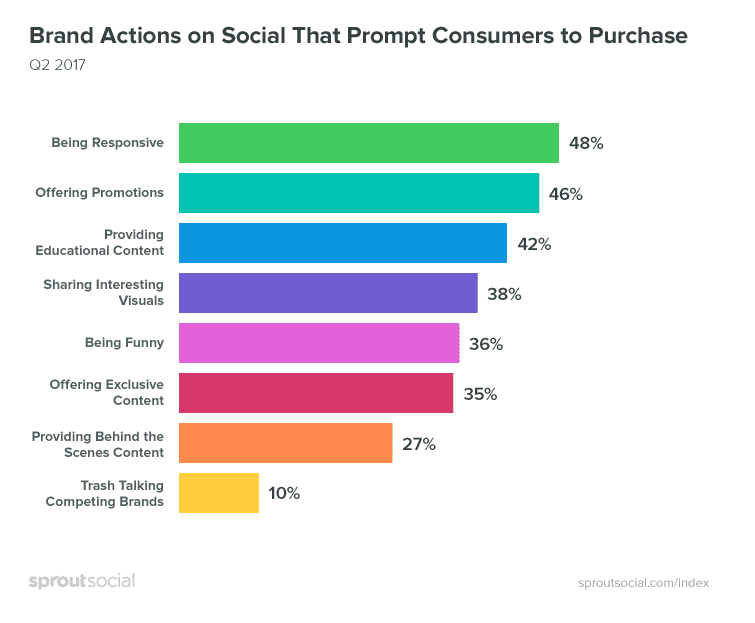
Q3. How do social users interact with brands on social?
Knowing how to behaviour / post on social media is also important as this is reflective of your brand personality and consequently influencers social uses to buy or unfollow! Social media is increasingly being used as a customer service platform where customers and potential customers want answers quickly and in real-time. Only 27%of social media user respondents will be prompted to purchase products after seeing behind the scenes content shared on brand social pages.
51% said that they would unfollow brands on social media if they posted irritating posts and 27% said they would mark/report the brand and page as spam and block them. This is why posting relevant, interesting content that resonates with your target audience and social users is important in retaining your Reach and Engagement with potential customers.
Q4. Which is the most engaging social network?
Another factor which determines the time we put into social media marketing is the engagement of the audience. Here we again see the dominance of Facebook – it’s also got the greatest engagement in time according to this insight from the US consumer panel from comScore.
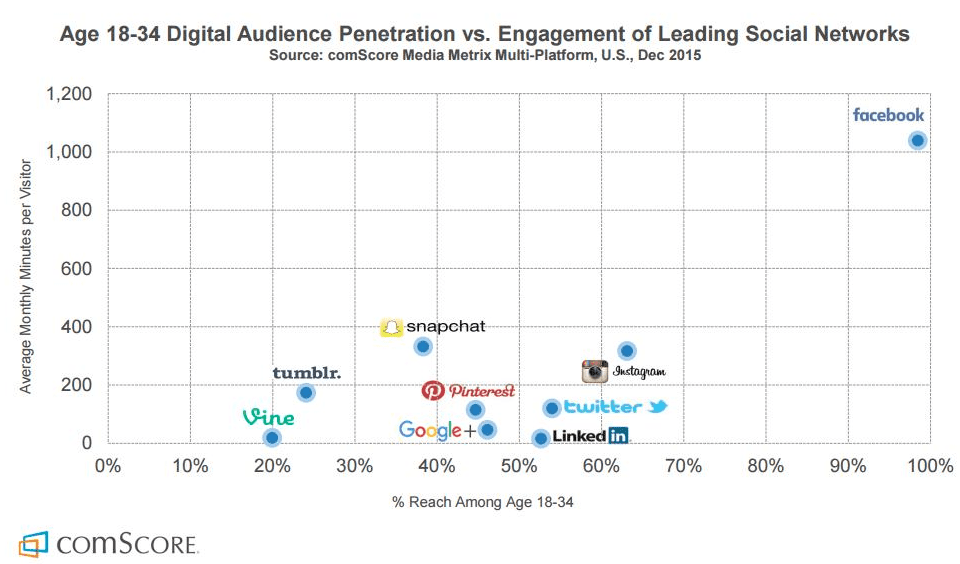
comScore has also published a more recent update on engagement in the UK comparing Facebook vs Twitter vs Instagram vs Pinterest vs Snapchat.
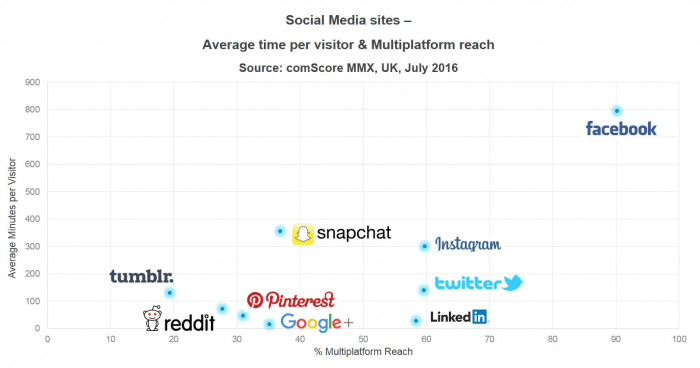
The above chart from Comscore shows engagement in terms of time spent on the platform vs reach among the millennial demographic. It’s interesting to see how effectively Facebook dominates, but also interesting to see how well Snapchat and Instagram are doing in terms monthly usage per visitor. For more Snapchat stats, see our post on Snapchat Marketing Statistics.
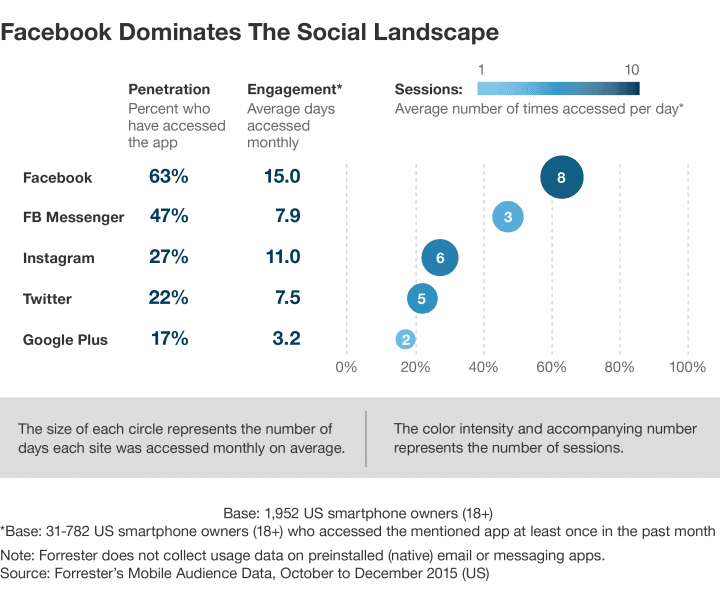
Facebook’s dominance is truly extraordinary. Not only does it take the top spot, it’s other platforms also take 2nd and 3rd respectively. Facebook Messenger has an impressive 47 penetration, and Instagram (also owned by Facebook) comes 2nd for engagement.
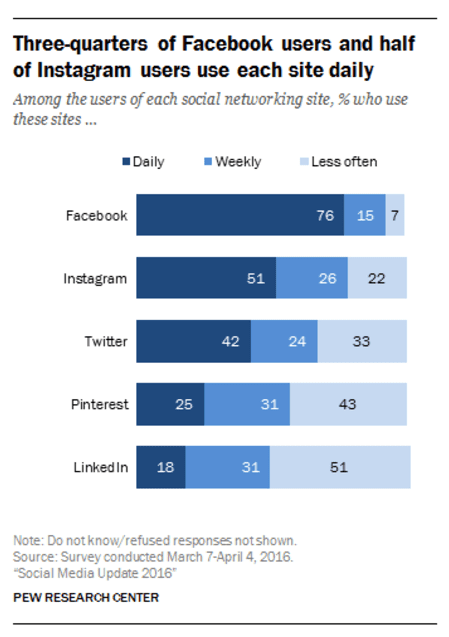
In this recent chart from Pew Internet below, we can see in terms of active daily use Facebook is also in the lead. 76% of users log in daily, whilst 51% do for Instagram (owned by Facebook). Twitter manages just 42% of users login in daily, only just over half the Facebook figure.
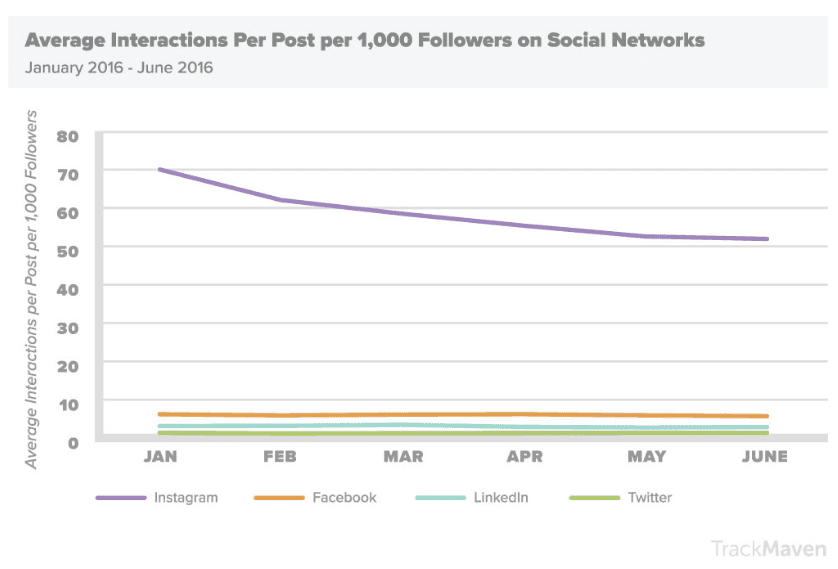
Q4. What are the different interaction rates in social media?
TrackMaven analysed 51 million posts from 40,000 different companies over 130 industries to establish which social networks achieve the greatest engagement per follower. The results show that Instagram absolutely dominates when it comes to interactions per 1,000 followers. In fact, it is so much higher than the other channels we’ve had to include a second chart just to show the difference between Facebook, LinkedIn and Twitter!
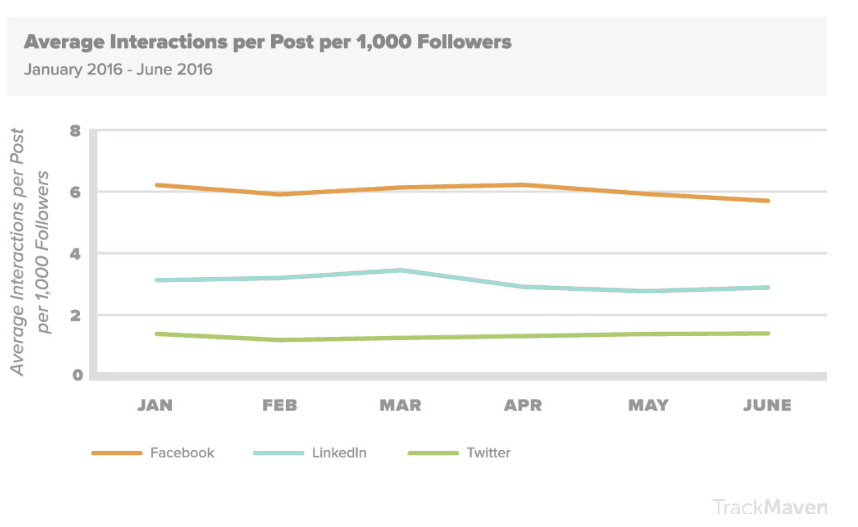
As you can see, Instagram dominates, but when it comes to the other networks Facebook has a considerable lead on Twitter and LinkedIn. This is in large part because people tend to post a lot more on Twitter because it doesn’t have an algorithm that only serves posts to a small section of an audience. This has turned Twitter into a bit of fire hose of content where companies have to share more and more often to be heard through the noise. This has resulted in lower engagement per post.
Q5. What is the overall Social Media usage globally?
We also want to highlight the great summary of social media and mobile stats from WeAreSocial Singapore, which is mainly extracted from GWI who they partner with.
For statistics on the social network usage and growth, we recommend Global Web Index (GWI) as one of the most reliable research sources of social media statistics to compare consumer use and engagement across different social networks. Research is conducted in quarterly waves, each of which has a global sample size of more than 40,000 internet users. Many other social media research programmes are no longer active. Although Global WebIndex is a paid subscription service, their blog provides useful insights on digital consumer behaviour and the Global Web Index Slideshare gives the latest top-level summaries which we share later in this compilation.
Each year, We Are Social update their massive global compendium of stats which gives some great insights into the world of social media. It’s a great download for presentations. It’s particularly interesting how far some countries are diverging in terms of social media use, and surprising that Western Countries are actually lagging a fair way behind in adoption rates.

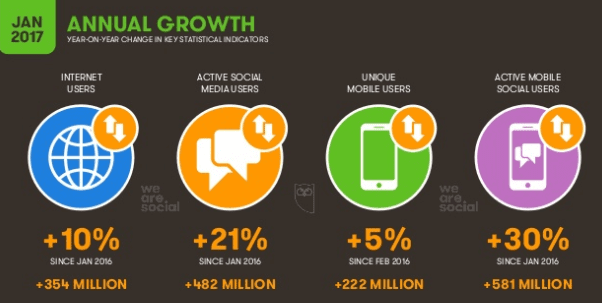
Annual growth continues apace, particularly in the number of mobile social users, which hit 17% last year.
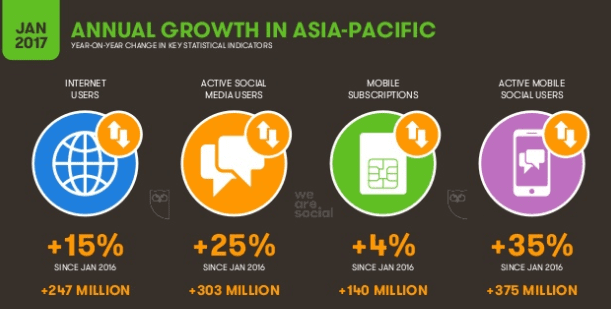
Asia-Pacific is driving much of this growth, which internet usage rates high and number of active social media users increasing 14% on the year before.
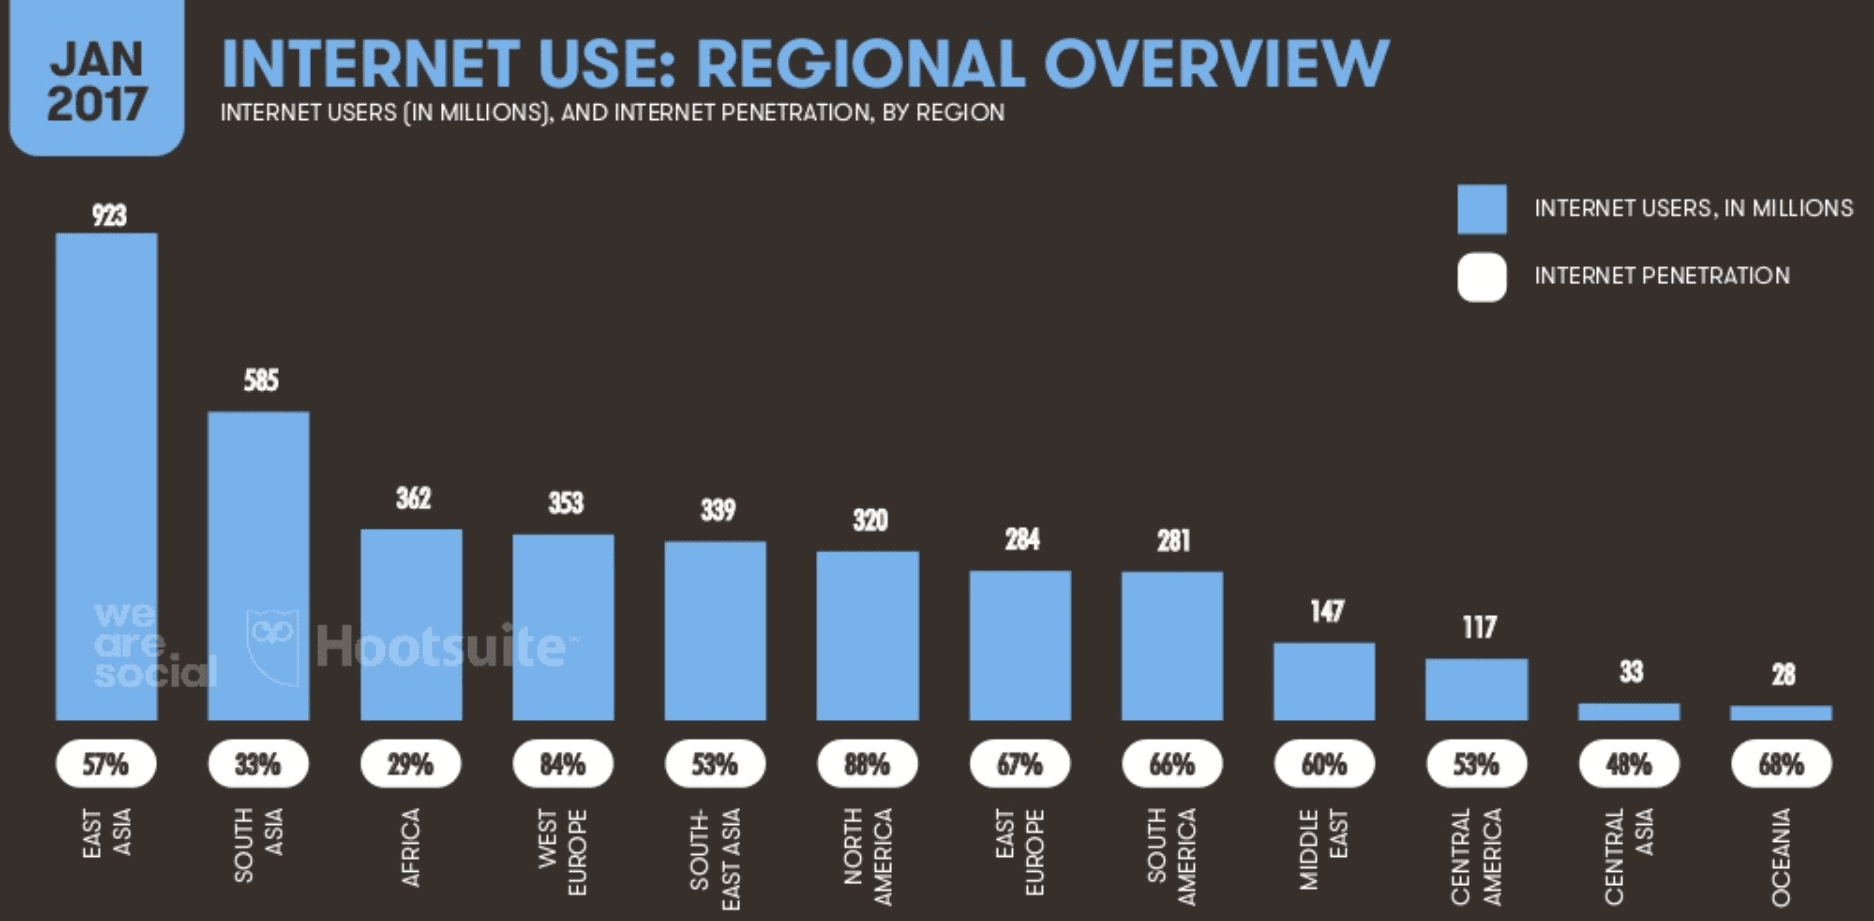
When looking at the world by number of internet users, it really rams home the importance of East Asian and South Asian markets. Digital offers new opportunities to reach these people, although as always cultural differences are considerable challenges to international marketers.
The full report from we are social contains a massive amount of data across 537 slides. It provides country-specific data for the vast majority of the world, so you might want to check out the slides of the countries in your core markets to get a better idea of the current state of social in the areas you operate.
US Social media adoption
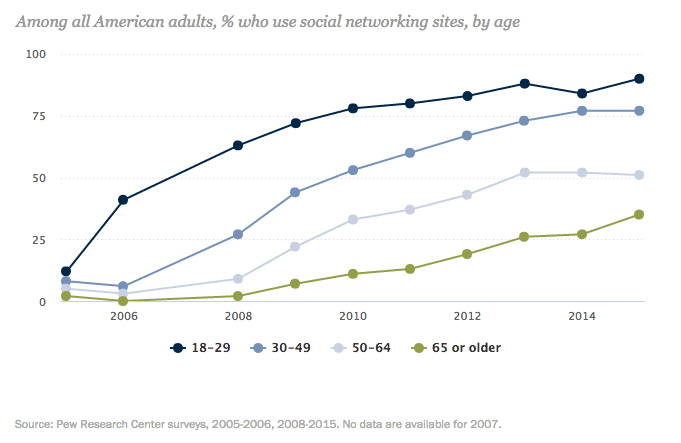
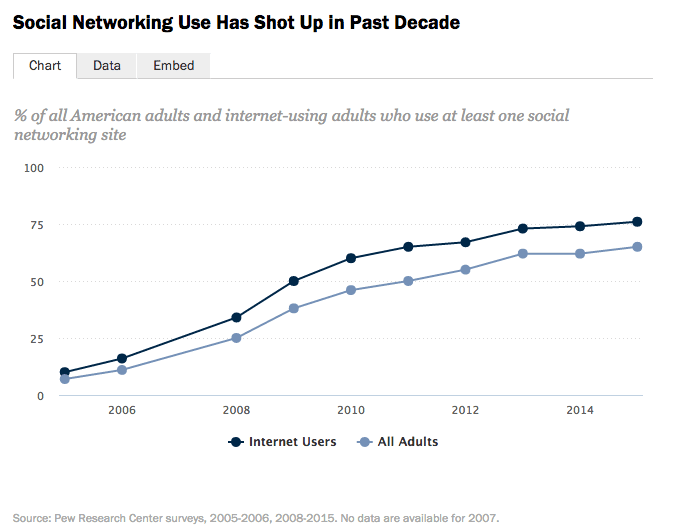
US consumer technology adoption specialists Pew Research Center released a new set of data on US Social Media US on October 8th which shows the latest social media trends and how far it has permeated society. Looking at data from the past 10 years, it charts the meteoric rise of social media.
10 years ago on 7% of the US population used one or more social networking sites. Now that figure has increased almost tenfold, to 65%. Of those who use the internet a massive majority of 76% of American’s use social media.
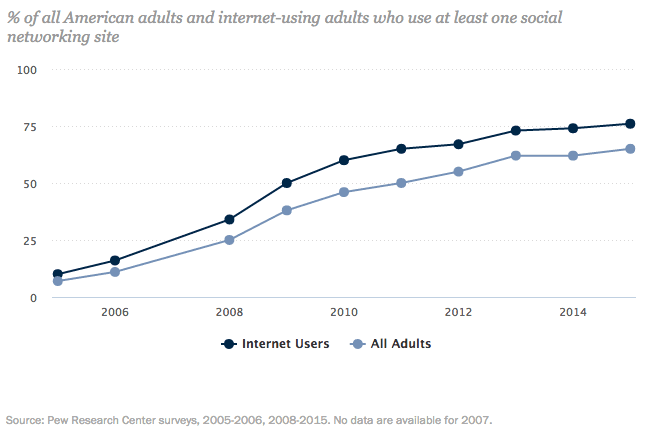
Social Media has grown massively, but it’s growth is now starting to plateau. Interestingly the over 65s segment are now driving growth, as other age groups have plateaued completely and use is hardly growing it all. Among the 50-64 age cohort, use hasn’t increased since 2013.
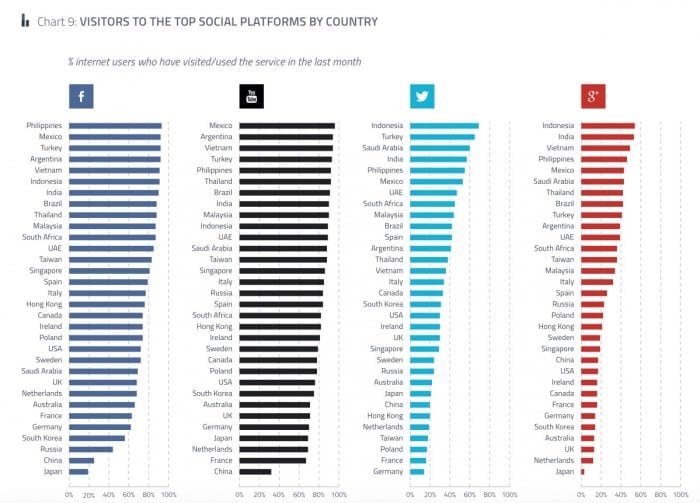
Social network popularity by country
This is a great visualisation of the popularity of social networks based on the interviews in the GWI report. If you pick out your country it’s probably way behind the countries in which these four core social networks are most popular. Indonesia, Philippines, Mexico, India and Brazil are in the top 10 for each with significantly higher levels of use than the US, UK and European countries.
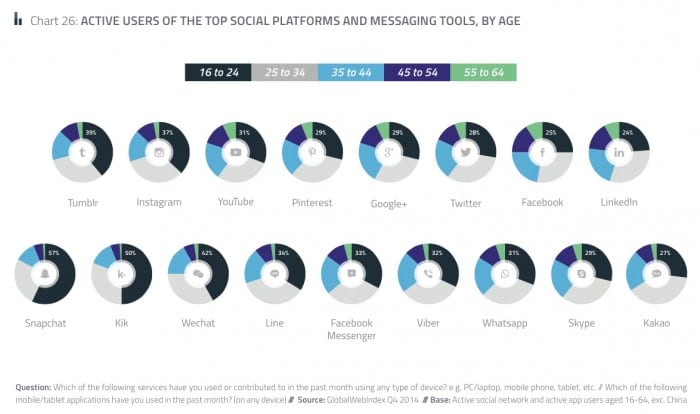
Use of social networks by different demographics
This chart is striking for the similarity of usage across different age groups. It shows that the social networks are now at a stage of maturity where they give opportunities to reach all age and gender groups. The exceptions to this are Instagram and Tumblr which are clearly popular with younger age groups.