


Merchants running Google Ads Shopping campaigns can now see e-commerce cart data in the UI to gain a clearer sense of which products are driving profitable cart transactions.
Why we should care. We are just over a month out from the holiday shopping surge that kicks off with Black Friday. With this data available in Google Ads, merchants can get a better sense of the profitability of their Shopping campaigns and how to optimize for greater gross profit.
The columns are also available at the product-level to provide insights such as which products are most likely to convert, drive values and more. The new reporting will also help you see when products that get clicks lead to sales of other products. This kind of insight could show that seemingly less productive products are actually driving sales of your top sellers, example.
You can also view this data with dimensions such as device or geographic location to analyze how each affects profitability, cart size average order value.
What’s new. Merchants capturing cart data with Google Ads conversion tracking will be able to see additional revenue and profitability data attributed down to the product level. The new metrics, currently in beta, take cross-device conversions into account.
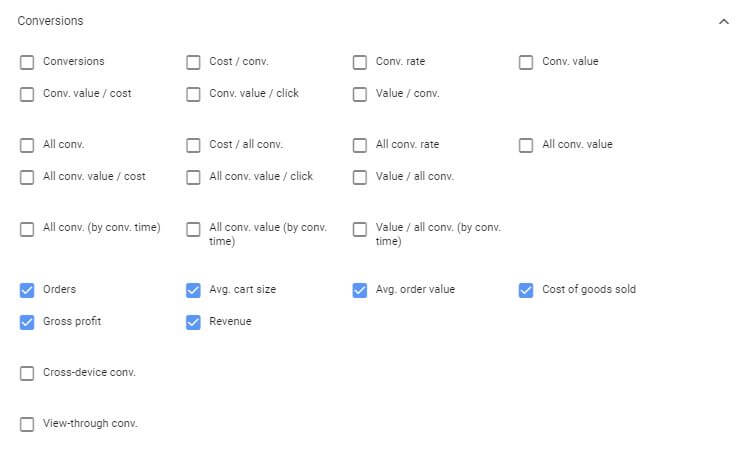
The cart data columns are:
- Orders: Sales attributed to ad clicks.
- Average cart size: Sum of items in-cart divided by number of orders.
- Average order value: Revenue from clicks on ads divided by the number of orders attributed to ad clicks.
- Cost of goods sold (COGS): Total business costs attributed to a product.
- Revenue: Income from transactions attributed to ad clicks. Calculated as the sum price of items in a cart attributed to an ad click.
- Gross profit: Total profit from transactions attributed to an ad click. Calculated as Revenue minus COGS.
In Report Editor, you can see more information about products purchased from Shopping campaigns with these product-level metrics:
- Units sold: Total number of sales of a product.
- Product revenue: Total income from a product.
- Product gross profit: Total profit from a product.
- Product average COGS: Business costs attributed to the product divided by the of products sold, and weighted by product impressions.
How to see the new columns. You’ll need to have Google Ads conversion tracking set up with the Google global site tag.
To get gross profit reporting data, you’ll need to include values for the cost_of_goods_sold attribute under “Price & availability” in your product feed submitted in Google Merchant Center. You can find setup information on this help page.
About The Author


Ginny Marvin is Third Door Media’s Editor-in-Chief, managing day-to-day editorial operations across all of our publications. Ginny writes about paid online marketing topics including paid search, paid social, display and retargeting for Search Engine Land, Marketing Land and MarTech Today. With more than 15 years of marketing experience, she has held both in-house and agency management positions. She can be found on Twitter as @ginnymarvin.