There are many metrics in Google Analytics. The bounce rate is among the most prominent, but it’s also among the most misunderstood. In this post, I will address the bounce rate metric and provide guidance in using it.
Google Analytics includes “Bounce Rate” in many reports under “Audience,” including Audience > Overview.
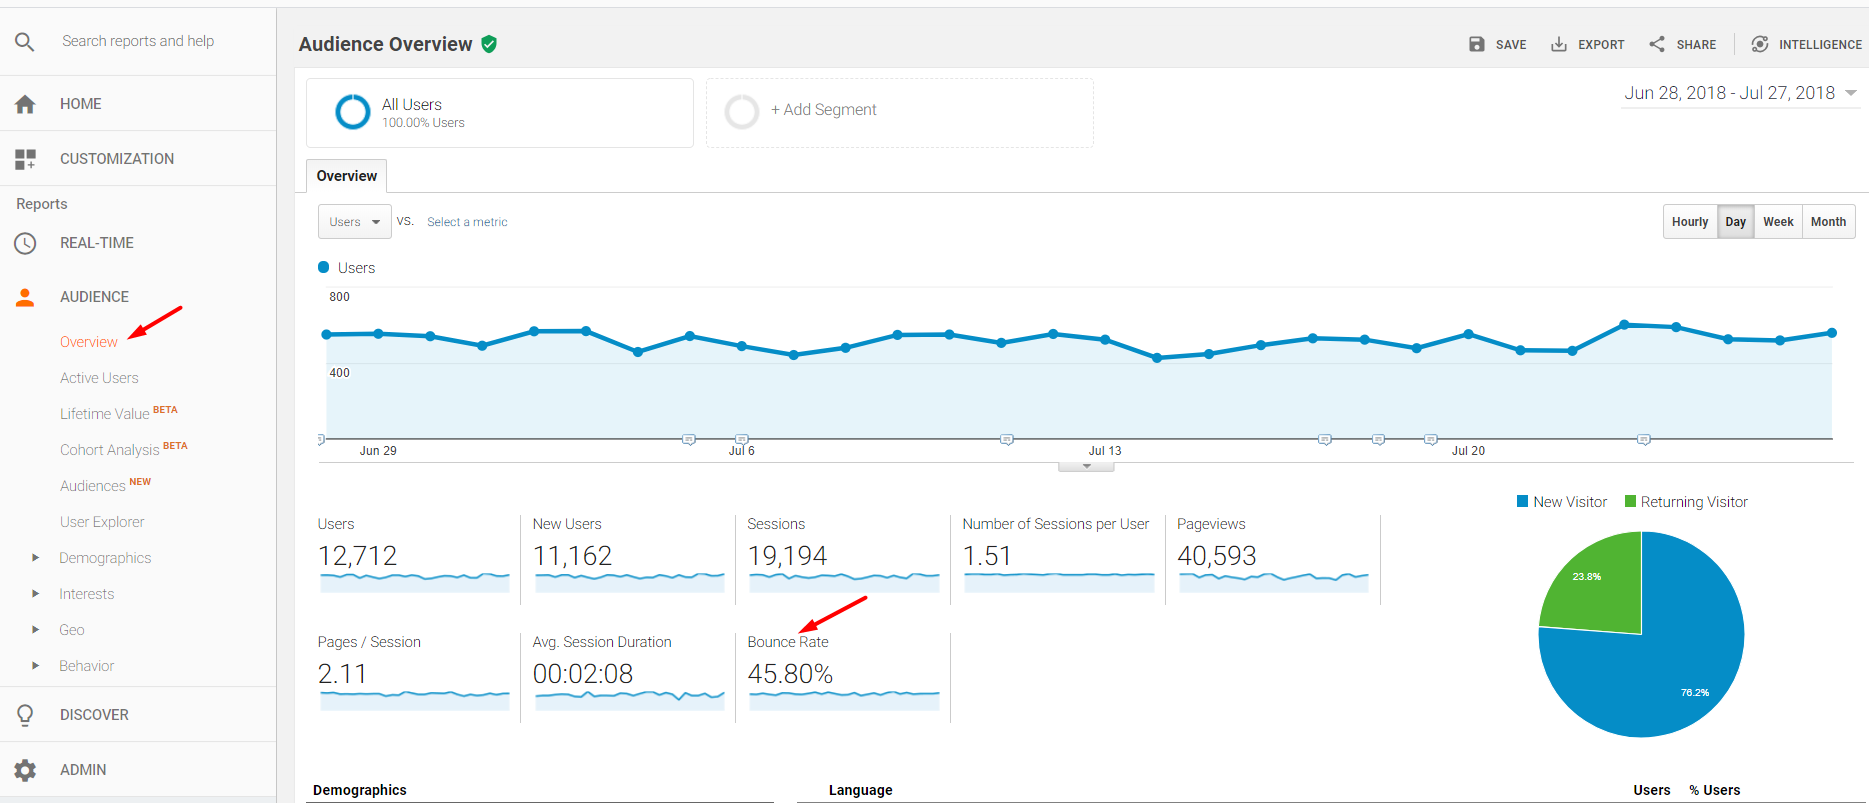
Google Analytics includes “Bounce Rate” in many reports under “Audience,” including Audience > Overview.
—
Bounce Rate is also reported in the “Acquisition” reports.
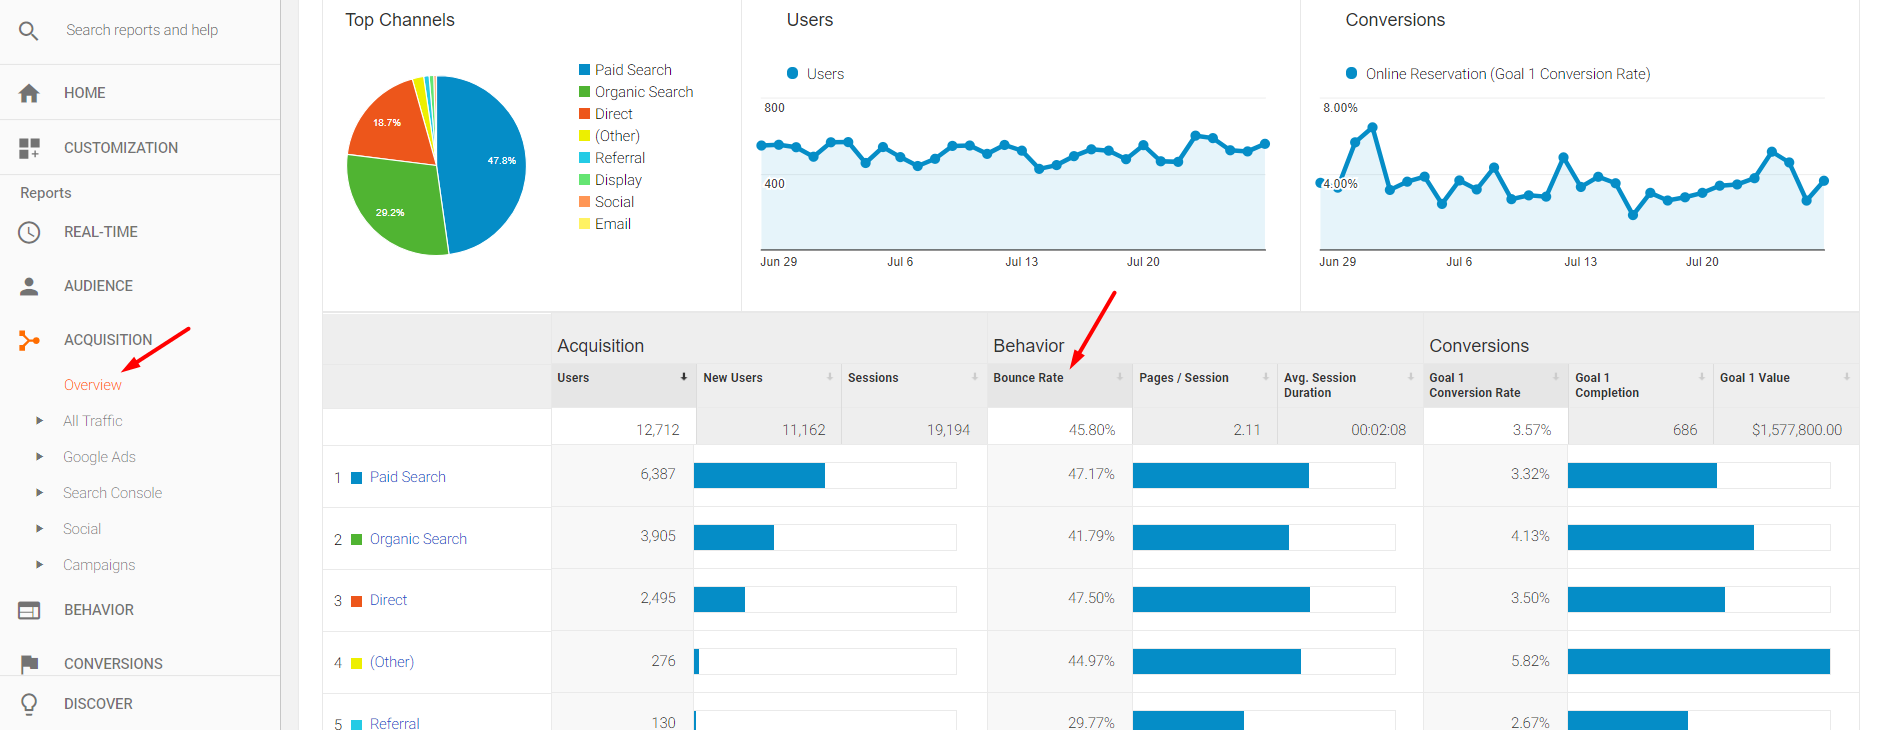
Bounce Rate is also reported in the “Acquisition” reports.
Google Analytics records a bounce whenever a user lands on a page of a website and exits the site without additional engagement hits. Typically, this means the user does not proceed to another page. But engagement hits can also be Events, Ecommerce Actions, and Ecommerce Transactions. All impact the bounce rate.
Analyzing Bounce Rate
I’m frequently asked, “What is an acceptable bounce rate?” Online merchants should keep the bounce rate as low as possible for all traffic, especially paid traffic. Bounce rates over 50 percent typically equate to low conversion rates. But merchants should investigate even a 30 percent bounce rate, especially, again, for paid traffic.
There are exceptions.
Say a user lands on an ecommerce product page and decides to purchase the product. But she wants to call the merchant first. She may purchase over the phone, complete the call, and leave the site without generating another hit. Google Analytics would report this as a bounce. But it was a fantastic session because it resulted in a sale!
Time on Page
High bounce rates will always correspond to a low “Avg. Time on Page” since Google Analytics records Bounce Rate as the percentage of visitors who access a page and leave without navigating to another page or without tripping another engagement metric. A visitor can spend, say, 15 minutes on a single page but if he does not access another page or record an engagement action, Google Analytics has no way of knowing how long that visitor remains on that page. For those cases, Google Analytics will assign an Avg. Time on Page of zero.
Thus, for accurate Avg. Time on Page metrics, create additional engagement hits in Google Analytics, such as scrolling down the page, clicking the play button on a video, or other Event. (There are instructions for scroll tracking on various websites, including where it is set up in Google Tag Manager. Scroll tracking should be rolled out on a duplicate Google Analytics view so that the original view does not see a reduction in bounce rates.)
The same scroll tracking can also be applied to content pages that have high bounce rates so that the content can be optimized to drive more reading down the page.
A low Avg. Time on Page — computed accurately with the use of multiple engagement hits, such as scroll tracking — can identify pages that are performing poorly. Estimate a reasonable threshold for Avg. Time on Page by measuring how long it takes to read at least half of the content at a slow pace. For ecommerce sites, anything over 1 minute, on average, is good in my experience.
The strategy for minimizing bounce rates and, therefore, increasing time on page differs among merchants. For poor performing pages (high bounce rate and low time on page), improve the content and the calls to action. For better performers (high bounce rate and higher time on page), improve the calls to action.

Examples of pages with bounce rates over 50 percent and average time on page less than 1 minute. Page 10 on the list has an Avg. Time on Page of 1:44 (1 minute 44 seconds).
Conversion Rate
Compare ecommerce conversion rates with bounce rates for possible correlations. To do so, go to Behavior > Site Content > Landing Pages to view both metrics.
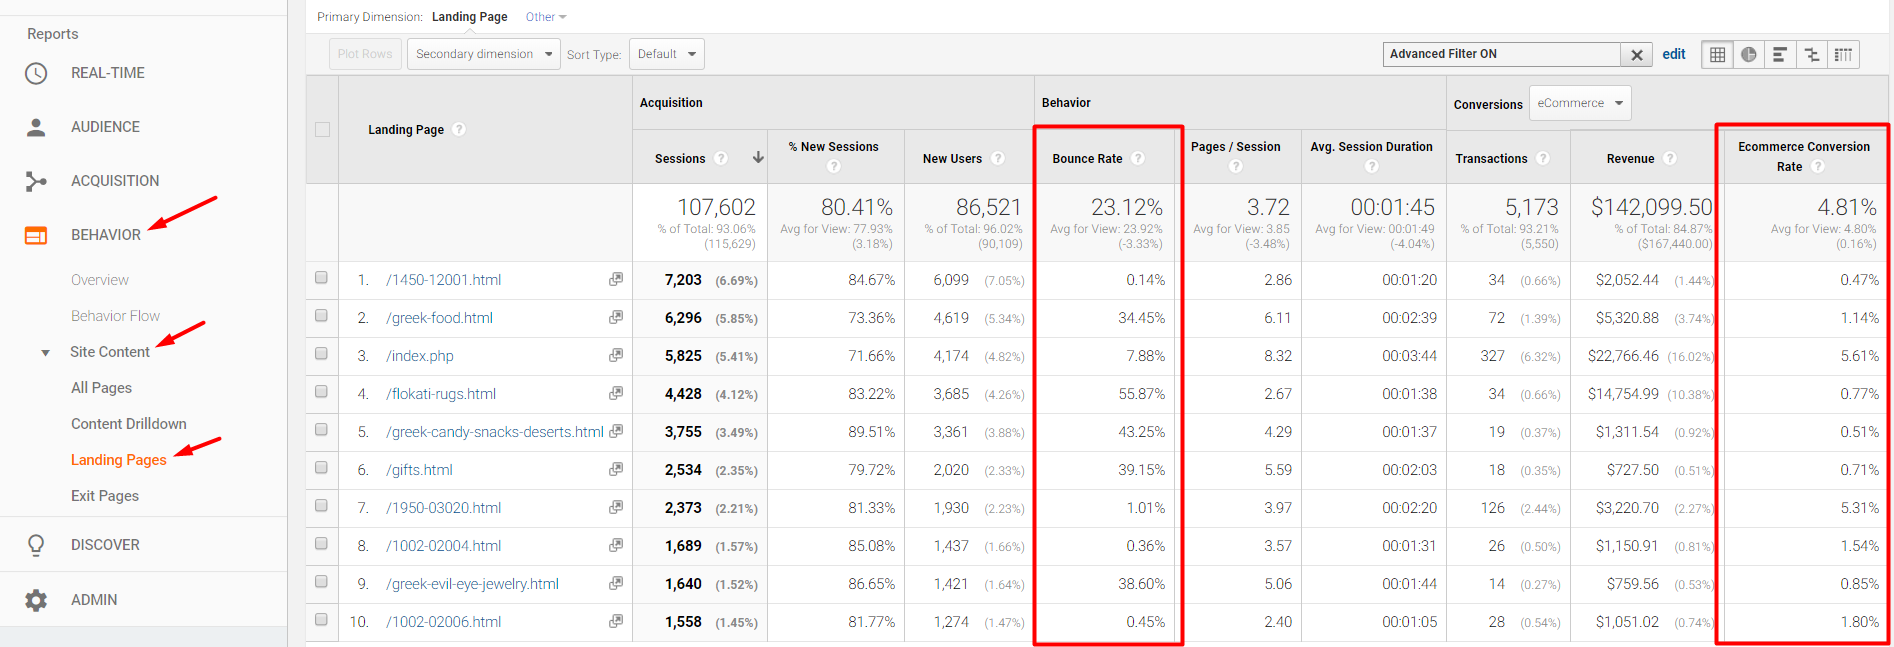
Go to Behavior > Site Content > Landing Pages to compare ecommerce conversion rates with bounce rates.
If both Bounce Rate and Ecommerce Conversion Rate are low, look for ways to optimize the content and the calls to action — or the value proposition if applicable.
Some pages may have high bounce rates (over 50 percent) but convert reasonably well (3-5 percent or better). In this case, there may be opportunities to identify what non-converting visitors are missing in the page content or value proposition, especially if the landing page is in the path to purchase.