Clients and even conference presenters are using Google Search Console’s position wrong. It’s an easy mistake to make. Here’s why you should only trust position when looking at query data and not page or site data.
Position
Google has a lot of information on how they calculate position and what it means. The content here is pretty dense and none of it really tells you how to read and when to rely on the position data. And that’s where most are making mistakes.
Right now many look at the position as a simple binary metric. The graph shows it going down, that’s bad. The graph shows it going up, that’s good. The brain is wired to find these shortcuts and accept them.
As I write this there is a thread about there being a bug in the position metric. There could be. Maybe new voice search data was accidentally exposed? Or it might be that people aren’t drilling down to the query level to get the full story.
Too often, the data isn’t wrong. The error is in how people read and interpret the data.
The Position Problem
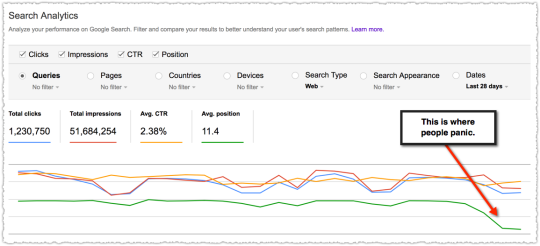
The best way to explain this is to actually show it in action.
A week ago a client got very concerned about how a particular page was performing. The email I received asked me to theorize why the rank for the page dropped so much without them doing anything. “Is it an algorithm change?” No.
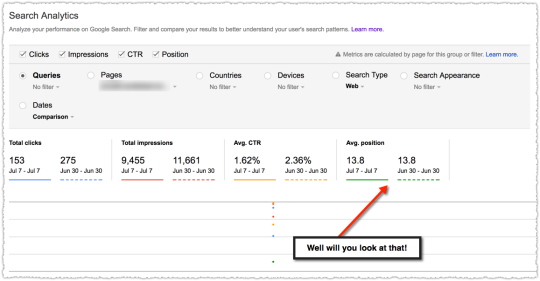
If you compare the metrics day over day it does look pretty dismal. But looks can be deceiving.
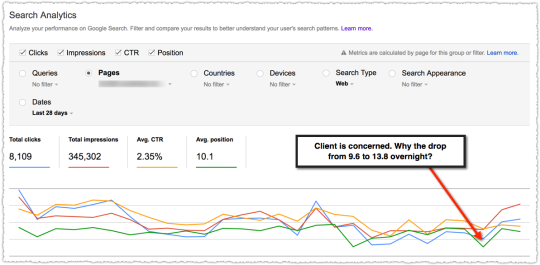
At the page level you see data for all of the queries that generated an impression for the page in question. A funny thing happens when you select Queries and look at the actual data.
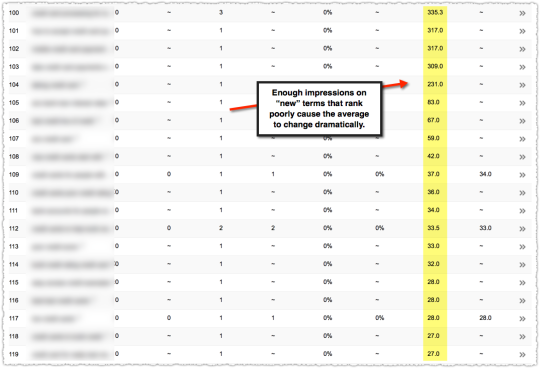
Suddenly you see that on July 7th the page received impressions for queries that were not well ranked.
It doesn’t take a lot of these impressions to skew your average position.
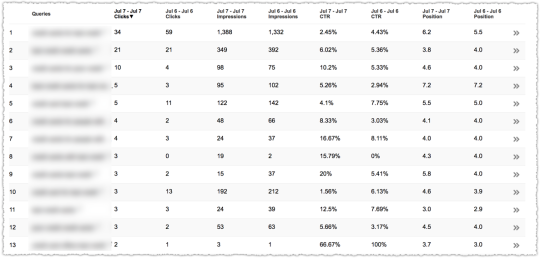
A look at the top terms for that page shows some movement but nothing so dramatic that you’d panic.
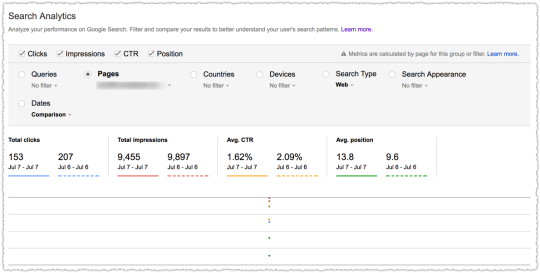
Which brings us to the next flaw in looking at this data. One day is not like the other.
July 6th is a Thursday and July 7th is a Friday. Now, usually the difference between weekdays isn’t as wide as it is between a weekday and a weekend but it’s always smart to look at the data from the same day in the prior week.
Sure enough it looks like this page received a similar expansion of low ranked queries the prior Friday.
There’s a final factor that influences this analysis. Seasonality. The time in question is right around July 4th. So query volume and behavior are going to be different.
Unfortunately, we don’t have last year’s data in Search Analytics. These days I spend most of my time doing year over year analysis. It makes analyzing seasonality so much easier. Getting this into Search Analytics would be extremely useful.
Analyzing Algorithm Changes

The biggest danger comes when there is an algorithm change and you’re analyzing position with a bastardized version of regex. Looking at the average position for a set of pages (i.e. – a folder) before and after an algorithm change can be tricky.
The average position could go down because those pages are now being served to more queries. And in those additional queries those pages don’t rank as high. This is actually quite normal. So if you don’t go down to the query level data you might make some poor decisions.
One easy way to avoid making this mistake is to think hard when you see impressions going up but position going down.
When this type of query expansion happens the total traffic to those pages is usually going up so the poor decision won’t be catastrophic. It’s not like you’d decide to sunset that page type.
Instead, two things happen. First, people lose confidence in the data. “The position went down but traffic is up! The data they give just sucks. You can’t trust it. Screw you Google!”
Second, you miss opportunities for additional traffic. You might have suddenly broken through at the bottom of page one for a head term. If you miss that you lose the opportunity to tweak the page for that term.
Or you might have appeared for a new query class. And once you do, you can often claim the featured snippet with a few formatting changes. Been there, done that.
Using the average position metric for a page or group of pages will lead to sub-optimal decisions. Don’t do it.
Number of Queries Per Page

This is all related to an old metric I used to love and track religiously.
Back in the stone ages of the Internet before not provided one of my favorite metrics was the number of keywords driving traffic to a page. I could see when a page gained enough authority that it started to appear and draw traffic from other queries. Along with this metric I looked at traffic received per keyword.
These numbers were all related but would ebb and flow togther as you gained more exposure.
Right now Google doesn’t return all the queries. Long-tail queries are suppressed because they’re personally identifiable. I would love to see them add something that gave us a roll-up of the queries they aren’t showing.
124 queries, 3,456 impressions, 7.3% CTR, 3.4 position
I’d actually like a roll-up of all the queries that are reported along with the combined total too. That way I could track the trend of visible queries, “invisible” queries and the total for that page or site.
The reason the number of queries matters is that as that page hits on new queries you rarely start at the top of those SERPs. So when Google starts testing that page on an expanded number of SERPs you’ll find that position will go down.
This doesn’t mean that the position of the terms you were ranking for goes down. It just means that the new terms you rank for were lower. So when you add them in, the average position declines.
Adding the roll-up data might give people a visual signpost that would prevent them from making the position mistake.
TL;DR
Google Search Console position data is only stable when looking at a single query. The position data for a site or page will be accurate but is aggregated by all queries.
In general, be on the look out for query expansion where a site or page receives additional impressions on new terms where they don’t rank well. When the red line goes up and the green goes down that could be a good thing.
The Next Post:
The Previous Post: Ignoring Link Spam Isn’t Working