
I’ve previously written about how to use Kissmetrics to find which backlinks drive signups. I wrote that article because we all know backlinks are great for SEO, which is great for traffic, but what really matters is the quality of traffic you’re getting. So, what that post explained was how you can use a Funnel Report to see who came to your site, and how many of them signed up. We then segmented that traffic by the first ever link that sent them to our site.
It’s a nice, handy way to use Kissmetrics to help provide some insights and potentially future campaigns.
But what about the step after the first visit or a signup? What about retention? How do you find which sites are sending you the visitors that keep coming back?
The idea for this post came to me from my own experience. I’ve been using DuckDuckGo (DDG) lately, and one day I simply entered weather just to see what would return. I saw that DDG uses a site called DarkSky, which is one that I’ve never heard of, even though they have the #1 paid weather app in the App Store.
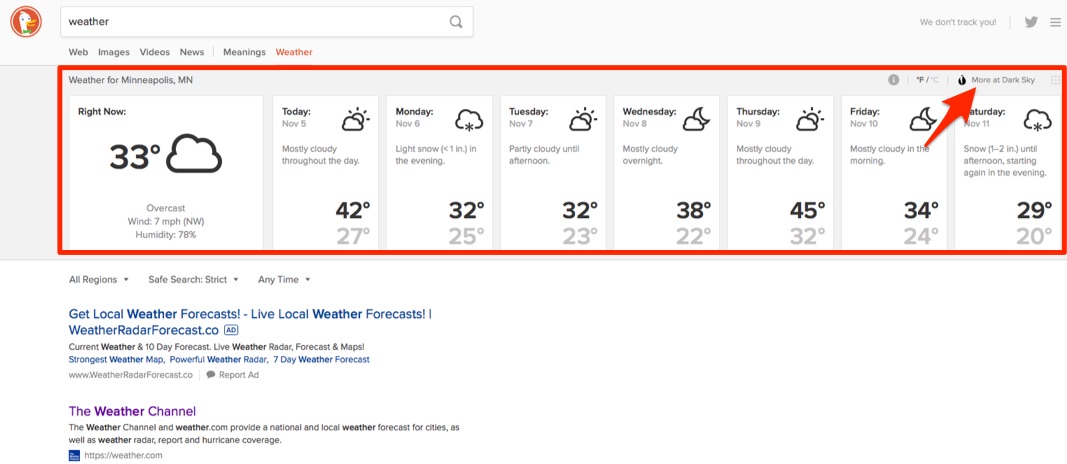
I liked the layout of the site, it’s ad-free content, and the forecasts have been pretty accurate. Now I use it as my primary weather site.
So this had me wondering – if I was working at DarkSky, how would I know where people are coming from? And of all the traffic channels (direct, organic search, DDG, etc.) that are sending us traffic, how could I track that to see which sources brought the highest retention? In this case, we’ll refer to retention as simply coming back to the site after their first visit.
So, here’s how to find that out using Kissmetrics.
The Cohort Report
Kissmetrics is full of reports that each serves a different purpose. Some can be used for analyzing customer acquisition campaigns; others can be used for retention analysis. And some can be used for both.
The Cohort Report is primarily used to track retention (some even use it for conversion rates). It groups people together based on similar attributes and tracks their behavior overtime. In our case, we’ll be grouping the people that have visited our site, and we’ll group them by the domains they were first referred by.
The set up is pretty easy. We’ll set our conditions for those that have Visited Site and Visited Site. We’ll then segment by the first referrer:
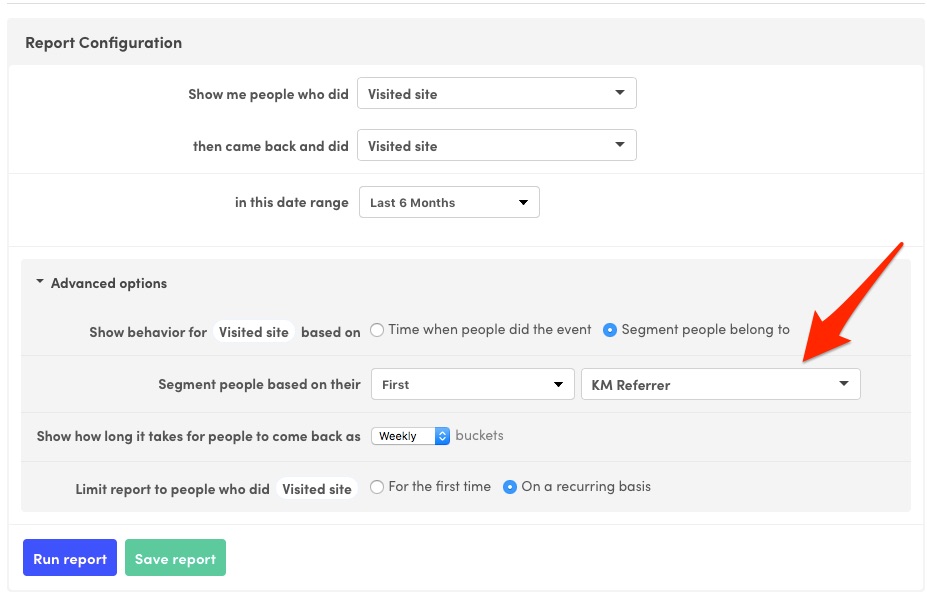
KM Referrer is simply the referring URL that brought traffic to your site. If a visitor came to your site via a Google search, the KM Referrer would be www.google.com. If they came from the Kissmetrics Blog homepage, the KM Referrer would record as blog.kissmetrics.com.
It’s also important to note that we’re tracking people on a week-to-week basis. This means that each week is a “bucket”. All visitors that came from Google in the last 6 months are put in the www.google.com bucket, then tracked each week. If they visit in the second week after their first week, they’ll be placed in that bucket. If they don’t return in the third week but do in the fourth week, they’ll appear in the bucket for the fourth week as well.
Now that we got that cleared up, let’s run the report and get our data:
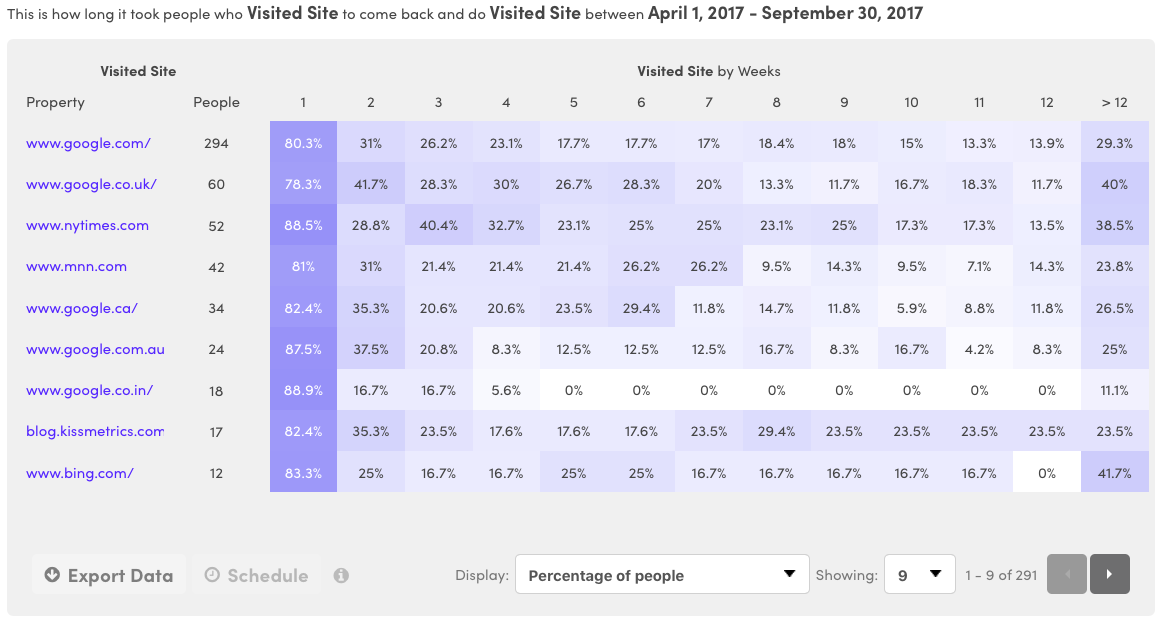
So it looks like organic search from Google is sending us the most traffic.
However, we see our highest retention is the 52 people that came from nytimes.com. To me, this data signals that we should spend more time trying to press coverage. SEO is always great, and it has good retention, but nothing beats the traffic coming from nytimes.com.
So What Does All This Mean?
Traffic is the first step. The second step is retaining that traffic by getting those people to come back. Find what percentage of new users come back (using the cohort report) and then see where you’re getting your above-average retention (with a significant amount of traffic). That’s where the Cohort Report shines – showing you where you’re underperforming and outperforming against your baseline retention.
Conclusion
Traffic is great. Signups are even better. But the most important part is retaining those new users. That’s the only way to build quality traffic and an audience.
So how do you measure your progress on retaining users?
This is where cohort reports come in. Specifically, the Kissmetrics Cohort Report (which was the example we used here). It’s segmentation flexibility (you can group people by whatever you track), along with our person-tracking analytics means that you get not just numbers, but also who you are retaining and where they came from.
This post really started out to answer a question – how would DarkSky (or any other site) know if the traffic they get from DuckDuckGo (or any referrer) is being retained? And, perhaps at a higher level, how would they know if they’re even getting traffic from DuckDuckGo? I wrote that post to answer this question. To recap, in two steps:
- Run a Cohort Report, segmenting your group by their original referrer domain.
- See how many of the people that come from that original referrer by viewing each bucket across the row in the report’s data.
Any questions? Let me know in the comments.
About the Author: Zach Bulygo (Twitter) is the Blog Manager for Kissmetrics.