Brands are investing more in a data-driven approach, because the results speak for themselves.
Strategies infused with insight drive the bottom line.
Getting hold of the right data doesn’t have to be challenging. But analytics and behavioral data alone won’t cut it.
Survey data – insight given directly from consumers – is what fills in the gaps.
But filling in those gaps starts with querying data.
This is about finding the answers to questions, and it’s a key part of any solid research process.
Here’s how to do it with GlobalWebIndex.
Step 1: Create your audience.
You might want to run a query on all internet users, but if you need to look at a particular audience, you’ll need to need to create one.
A new audience can be created from scratch using the Audience Builder section of the platform.
If you already have a strong idea around who you want to target, simply build it fresh and give it a name. But if you don’t yet have a solid idea yet – try one of the pre-saved audiences.
To explore these, type in a search term in the search bar to see what’s available. For example: “Online shoppers”, “Male”, “Female”, “Employment”, “Education” or “Mobile Gamers”.
Alternatively, you can also run a query without creating any audience if want to analyze trends at a market (or country) level.
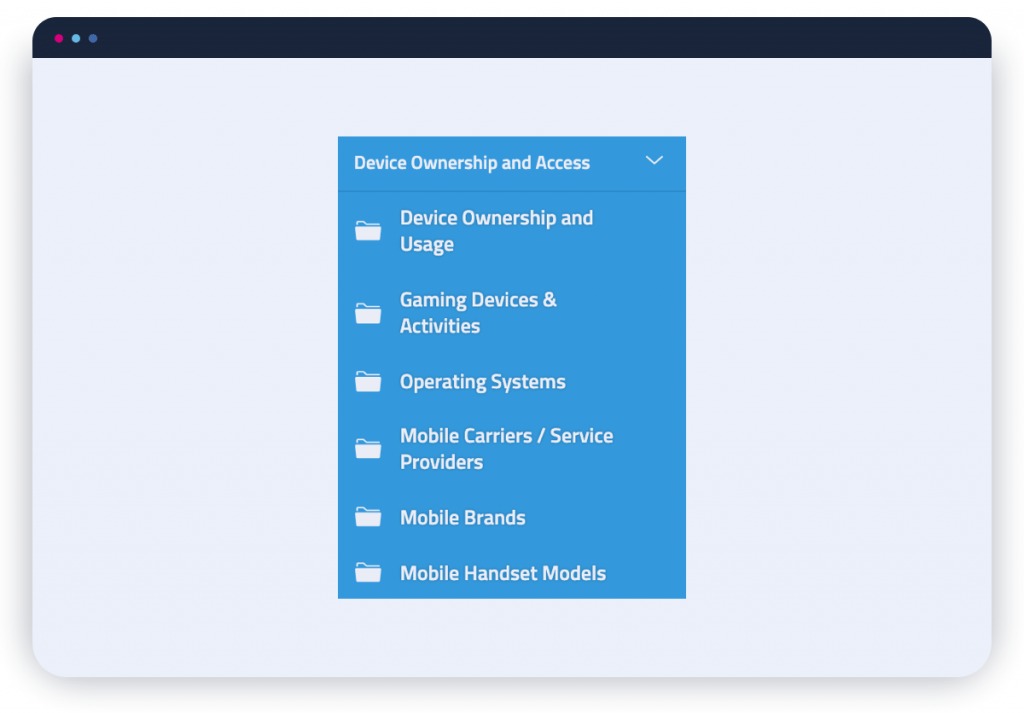
Step 2: Select the category you want to explore.
From here, you’ll need to switch over to Chart Builder, where you can start getting into your analysis.
You’ll find a wide range of topics and these are separated into categories, from ‘Device ownership and access’, to ‘Online activities and behaviors’ and ‘Marketing touchpoints’ – to make things a little easier.
Decide on the area you want to profile your audience against. In this example, we’ll go with ‘Device ownership and access’.
Tip: if you ever get stuck or lost, just type a keyword into the ‘Search’ bar and it’ll show all the questions and data we have associated with that word or phrase.
Here’s how it should look:
Step 3: Get more specific.
Selecting ‘Device ownership and access’ will bring up a new set of options.
Granularity is key. Depending on what you most want to know about your audience, select the most relevant option from the list.
We’ll go with ‘Gaming devices and activities’.
Here’s how it should look:

Step 4: Visualize the data.
There’ll be another list under ‘Gaming devices and activities’, and whatever option you choose is the data you’ll see visualized.
We went for ‘Devices used for gaming’, which brings up a chart that’s comprised of consumer answers to nine different questions nine data points.
At the moment, the data you’re seeing is representative true of all consumers globally since you won’t have applied a specific audience or market just yet.
Here’s how it should look:

Step 5: Choose a timeframe.
Data that moves at the speed of the market is a competitive advantage. We refresh ours quarterly.
Each quarter of data is referred to as a ‘wave’. Click the ‘Waves’ icon and select the time period you need.
And whether you want to view 2019 data, or data from the past five years, you can do both.
Here’s how it should look when you select waves from 2019:

Step 6: Apply your audience.
While global data is great for comparison, you should always aim to zero in on a specific audience (or audiences – if you wish).
Audiences and their traits are unique. Your campaigns should reflect that.
At this stage, you will have already created an audience or chosen to use one of our many pre-built audiences. In the right-hand navigation panel, click on the ‘Audience’ icon and select which one it is.
We chose the pre-defined audience “Online Shoppers”, and it’s as easy as that. Now, the figures and percentages will reflect answers from online shoppers only.
Top tip: You can also choose not to apply an audience if you need to get a market view instead. All you need to do is specify which market – for example, ‘Spain’ – under ‘locations’.
Here’s how it should look:

Step 7: Export your findings.
Export any chart and customize what you see with a simple click.
Select the export button icon in the bottom right-hand corner. Choose the order in which the data will appear (alphabetical, descending or ascending), the format you need (a graph or a table) and the download will start instantaneously.
Here’s how it should look:

Why getting answers on your audiences is key
In the age of media fragmentation, marketers are under pressure to adopt new, creative, and more personalized ways of attracting and retaining customers.
Hency why data – and what you do with it – can be your armour and your most powerful differentiator.
With ten years of GlobalWebIndex survey data in the bank, you can compare and contrast how much things have changed, with visibility over the way people’s attitudes, behaviors and perceptions have evolved over time.
So don’t just hope for good results. Plan for them.
Case Study: Running the right queries to inform campaign strategy
Founded in 1891, worldwide agency network BBDO is somewhat of a veteran in the advertising industry.
The agency network is the mastermind behind award-winning campaigns like Snickers’ ‘You’re Not You When You’re Hungry’ and Pedigree’s ‘Feed the Good’, both of which were shaped by an impactful insight into their respective target consumers.
The challenge
Changing perceptions towards payment methods.
BBDO is no stranger to using data to inform campaign strategy. So when a leading client in the financial sector was looking to target fans of a global sporting event, consumer data was a crucial starting point.
As with many brands in their sector, the challenge was to change the way people think about using various methods of payment abroad and at major events.
“The aim was to get people to feel comfortable and confident when they travel, and to see this brand’s services as a better option to facilitate transactions.
This confidence and ease of use meant they would no longer miss a moment of action, “ says Chris Daniele, VP and Director of Digital Analytics and Measurement Lead at BBDO NY.
“Fast and simple usage, plus exclusive access and benefits around this event, enabled us to overcome every fan’s fear of missing out.”
This is where querying GlobalWebIndex data to arrive at the consumer insight they needed came into play.
The action
Identifying the motivations behind the actions.
The team started by using GlobalWebIndex data to develop different segments of fans in key markets, based on behaviors and needs.
“Fans of this event share a global common ground, but their unique needs and behaviors can vary by market,” Chris continues. “So it was crucial to assess fan behaviors, using granular data in the Chart Builder covering key markets.”
Starting with a U.S.-based audience, the team then expanded their search to include a global view and ensure there were opportunities across the board.
They then dug deeper.
The team could analyze far more than just the demographics involved.

“Being able to examine who these people are and how they behave is where the value lies for us,” says Chris.
“Even if you identify an audience segment as being a millennial sports fan, they’re not all the same people.
Some like to stand out in a crowd, some are more tech-focused, some like to spend time with family and friends, some like to explore food and take pictures, go on adventures, and so forth.”

Once the attitudes behind their target audiences’ behaviors and levels of brand trust were identified and confirmed, the team ensured to save these queries in the platform, so they could refer back to them and use them could build out the campaign with confidence.
“We trust our sources and we trust our instincts. But if the data we see supports what we’re doing, that’s success. It’s then up to us to carry that forward.”
The result
Challenging traditional perceptions.
The key data-driven message of the campaign was:
The brand will help fans overcome FOMO, whatever shape or form it will take, with speed and ease.
It successfully challenged common misconceptions target audiences had around traveling, moving their opinion away from worrying about the risks associated with transactions in global markets to placing their trust in the brand and its unique offerings.
GlobalWebIndex made querying and extracting the data easy – and fast. Without it, Chris says, the campaign would not have been such a success.
“This data allows us to create and validate audiences on a global scale, which is something not a lot of agencies have at their disposal. This enables us to confidently go forward when we need to, with global audiences and strategies.”
Putting your audience first
An ‘audience first, tactics second’ approach works, and BBDO is proof.
If you’ve had doubts about how to best allocate your marketing budget, and how to make your messaging as targeted as possible, you should aim to spend a bit more time getting to know your consumers first. The answers are with them.
What will your next query be?