How to predict organic traffic is a question that comes up frequently in debates when SEO consultants and third parties discuss a planned SEO strategy.
As SEO isn’t an exact science, and due to the absence of general truths that apply to all industries (number of words per page, etc.) and of exact numbers (cost per click, etc.), SEO by its very nature makes mathematical predictions difficult.
Why Predict Your Organic Traffic?
Several reasons can lead the head of a company, the head of a department, and many other decision-makers to ask for SEO traffic projections:
- To be certain of the investment. (SEO is first and foremost an investment as a marketing channel.)
- To balance expenses between the SEO budget and the investment in paid search (Google Ads, Shopping, etc.).
Should You Agree to Provide Predictions?
This a question that every SEO consultant must answer sooner or later when confronted with an exacting manager or client.
It might seem risky to attempt to predict results because SEO is an inexact science.
Sometimes, the person you’re dealing with will understand this and will quickly see the complexities of SEO.
But in other situations, providing a prediction will be the sine qua non required before you can get a green light for any SEO strategy.
However, you will need to have enough information at your disposal before you can start calculating a prediction:
- Monthly organic sessions of the last 12 months: I would say that this is the minimum length of time that allows you to smooth projected data over a full year, which in turn allows for a realistic understanding of what’s behind the data.
- Monthly sessions from other channels over the same period in order to better understand the full picture of traffic on the website. This information will not be used in calculations.
- Important events that might require an increased investment in paid search.
- Seasonality (cycles of high and low activity) and key periods for the website’s industry.
This information needs to be a “good candidate” for producing realistic and pertinent projections. In other words, stochastic and incomplete data cannot be used.
How Can You Predict Organic Traffic?
Depending on the tools you use, several methods exist for predicting projected traffic.
For this article’s purposes, we’re going to look at two methods that are both easy to put in place and easy to explain to your higher-ups.
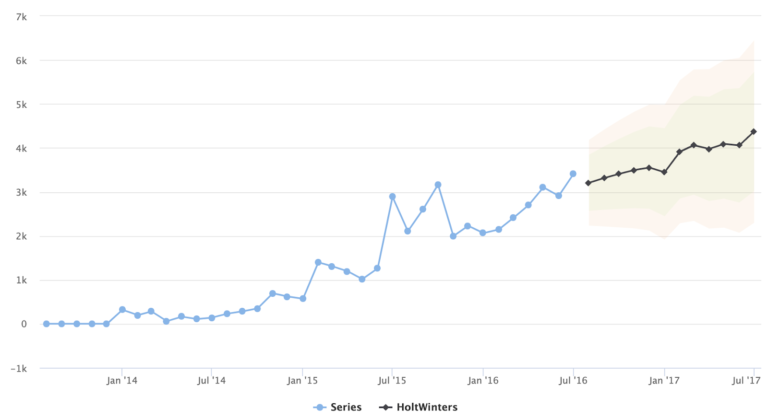
1. The Holt-Winters Method
Even though this is an exponential smoothing method, the Holt-Winters method has a serious advantage in that it take into account trends in a series of data as well as the idea of seasonality.
It can, therefore, create realistic projections based on data specific to a website for which we want to establish a prediction.
To use this method, you will need to download:
That’s right: we’re going to use the language R to create a projection (but you don’t need to be an expert in R to do this exercise).
Next, you’ll need to open R Studio and download the following libraries using this command, but replacing LIBRARY_NAME for each of the three libraries below:
install.packages("LIBRARY_NAME")- Highcharter: To create data visualizations.
- GoogleAnalyticsR: To obtain the required data from Google Analytics.
- Forecast: To create the projection.
Finally, you will need to note the ID of the Google Analytics view that you want to use to obtain the data for organic sessions.
Now, back in R Studio, you can copy and paste the following code and execute it after replacing the placeholders with your own data for the Google Analytics view ID and for the dates to be analyzed.
This will produce the visualization of the projection we’ve been waiting for!
# Load up the libraries we need
library(highcharter)
library(googleAnalyticsR)
library(forecast)

# Set the view ID that we'll be using.
view_id <- XYZABC

# Authorize Google Analytics
ga_auth()

# Get the data from Google Analytics
gadata <- google_analytics_4(view_id,
date_range = c("YYYY-MM-DD", "YYYY-MM-DD"),
metrics = "sessions",
dimensions = c("yearMonth"),
max = -1)

# Convert the data to be officially "time-series" data
ga_ts <- ts(gadata$sessions, start = c(YYYY,MM), end = c(YYYY,MM), frequency = 12)

# Compute the Holt-Winters filtering for the data
forecast1 <- HoltWinters(ga_ts)

# Generate a forecast for next 12 months of organic sessions
hchart(forecast(forecast1, h = 12))
Give yourself a pat on the back! You’ve generated a prediction of organic traffic for the next 12 months!
2. The CTR Method Using Search Console
This second method has more of a short-term approach in its analysis since it does not allow you to smooth the projection over the next 12 months.
Nevertheless, it has the advantage of targeting specific pages based on additional, custom criteria – for example, an importance score that you assign to them.
We’re going to use OnCrawl, SEMrush and Search Console in this example, but this exercise can be done with any crawler that can connect to other data sources and any tool that provides keyword data.
In our example, we’ll be looking at the visualization of data based on our keywords (excluding the brand name). We could also apply a narrower segmentation in order to concentrate, for example, on a particular group of pages.
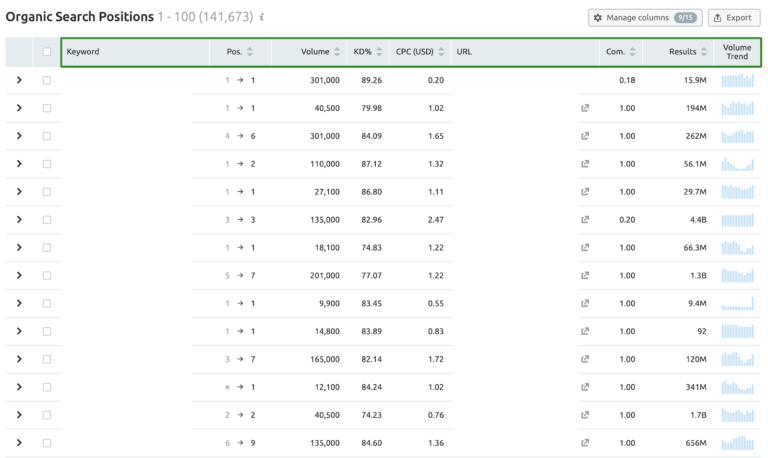
Before we start, we’ll need to export data related to organic search from SEMrush for the website we’re analyzing:
- URL
- Keyword
- Current position
- Volume of monthly searches
- Keyword difficulty
- Estimated CPC
- Level of competition
- Number of results in Google
- Monthly search trends (you will then need to attribute a calendar month to each of these values when you open the export in a spreadsheet editor such as Excel or LibreOffice).
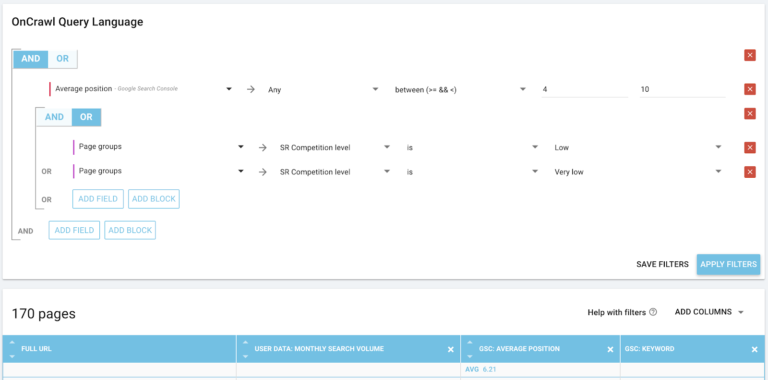
Once linked to URLs, these data will be correlated with crawl and Search Console data in order to create the following visualization.
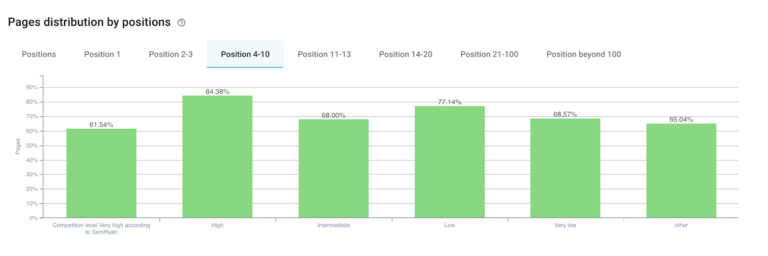
Here, the objective is to analyze pages that are ranked on Page 1 of the search results, between positions 4 and 10, and for which the competition is low, or very low.
We’ll assume for now that this KPI is a factor for the success of our optimization actions. Alternatively, we could also choose to use the keyword difficulty as our underlying KPI.
In this example, we have 27 pages ranked between positions 4 and 10 and for which the level of competition is low, and 120 pages for which the level of competition is very low.
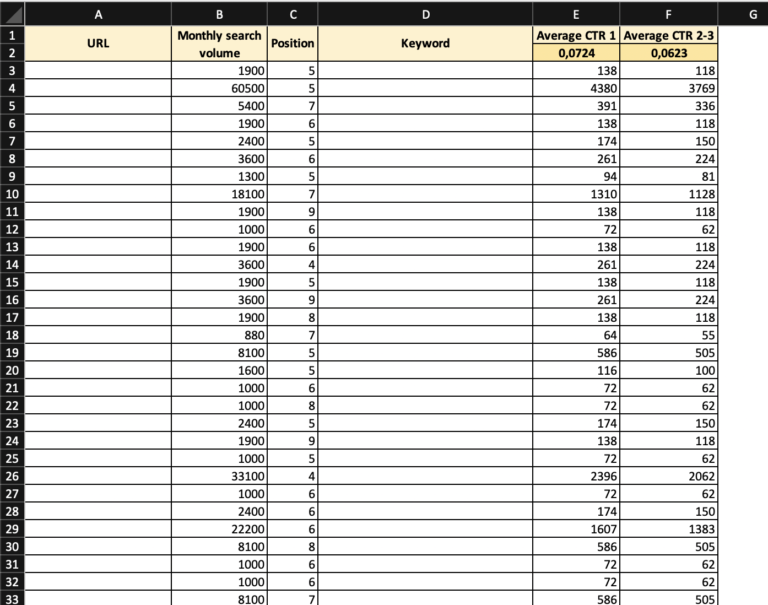
Now, with the help of the following table created from a cross-analysis of Search Console and crawl data, we can create a projection based on the current average CTR of pages ranked in the top 3 positions in the search results.
We could also create both positive and negative projections, based on the pages whose CTR is higher or lower than the average CTR for the entire site.
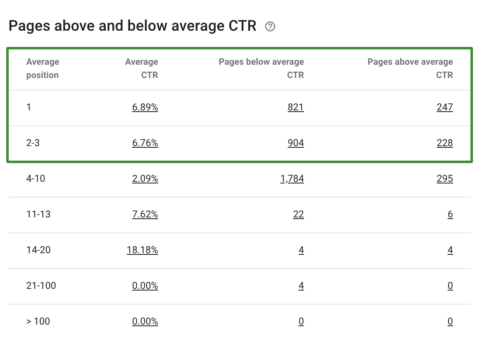
Using the details for the 147 pages we found earlier, follow these steps:
- Export the following data from the crawler to Excel: position, keyword, page, level of competition.
- Also include the monthly search volume per keyword or by the average of all of the searches associated with the page.
- In Excel, per page, multiply the CTR by the average search volume (global page volume or the volume for the targeted keyword per page) in order to define your potential acquisition in organic traffic. In the example below, columns E and F correspond to the potential monthly traffic based on the average CTR by respective average SERP position.
Conclusion
You’ve just created two different types of projections predicting organic traffic on a website.
Note that it is possible to create different projections based on additional data concerning competitor websites (for example, the presence or absence of structured data on ranking pages, etc.).
More Resources:
Image Credits
All screenshots taken by author, June 2019