Chart of the Day: 2017 Deliverability Benchmark Report
The dreaded word
With Halloween on its way, you naturally start thinking about all things spooky. Things like clowns, vampires or toddlers who won’t go to sleep.
For email marketers, there is something far scarier that strikes fear deep in our hearts … poor deliverability.

Calm down my little email geeks. Finding out your inbox placement is a good thing. Once you find out your own, you can start strategizing how to improve it. And the chart below can let you know if you are within your industry benchmarks.
How does email get into the inbox?
“Email that is deemed malicious or untrustworthy is often blocked at the gateway, never reaching either the inbox or the spam folder. For messages that make it past the gateway, spam filters look at the reputation of the sender, subscriber engagement, and content to decide if they should be placed in the inbox or the spam folder for each subscriber. Emails that make it past both gateway and spam filters are the only ones that reach the inbox.”
~ Return Path 2017 Deliverability Benchmark Report
Best and worst of inbox placements
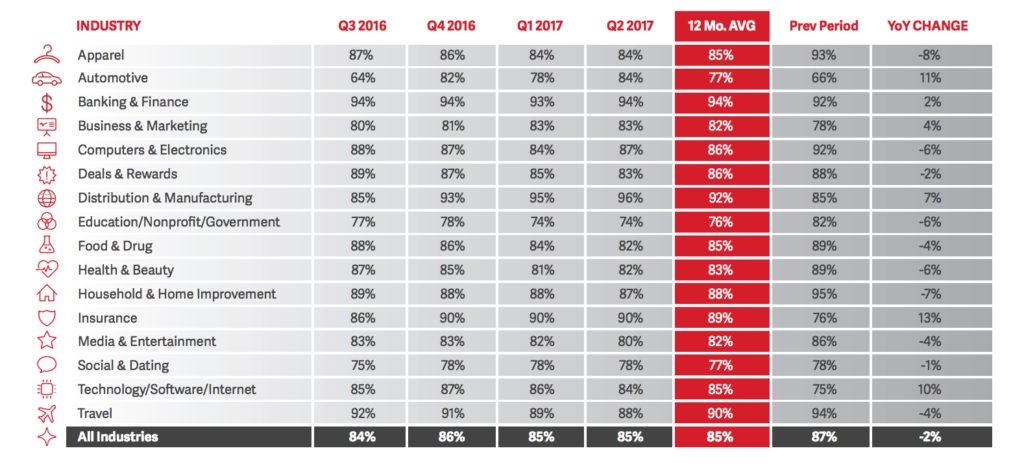
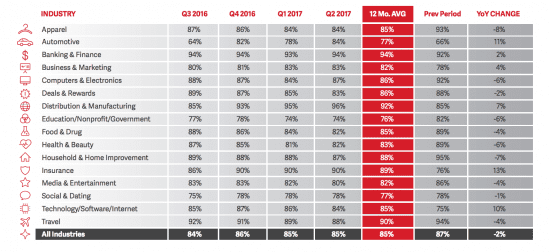
In the chart, we can see the best performers in previous 12 months are banking and finance at 94%. While the lowest performing is education/nonprofit/government at 76%.
The overall average across all industries is 85%.
Final thought
This Halloween, my little email geeks, don’t fear deliverability – create a strategy for it. Be brave!