
Have you ever presented results from a marketing campaign and been asked “But are these results statistically significant?” If you were feeling snarky, you might have responded “Well, the results are different from what we saw before. Isn’t that significant?”
All kidding aside, as data-driven marketers, we’re not only asked to measure the results of our marketing campaigns, but also to demonstrate the validity of the data.
Just recently, I had a call with a customer asking that exact thing. The two marketers had each created a version of a landing page and used HubSpot’s A/B testing functionality to collect the results. They had a friendly wager over which one would win.
After a few days, they had the results; one had a slightly higher conversion rate, but they were left wondering if the results were statistically significant. (I’m going to guess that it was the person with the lower conversion rate that asked this question.) I love a little friendly competition — my family still tells the story about how I challenged my brother to an apple-peeling contest just to “make things interesting” one Thanksgiving. Needless to say, I was happy to help settle this bet.
While there are a number of free tools out there to calculate statistical significance for you (HubSpot even has one here), in order to truly understand what these tools are telling you, it’s helpful to understand what they’re calculating and what it means. We’ll geek out on the numbers using a specific example below to help you understand statistical significance.
How to Calculate Statistical Significance
- Determine what you’d like to test.
- Determine your hypothesis.
- Start collecting data.
- Calculate Chi-Squared results.
- Calculate your expected results.
- See how your results differ from what you expected.
- Find your sum.
1. Determine what you’d like to test.
First, decide what you’d like to test. This could be comparing conversion rates on two landing pages with different images, click-through rates on emails with different subject lines, or conversion rates on different call-to-action buttons at the end of a blog post. The number of choices are endless.
My advice would be to keep it simple; pick a piece of content that you want to create two different variations of and decide what your goal is — a better conversion rate or more views are good places to start.
You can certainly test additional variations or even create a multivariate test, but for the purpose of this example, we’ll stick to two variations of a landing page with the goal being increasing conversion rates. If you’d like to learn more about A/B testing and multivariate tests, check out “The Critical Difference Between A/B and Multivariate Tests.”
2. Determine your hypothesis.
Before I start collecting data, I find it helpful to state my hypothesis at the beginning of the test and determine the degree of confidence I want to test. Since I’m testing out a landing page and want to see if one performs better, my hypothesis is that there is a relationship between the landing page the visitors receive and their conversion rate.
3. Start collecting your data.
Now that you’ve determined what you’d like to test, it’s time to start collecting your data. Since you’re likely running this test to determine what piece of content is best to use in the future, you’ll want to pull a sample size. For a landing page, that might mean picking a set amount of time to run your test (e.g. make your page live for 3 days).
For something like an email, you might pick a random sample of your list to randomly send variations of your emails to. Determining the right sample size can be tricky, and the right sample size will vary between each test. As a general rule of thumb, you want the expected value for each variation to be greater than 5. (We’ll cover expected values further down.)
4. Calculate Chi-Squared results
There are a number of different statistical tests that you can run to measure significance based on your data. Determining which is the best one to use depends on what you’re trying to test and what type of data you’re collecting. In most cases, you’ll use a Chi-Squared test since the data is discrete.
Discrete is a fancy way of saying that there are a finite number of results that can be produced. For example, a visitor will either convert or not convert; there aren’t varying degrees of conversion for a single visitor.
You can test based on varying degrees of confidence (sometimes referred to as the alpha of the test). If you want the requirement for reaching statistical significance to be high, the lower your alpha will be. You may have seen statistical significance reported in terms of confidence.
For example, “The results are statistically significant with 95% confidence.” In this scenario, the alpha was .05 (confidence is calculated as 1 minus the alpha), meaning that there’s a one in 20 chance of making an error in the stated relationship.
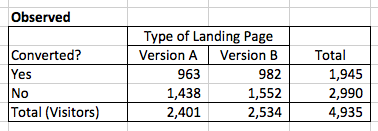
After I’ve collected the data, I put it in a chart to make it easy to organize. Since I’m testing out 2 different variations (A and B) and there are 2 possible outcomes (converted, did not convert), I’ll have a 2×2 chart. I’ll total each column and row so I can easily see the results in aggregate.
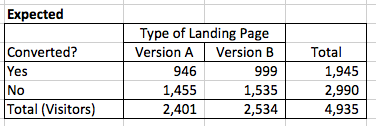
5. Calculate your expected values.
Now, I’ll calculate what the expected values are. In the example above, if there was no relationship between what landing page visitors saw and their conversion rate, we would expect to see the same conversion rates with both version A and version B. From the totals, we can see that 1,945 people converted out of the 4,935 total visitors, or roughly 39% of visitors.
To calculate the expected frequencies for each version of the landing page assuming there’s no difference, we can multiply the row total for that cell by the column total for that cell, and divide it by the total number of visitors. In this example, to find the expected value of conversion on version A, I would use the following equation: (1945*2401)/4935 = 946
6. See how your results differ from what you expected.
To calculate Chi-Square, I compare the observed frequencies to the expected frequencies. This comparison is done by subtracting the observed from the expected, squaring the result, and then dividing it by the value of the expected frequency.
Essentially, I’m trying to see how different my actual results are from what we might expect. Squaring the difference amplifies the effects of the difference, and dividing by what’s expected normalizes the results. The equation looks like this: (expected – observed)^2)/expected
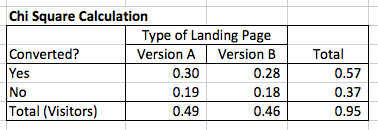
7. Find your sum.
I then sum the four results to get my Chi-Square number. In this case, it’s .95. To see whether or not the conversion rates for my landing pages are different with statistical significance, I compare this with the value from a Chi-Squared distribution table based on my alpha (in this case, .05) and the degrees of freedom.
Degrees of freedom is based on how many variables you have. With a 2×2 table like in this example, the degrees of freedom is 1.
In this case, the Chi-Square value would need to be equal or exceed 3.84 for the results to be statistically significant. Since .95 is less than 3.84, my results are not statistically different. This means that there is not a relationship between what version of landing page a visitor receives and conversion rate with statistical significance.
Why Statistical Significance Is Significant
You may be asking yourself why this is important if you can just use a free tool to run the calculation. Understanding how statistical significance is calculated can help you determine how to best test results from your own experiments.
Many tools use a 95% confidence rate, but for your experiments, it might make sense to use a lower confidence rate if you don’t need the test to be as stringent.
Understanding the underlying calculations also helps you explain why your results might be significant to people who aren’t already familiar with statistics.
If you’d like to download the spreadsheet I used in this example so you can see the calculations on your own, click here.
Editor’s Note: This blog post was originally published in April 2013, but was updated in January 2020 for freshness and comprehensiveness.