Looking to grow your presence on YouTube?
The key to making it happen isn’t hoping for a “viral” video or somehow gaming the algorithm.
Building a successful YouTube channel starts by better understanding your audience, and that’s where your YouTube Analytics come into play.
In fact, YouTube’s robust analytics platform clues you in on exactly what you need to optimize your video strategy.
More views. More shares. You name it.
From what’s keeping people glued to your videos to your top-performing content, your YouTube Analytics represent a goldmine of valuable information. While YouTube’s numerous metrics might seem a bit overwhelming at a glance, we’re going to break them down for you in plain English.
YouTube Analytics: General Reports
To access your analytics, visit YouTube.com/Analytics or select the “Analytics” drop-down in the “Creator Studio” tab of your account.
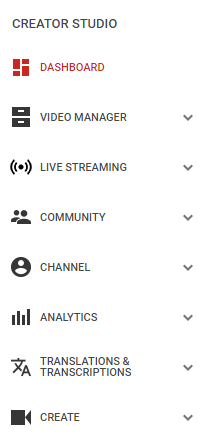
At a glance, you’ll notice the following report options are available:
- Overview
- Realtime
- Earnings
- Watch Time
- Engagement
Now, let’s briefly break each of these down one-by-one:
The Overview Report
The Overview Report is a high-level summary of your content’s most recent performance on YouTube. Think of it as YouTube’s version of the Google Analytics homepage.
This is a key section for businesses because the report provides you with the demographic data for your audience. This data is critical to ensure your target audience is being reached. Geography is particularly important, especially for local businesses, as roughly four out of five YouTube views will come from other countries besides the US.
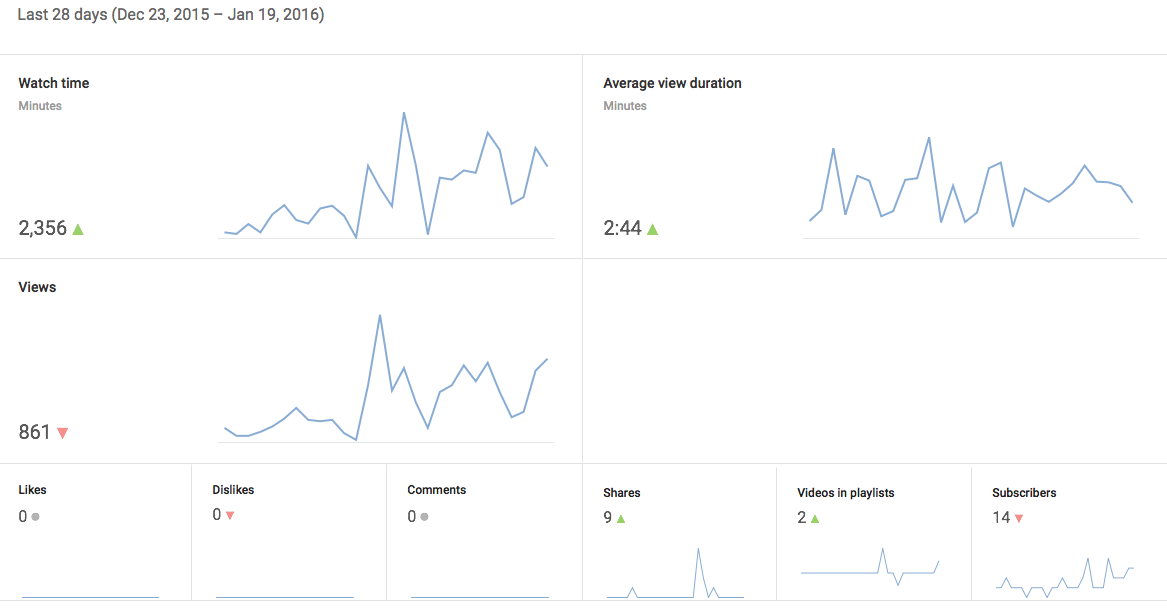
Simple and easy to understand at a glance, the Overview Report quickly tells whether or not your numbers are up or down. YouTube provides an in-depth, drilled down report on the engagement metrics highlighted here such as watch time and views, so think of it as a glimpse at your overall performance. This is the perfect report for when you don’t have time to get “into the weeds” of your YouTube Analytics.
The Realtime Report
YouTube’s Realtime Report shows you an estimate of view data for your last 25 videos. If you’re pushing out video content on a frequent basis, this report is invaluable as you spot trends in your video content marketing strategy.
For example, you might realize that you’re not conducting enough cross-promotion if your views are underperforming. Given that video content overwhelmingly represents the most shared content on social media at large, don’t neglect video as part of your social calendar.
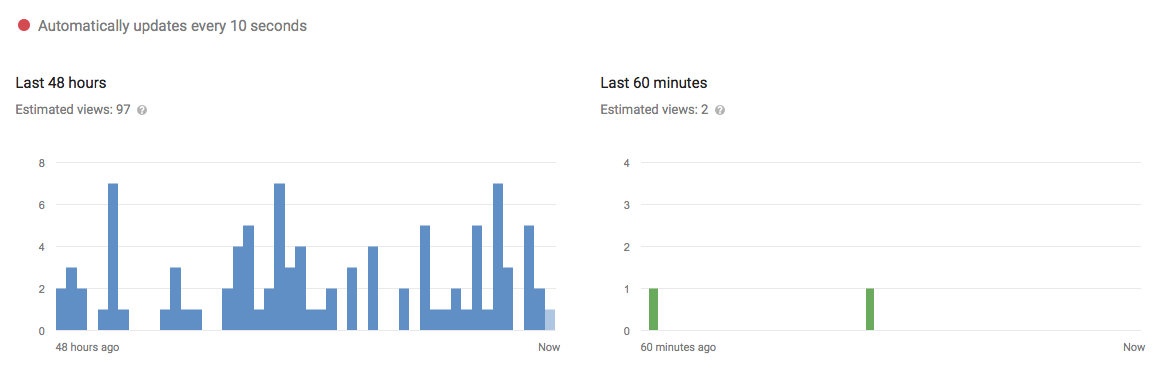
The Realtime Report displays two graphs: one hour-by-hour and the other minute-by-minute. The first is available for a sliding window of two days, while the latter is available for a sliding window of one hour. Both graphs refer to the local time zone of the viewer.
YouTube Analytics: Earnings Reports
Despite YouTube’s recent “Adpocalypse,” businesses posting relevant, ad-friendly content should still keep an eye on their earnings.
If you’re a YouTube Partner with an associated AdSense account, you’ll have access to a couple additional reports on how much you’re bringing in.
The Estimated Earnings Report
The Estimated Earnings Report details earnings related to partner content, transactions, YouTube Red and ads. Some noteworthy metrics within the report include:
- Ad Earnings: The total estimated earnings (net revenue) from all Google-sold advertising sources for the selected date range and region.
- Earnings: The total estimated earnings (net revenue) from all Google-sold advertising sources as well as from non-advertising sources for the selected date range and region.
- Red Partner Revenue: The total estimated revenue earned from YouTube Red subscriptions for the selected report dimensions. It reflects earnings from both music and non-music content.
YouTube notes that estimated revenue in YouTube Analytics may not be identical to finalized payments due to final adjustments during the payout period.
The Ad Rates Report
The Ad Rates Report determines how different ad types are performing over time compared to one another. A few noteworthy metrics within the report include:
- Ad Type: The format of the ad in question and its buying platform.
- Ad Impressions: The number of verified ad impressions served.
- Monetized Playbacks: The number of instances when a viewer played your video and was shown at least one ad impression. A monetized playback is counted if a viewer is shown a pre-roll ad but quits watching the ad before your video ever starts.
- Playback-based CPM: The estimated gross revenue per thousand playbacks.
YouTube Analytics: Watch Time Reports
This is perhaps the most relevant and important report for creators interested in YouTube optimization. If viewers are eating up your content with high watch times and retention, you know you’re on the right track. Although these metrics aren’t the end-all, be-all of your YouTube Analytics, they’re vital for fine-tuning your video strategy.
The Watch Time Report
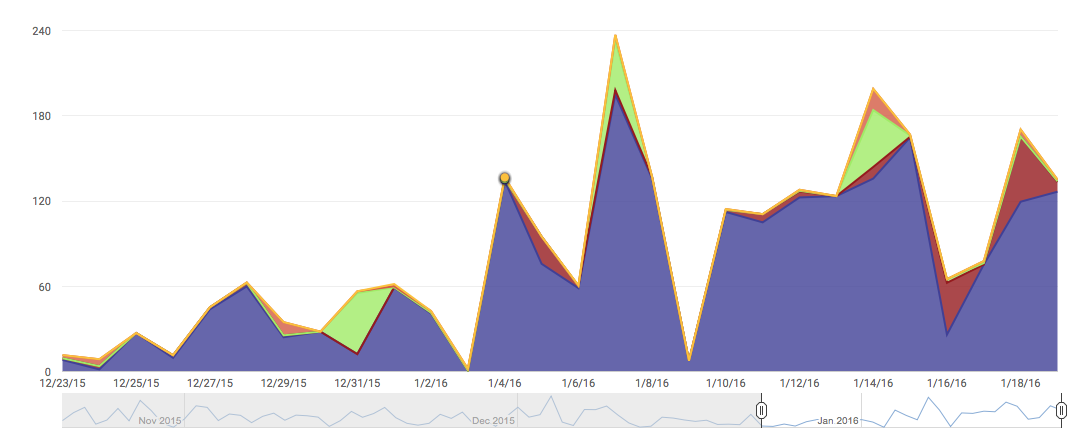
The Watch Time Report aggregates data from all view sources to create a comprehensive look at how long people are watching your videos. These sources include the YouTube homepage, the platform’s embedded player and the mobile YouTube app.
You can use the tabs under the graph to filter the data by content type, geography, date, subscription status, YouTube product and subtitles.
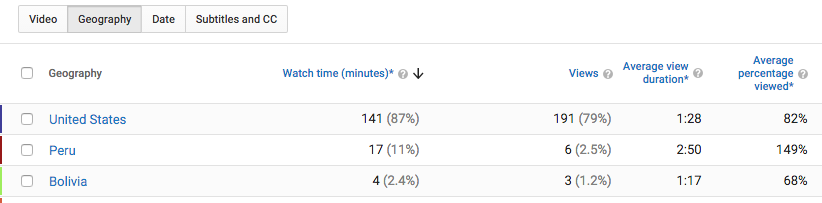
You can also see or compare data for specific videos, see data by type of viewer or location and view by most-watched date. Some noteworthy watch time metrics include:
- Average View Percentage: The average percentage of a video watched during a video playback.
- Average View Duration: The average length, in seconds, of video playback.
- Estimated Minutes Watched: The number of minutes users watched videos for the specified channel, content owner, video or playlist.
- Uniques: The number of unique viewers that watched a video. This is calculated based on the number of unique cookies and will over-count users who are using multiple devices or browsers.
- Viewer Percentage: The percentage of viewers who were logged in while watching the video or playlist.
- Views: The number of legitimate views for your channels or videos.
- Watch Time: The amount of time that a viewer has watched a video.
The Audience Retention Report
The Audience Retention Report helps you understand whether or not your viewers are sticking to your videos. Based on these metrics and percentages, you can start to look for common threads among your top-performing content. On the flip side, you might spot a correlation between videos with lower retention.
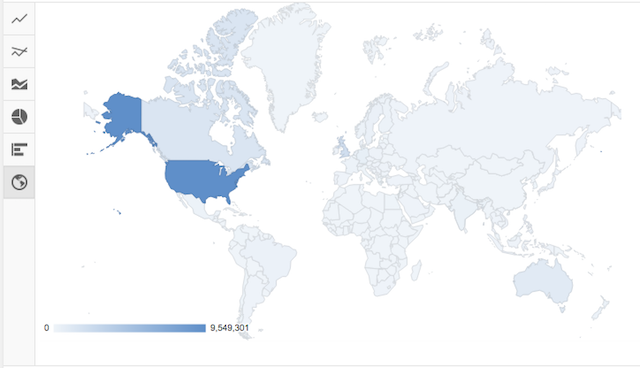
The interactive map that shows where your video has been watched is a nice added bonus of this report. The darker highlighted areas represent your most popular regions.
You can use the Audience Retention report in a couple of different ways.
For starters, the absolute audience retention curve lets you see which parts of the video are most popular. YouTube recommends paying close attention to the first 15 seconds of every video given that’s when most viewers will drop off. You can also use relative audience retention to see how your video compares to YouTube videos of similar length.
Retention further breaks down by organic traffic, traffic for paid skippable video ads and traffic for paid display ads. Some noteworthy metrics for the report include:
- Organic Traffic: Video views that are the direct result of user intention. Traffic is considered organic if a viewer takes an action like searching for a video, clicking on a suggested video or browsing a channel.
- Skippable Video Ad: Views for ads that are auto-played before a video and are skippable after five seconds.
- Display Ads: Views in which the user played the video from a display ad, including ads shown in search results or on other video watch pages.
Retention metrics provide actionable insights on what you can do to improve your YouTube videos. Perhaps they lack that initial “punch” in the first few seconds. Maybe you start off strong and lose viewers half-way. These details are exactly why regularly checking your YouTube Analytics is a must-do.
The Playback Locations Report
The Playback Locations Report is particularly interesting if you work with collaborators or partners. This report shows you where your videos are being played, either natively on YouTube or embedded elsewhere.
For instance, you can see how many views are generated through embedded videos on other websites and on YouTube directly. If it was viewed on YouTube, you can determine whether it was viewed from the video’s specific page or directly on a channel’s page.
Essentially, playback reporting is where users are viewing your videos, while the traffic sources are how people find your content. The noteworthy metrics of this report include:
- YouTube Watch Page: The video was watched on YouTube from the video’s specific page. It’s the exact URL where you can watch the video on YouTube.
- YouTube Channel Page: These are views directly on a channel page. For example, youtube.com/user/SproutSocial.
- YouTube Other: Certain browsers don’t let YouTube detect where on the platform the video was viewed. Most likely these views occurred on the YouTube watch page.
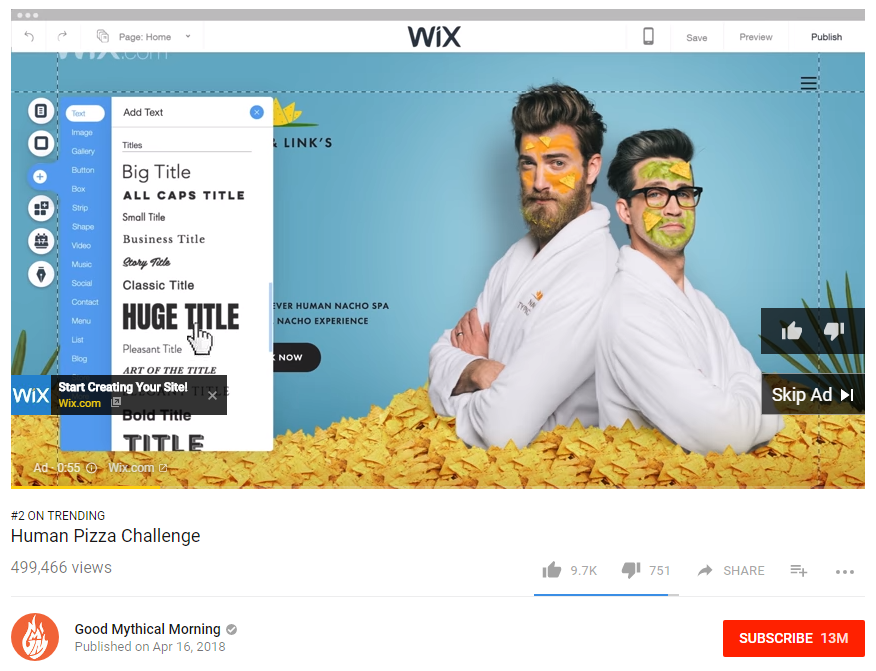
- Embedded in External Websites and Apps: How often viewers watched your video when embedded on another website or app that embeds your videos (see example below).

The Traffic Sources Report
Another key report to keep an eye on is the Traffic Sources Report. It shows the sites and YouTube features that viewers used to find your content.
Understanding whether viewers are searching directly on YouTube, clicking Suggested Videos thumbnails or following links from social networks lets you know if your optimization and promotion strategies are paying off. For example, this report will highlight search terms people used to land on your videos.
The traffic sources highlighted in this report include:
- YouTube search
- Suggested videos
- Browse features
- Playlists
- YouTube channels
- YouTube advertising
- Video cards and annotations
- Notifications
- Other YouTube features
- External sources
- Direct or unknown sources
The Devices Report
Last but not least, you’ll want to add the Devices Report to your list of regularly pulled reports. More than 50% of YouTube traffic comes from mobile devices. This report gives you information on the different devices—including computer, mobile, tablet, game consoles and TVs—and operating systems that viewers used to watch your videos.
This data can better inform both your advertising and outreach strategies. Likewise, it also influences the type of content you’re sharing. If a majority of your views are from mobile devices, you may want to swap those 20-minute tutorials you’re creating for shorter, bite-sized content.
YouTube Analytics: Engagement Reports
Of course, views aren’t everything when it comes to video performance. YouTube Analytics delves into various engagement metric reporting include:
- Likes
- Dislikes
- Comments
- Subscriptions
- Sharing
These metrics are prioritized based on the types of content you’re creating.
For example, a tutorial video might be used as a customer support tool where back-and-forth comments are encouraged. Meanwhile, a video published primarily for entertainment purposes will look to rack up likes and shares.
The Subscribers Report
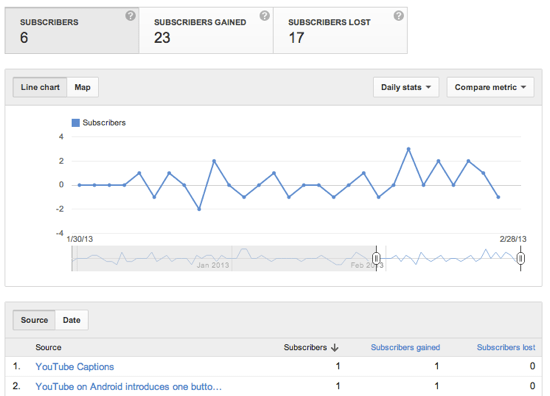
Hey, we’re all obsessed with our follower counts, right? The Subscribers Report is YouTube’s equivalent, outlining how you’ve gained and lost subscribers across different pieces of content, locations and dates.
In short, this report quite literally tells you which content is scoring subscribers and where they’re coming from. On the flip side, you can also see where you lost subscribers as well.
The Likes & Dislikes Report
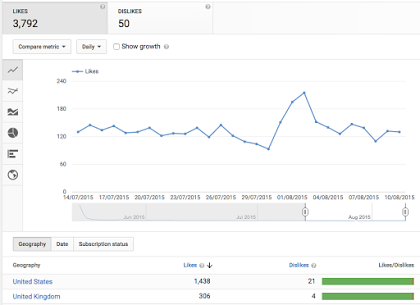
This report is fairly self-explanatory but it’s worth highlighting. The Likes and Dislikes report shows the net change of likes and dislikes in your videos. It adds up the number of likes and dislikes minus the number of likes and dislikes removed.
Your approach to engagement on YouTube should be a holistic one: if you’re not getting a high number of likes, don’t freak out. After all, viewers might be sharing or commenting more than they’re liking.
However, you should be concerned if your videos start netting dislikes out of the blue. Occasional dislikes from trolls and potential competitors might happen, but if you aren’t baiting people you shouldn’t expect a flood of hate for no reason.
The Videos in Playlists Report
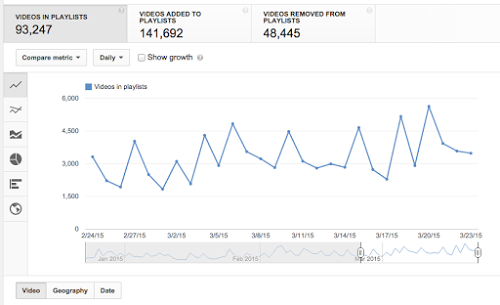
The Videos in Playlists Report replaced the former “Favorites report,” which used to tell you how many times viewers marked your video as a favorite and how many removed it from their favorites.
The new report shows you how many times your videos were added to or removed from viewers’ playlists. This includes default playlists, like “Watch Later” or “Favorites,” as well as any custom playlist.
Knowing which playlists your videos are included in is a nice added bonus. For example, if you notice that your long-form tutorial videos are frequently being queued up by others, perhaps it’s time to create even more.
Additionally, knowing how much time viewers spend in one of your own playlists lets you know how successful it. You can use that information moving forward with new playlists.
Some noteworthy metrics in this report include:
- Average Time in Playlist: The estimated average amount of time, in minutes, that a user viewed videos in a playlist after the playlist was initiated. This only includes playlist views that occur on the web.
- Playlists Starts: The number of times that viewers initiated playback of a playlist. This only includes playlist views that occur on the web.
- Videos Added to Playlists: The number of times videos were added to any YouTube playlists, including the video owner’s playlists or other channels’ playlists.
- Videos Removed From Playlists: The number of times videos were removed from any YouTube playlists.
- Views Per Playlist Start: The average number of video views that occurred each time a playlist was initiated. This only includes playlist views that occur on the web.
The Comments Report
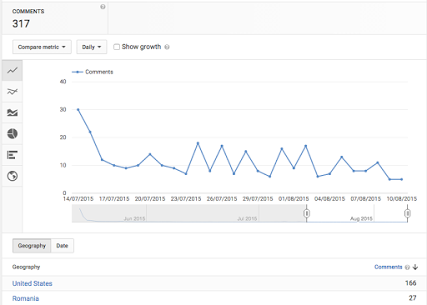
Simply put, the Comments Report summarizes how many people comment on your video.
Just like social comments, the YouTube comment sections represents a place to go back-and-forth with your audience. It’s also somewhere to gain unfiltered insight into how people feel about your content.

If people are showing you love in the comment section, make sure you respond accordingly. Remember that response time is critical, especially for customer support and tutorial videos.
The Sharing Report
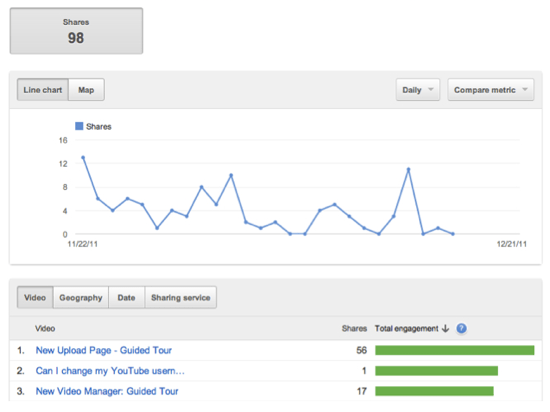
The Sharing Report shows how many times your content has been shared through the “Share” button on YouTube, as well as other sites like Facebook or Twitter.
Sharing is obviously a key component of promotion, especially if you’re publishing content such as product-centric videos or breaking news. If you’re actively scheduling and promoting your YouTube content across your social channels, this report is definitely one to watch.
The Cards Report
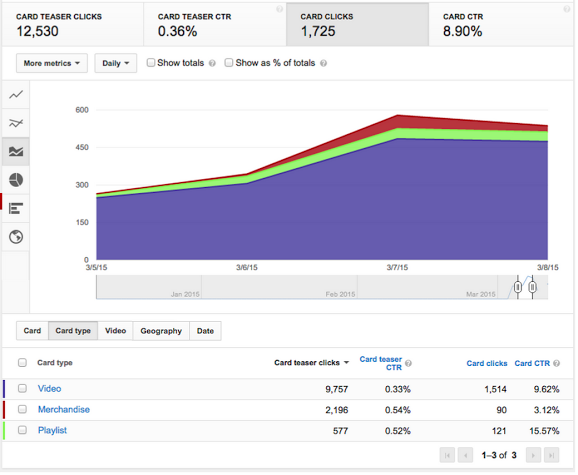
Despite popular belief, videos don’t need to be a totally passive experience for viewers.
Serving as an alternative to now-discontinued Annotations, marketers can make their YouTube videos more interactive through the use of Cards. Depending on the Card type, you can add in either an image, title or call-to-action.
The Cards Report shows you how viewers are interacting with cards on your videos across desktop, mobile and tablets. Notable metrics for this report include:
- Card Clicks: The number of times that cards were clicked.
- Card Click Rate: The clickthrough rate for cards, which is calculated as the ratio of card clicks to card impressions.
- Card Impressions: The number of times cards were displayed. When the card panel is opened, a card impression is logged for each of the video’s cards.
- Card Teaser Click Rate: The clickthrough rate for card teasers, which is calculated as the ratio of clicks on card teasers to the total number of card teaser impressions.
- Card Teaser Clicks: The number of clicks on card teasers. Card icon clicks are attributed to the last teaser displayed to the user.
- Card Teaser Impressions: The number of times that card teasers were displayed. A video view can generate multiple teaser impressions.
What Can You Learn from Your YouTube Analytics?
Overwhelmed by your YouTube Analytics? Don’t be.
Breaking down your numbers is crucial not only for improving your current content but figuring out what to create in the future.
Which pieces of content are causing people to bounce? How are viewers finding you? What makes your most popular content so popular, anyhow?
Whether it’s a quick fix or an overhaul of your long-term video strategy, you need to get knee-deep in your analytics if you want these answers.
We want to hear from you, though. What do you consider to be your most important metrics in YouTube Analytics? Watch time? Retention? Let us know in the comments below!