Stories disappear after 24 hours. But with a solid understanding of Instagram Stories analytics, you can ensure they have lasting impact.
For brands, the potential impact of Instagram Stories is proven. One third of the most viewed Stories are from businesses. More importantly, 39% of people say Instagram Stories have led them to become more interested in a brand or product.
With top of the feed placement, Swipe Up capability, and interactive stickers, Instagram Stories are a prime channel for brands to drive awareness, traffic, sales, and engagement.
Learn how to measure Instagram Stories analytics and which metrics to track so you can optimize Stories to achieve your goals.
Need a primer on how to use Instagram Stories? Start here.
Download your free pack of 20 customizable Instagram Stories templates now. Save time and look professional while promoting your brand in style.
How to view your Instagram Stories analytics
There are a few ways to check analytics for Instagram Stories. We break them down below. But first, make sure you have a business or Creator account. Without one, you won’t have access to analytics.
How to view Instagram Stories analytics
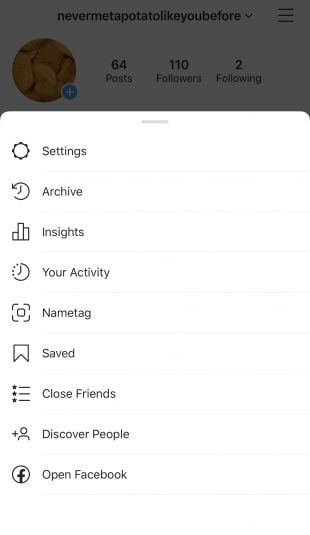
- From the Instagram app, go to your profile.
- Tap the menu icon in the upper right corner.
- Tap Insights.
Source: @nevermetapotatolikeyoubefore
- Scroll down to Stories.
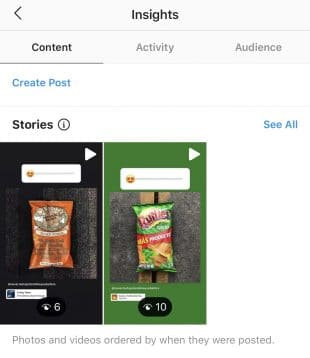
Source: @nevermetapotatolikeyoubefore
- Select See All to see the Stories posted over the past 14 days.
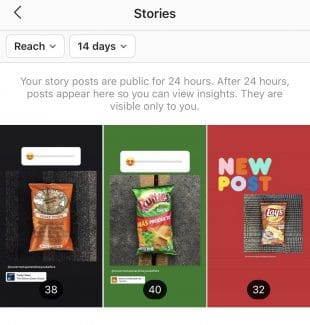
Source: @nevermetapotatolikeyoubefore
- Select an interaction, such as Reach or Follows, for an overview of how many actions were taken across your Stories.
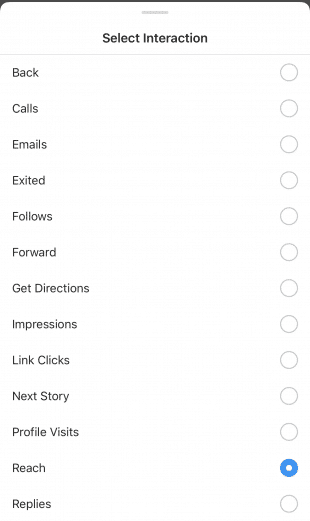
Source: @nevermetapotatolikeyoubefore
- Click on an individual story and swipe up to see its analytics.
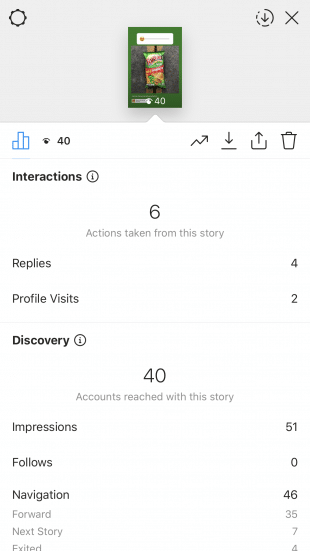
Source: @nevermetapotatolikeyoubefore
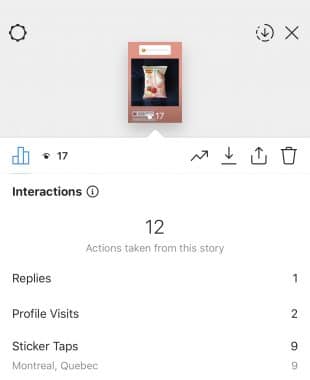
- To see the results of a poll or other sticker actions, click the eye icon beside the insights icon (it looks like a bar chart).

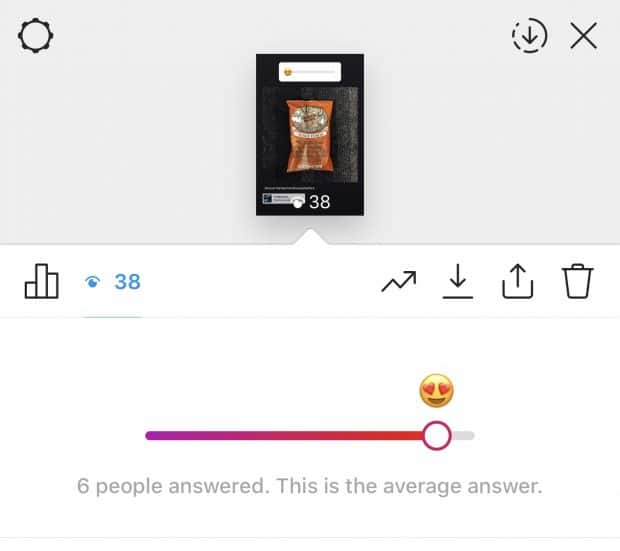
Source: @nevermetapotatolikeyoubefore
How to view Instagram Story Insights in Creator Studio
If you run a business or Creator account, you can also check Instagram Story analytics in Creator Studio. This option is helpful for those who prefer desktop. But the major advantage of Creator Studio is that it records all-time Instagram Story analytics. So you don’t have to worry about the 14-day window.
- Go to Creator Studio. If you haven’t done so yet, add your Instagram account by clicking the Instagram logo in the centre of the header.
![]()
- Click Content Library. Then select the Stories tab. Sort by post status and time frame.
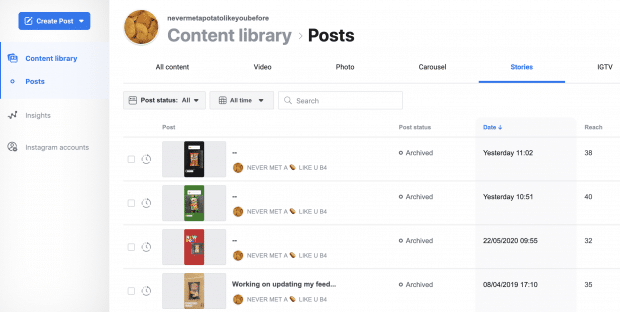
Source: Creator Studio
Tip: From this dashboard, you can track post status, when it was posted, and its total reach. This overview is a good place to spot under and over-performing Stories.
- Click on a story to see more details. If you ran a poll or used a related sticker, you won’t see response details here. Only basic Interaction and Discovery metrics are viewable.
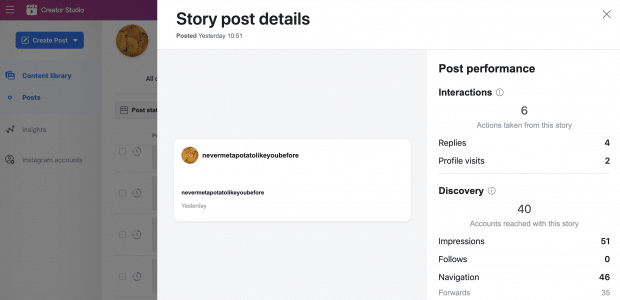
Source: Creator Studio
How to view analytics for Instagram Stories in Commerce Manager
Businesses that use Instagram Checkout can also track analytics for shoppable Instagram Stories in Commerce Manager. Right now e-commerce features are only available to select accounts.
- In Commerce Manager, click Insights from the left-hand menu.
- From this tab, download a detailed CSV spreadsheet with insights on your shoppable Instagram Stories.
In addition to standard Instagram Story analytics, you can track Product Page Views and related metrics. Many of these commerce insights are in development—so expect more details to roll out soon, especially with Instagram’s launch of shops.
Learn how to set up Instagram Shopping to sell more products.
Understanding Instagram Stories analytics
Instagram Stories Insights are split into three categories: Discovery, Navigation, Interactions.
Discovery
- Reach: The amount of accounts that saw your story. This figure is an estimate.
- Impressions: The total number of times your story was viewed (including repeat views).
Why discovery stats matter: People use Instagram to discover brands. And 62% of people surveyed by Facebook say they’re more interested in a brand or product after seeing it in Stories.
Compare reach and impression numbers to your follower count to gauge how much of your audience is watching your Stories.
Tip: Add stickers to boost the discoverability of your Stories. When you use a hashtag or location sticker, your story is more likely to appear in Explore or the sticker’s larger story. If you run a small business, use the Support Small Business, Gift Cards, or Food Orders stickers.
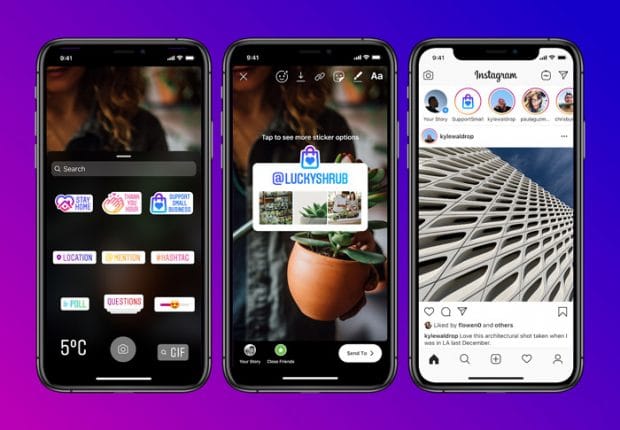
Source: Instagram
Navigation
- Forward Taps: Number of times someone tapped to the next story.
- Back Taps: The amount of times someone tapped back to see the previous story.
- Next Story Swipes: The number of times someone swiped to the next story.
- Exit Story Taps: The number of times someone exited your story.
- Navigation: The overall total of Back, Forward, Next Story, and Exited actions taken with your story.
Why navigation stats matter
Navigation metrics show you what’s working and what isn’t. If a lot of viewers exit or skip to the next story, it’s a good sign your content isn’t capturing attention. Back taps, on the other hand, suggest your story shared content or info people wanted to see twice. This may also be a good one to save to your Instagram Story highlights.
Tip: Keep Stories short and sweet. People aren’t looking for long-form content here. A 2018 study by Facebook IQ found that Story ads performed best at 2.8 seconds per scene.
Interactions
- Profile Visits: The number of times your profile was viewed by someone who viewed your story.
- Replies: The tally of people who responded to your story.
- Follows: Number of accounts that followed you after viewing your story.
- Shares: The number of times your story was shared.
- Website visits: The amount of people who clicked the link in your profile after watching your story.
- Sticker Taps: The number of taps on the location, hashtag, mention or product stickers in your story.
- Calls, Texts, Emails, Get Directions: Tallies the number of people who took one of these actions after viewing your story.
- Product Page Views: Number of views your product pages received via the product tags on your story.
- Product Page Views per Product Tag: The number of views of a product page for each product tag in your story.
- Interactions: The total count of actions people took after viewing your story.
Why interaction stats matter
If your goals include engagement or other actions, interaction stats help you measure your success in achieving them. If your goal is to get more followers, compare Profile Visits with Follows. Did you want your story to drive traffic to your website? Website visits will show you how it fared.
Tip: Stick with one, clear call-to-action that aligns with your goals. Emphasize your CTA with branded stickers, or creative that emphasizes it. Facebook data found that highlighting CTAs drives significantly more conversions for 89% of studies tested.
More things you can measure with Instagram Stories analytics
Here’s how to measure Instagram Stories metrics like sticker taps, engagement rate, and more.
How to measure hashtag and location stickers on Instagram Stories
Instagram story stickers include hashtags, locations, mentions, and product tags. In other words, stickers are basically tags that viewers can tap to see related content. Like tags elsewhere, these stickers can also help a story reach a larger audience.
Sticker taps count as interactions and can be found under Interactions. If you haven’t used any stickers, you won’t see this metric.
Source: @nevermetapotatolikeyoubefore
How to measure engagement on Instagram Stories
Instagram story engagement metrics can be found under interactions. There’s no agreed upon formula for measuring story engagement. But there are a few ways to think about it, depending on your goals.
Compare reach with follower count
Divide story reach by the number of followers you have to gauge what percentage of followers are viewing your Stories. If one of your goals is to engage followers or promote awareness, keep an eye on this.
Total reach / Follower count *100
The average Instagram story view is 5% of your audience, said James Nord, founder of influencer marketing platform Fohr, in an Instagram Live interview with Matthew Kobach, manager of digital and social media for the New York Stock Exchange.
If you think this figure is low, consider promoting your Stories with a post. Here’s an example:
Compare reach with interactions
Divide total interactions by total reach to see the percentage of viewers who took action after seeing your story.
Total interactions / Total reach * 100
Compare reach with a key interaction
Focus on the interaction that best aligns with your goal. If your call-to-action is to Follow Us, divide Follows by reach. This will show you the percentage of viewers who took the action.
Key interaction / Total reach * 100
Pro tip: Remember not to compare apples to oranges. Whatever way you choose to measure engagement, make sure you’re consistent. That way you can make fair comparisons and see what’s really working and what’s not.
How to measure discovery on Instagram Stories
Discovery is tricky to measure on Instagram Stories, since Instagram doesn’t differentiate between accounts that follow you and accounts that don’t.
Reach shows you how many people are watching your Stories. But to drill down on discovery, keep an eye on Profile Visits, Follows, and Website Clicks. These metrics measure viewers who likely weren’t following you, but liked your story enough to check out your profile, hit the follow button, or visit your website. Watch Shares, too. A share is a great way to be discovered, and could drive more follows.
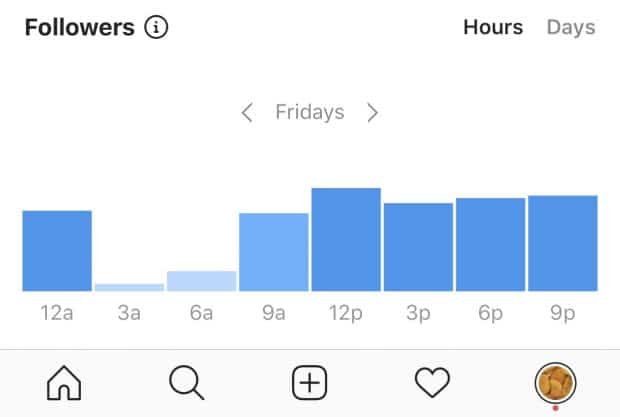
Instagram recently introduced Growth Insights, which allows you to see which Stories and posts earned the most followers. To check these insights, go to the Audience tab in Instagram Insights. Scroll down to Growth where you’ll find a chart that shows you follower changes by day of the week.
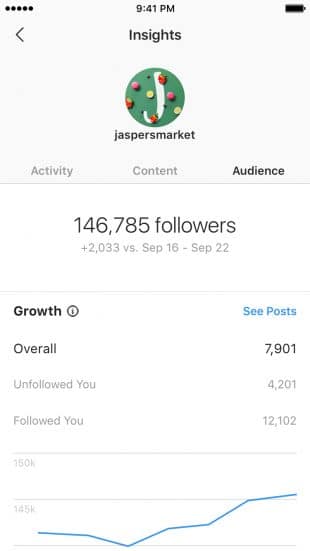
Source: Instagram
Don’t forget your stickers. Check the viewer numbers of other Stories associated with your stickers under Viewers. But act fast: this data is only available for 14 days. Keep track of the stickers that bring the most viewers.
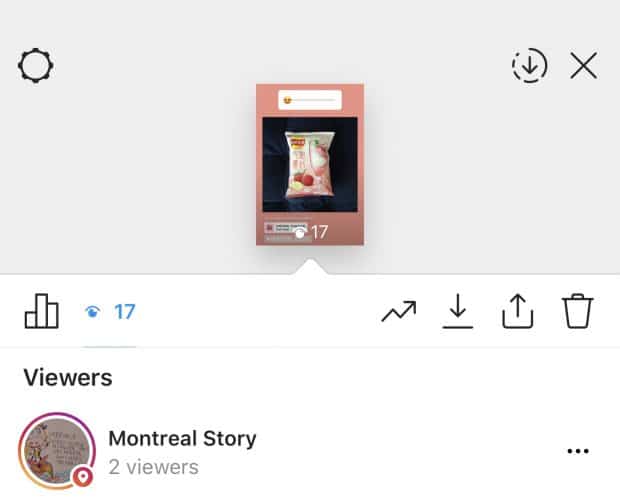
Source: @nevermetapotatolikeyoubefore
How to measure traffic from Instagram Stories
Compared to most social networks, Instagram doesn’t offer a lot of places to refer traffic outside of the app. Brands were stuck with “link in bio” call-to-actions until Instagram rolled out the Swipe Up feature for Stories.
It’s tricky to measure how many people Swipe Up. The best way to do it is to add UTM parameters. These are short codes you add to URLs so you can track website visitors and traffic sources.
Tip: Highlight Stories with links so people can keep swiping outside the 24-hour window.
You can also track Website Visits. This measures how many people visit the link in your bio after seeing your story.
The Swipe Up feature is only available to accounts with 10K+ followers. Here’s how to earn more followers on Instagram if you need help hitting that number.
How to see when your audience is most active
Instagram Stories are only live for 24 hours, unless you add them to your highlights. Post them when your followers are most active to ensure they don’t go unseen.
Follow these steps to see when your audience is online:
- From the Instagram app, open Insights.
- Click on the audience tab. Scroll down to Followers.
- Toggle between hours and days. See if there are any noticeable peaks.
Source: @nevermetapotatolikeyoubefore
These are the best (and worst) times to post on Instagram.
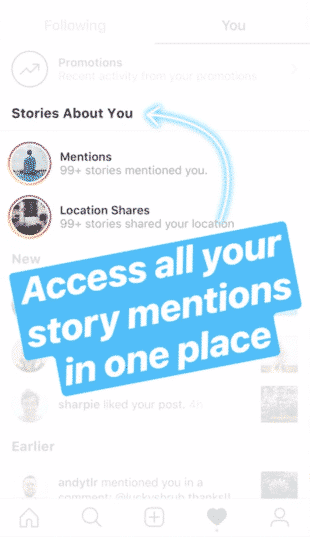
How to track Instagram Stories you are tagged in
Instagram recently made it easier for creator and business accounts to track story mentions.
Now you can see any story that mentions you at the top of the Activity tab. To access Stories About You, tap the heart icon, then Mentions under Stories About You. From there you can look at each post, add them to your own Stories, or simply thank them for the love.
Source: @Instagramforbusiness
This includes when people use the Support Small Businesses sticker. Right now, Stories that use this sticker are added to a larger story that appears at the top of feeds. If you run a small business, be sure to benefit from the added exposure.
How to optimize your strategy based on your Instagram Stories analytics
Here’s how to use Instagram Insights to create great Instagram Stories.
Find what works
Track Instagram insights over time so you can pinpoint top performing posts. If you spot content that outshines other Stories, look for ways to recreate it.
Turn successful ideas into concepts. Run polls or quizzes around different themes or spin a successful tutorial into a recurring series. For example, Culture Hijab posts regular tutorials on different ways to wear hijabs.

Source: @culturehijab
On the flip side, don’t panic if something flops. Stories are an ideal place to experiment and learn. Fortunately, if an idea doesn’t take off, it disappears in a day.
Need some inspiration? Pick up tips from 7 of the best brands on Instagram Stories.
Tailor content for your audience
Audience insights should inform your entire Instagram business strategy, including Stories. Pay attention to age, gender, and location to craft content that is relevant to your followers.
For a financial company like Wealthsimple, age makes the difference between planning a family and planning for retirement. Since its audience skews millennial, the account’s Stories feature references that speak to the age range, from Animal Crossing to Aubrey Plaza.

Source: Wealthsimple
Dig deeper into Instagram Insights with these analytics tools.
Listen to audience feedback
Qualitative data is just as important as quantitative. If you’ve used poll, quiz or question stickers to engage your audience, pay attention to responses.
Use feedback to inspire new products, services or content. And don’t be afraid to ask directly. People like having their voices heard. The LA County Museum of Art recently ran a poll that asked viewers to share what content helps them de-stress. Then it gave the people what they wanted: Cats.
Learn how people prefer to communicate with you
Between stickers, replies, and call buttons, there are lots of ways for followers to get in touch with you. But some options may be preferred over others.
Take a look at Call, Text, and Email metrics to see if one stands out. If you’re getting more emails than calls, adjust your call-to-actions (and support services) accordingly. You might just see more bookings, orders, or inquiries as a result.
It may seem like a minor tweak, but communication methods can be a hang-up for some customers. Sometimes it’s generational. Millennials have been accused of avoiding phone calls. Non-native language speakers may feel more comfortable over email.
me, a millennial, exhausting every possible option in a situation other than making that quick phone call:pic.twitter.com/ZG9168DeFZ
— Joshua PRayStation5 (@joshcarlosjosh) February 24, 2020
Don’t ignore Replies, either. If people are sliding into your DMs, it may be time to organize your Instagram Inbox. Professional accounts have access to two-tab inboxes. Move messages between Primary and General tabs to ensure you get back to people efficiently.
Boost discoverability with the right tags
Stickers are the primary way for your Instagram Stories to be discovered by non-followers.
If your discovery metrics are not where you’d like them to be, think beyond hashtag and location stickers. Shout-out customers by sharing their posts or Stories about your brand. Make sure to tag them so they know and can re-share with their followers. Not only does this improve reach, it’s an opportunity to show appreciation and happy customers in action.
Canadian home decor shop VdeV promotes products and fans by sharing their posts in its Stories.

Source: @vdev_maison
Invite an influencer to takeover your Stories. Make sure you ask them to promote the takeover with their followers. Fenty Beauty runs a Face Friday takeover featuring influencers like Micaéla Verrelien.
Check out these free Instagram story templates (and learn how to use them).

Source: @micaelaverrelien
Save time managing your Instagram presence using Hootsuite. From a single dashboard you can schedule and publish posts directly to Instagram, engage the audience, measure performance, and run all your other social media profiles. Try it free today.
