
With transparency as one of our defining values at Buffer, we’re always seeking opportunities to share more information with the world.
In addition to:
….we’ve also tried to remain open about our financial progress by sharing our revenue metrics with the world. We’ve done this through monthly blog posts, Tweetstorms, and more.
Most recently, we have switched to ChartMogul as our new source of truth for revenue numbers. Now we are excited to debut a new revenue dashboard!
This dashboard contains Buffer’s actual revenue numbers, completely open to all to see how we’ve been doing as a company over time. It will always show the full metrics from the last complete month, and we’ll update it every month.
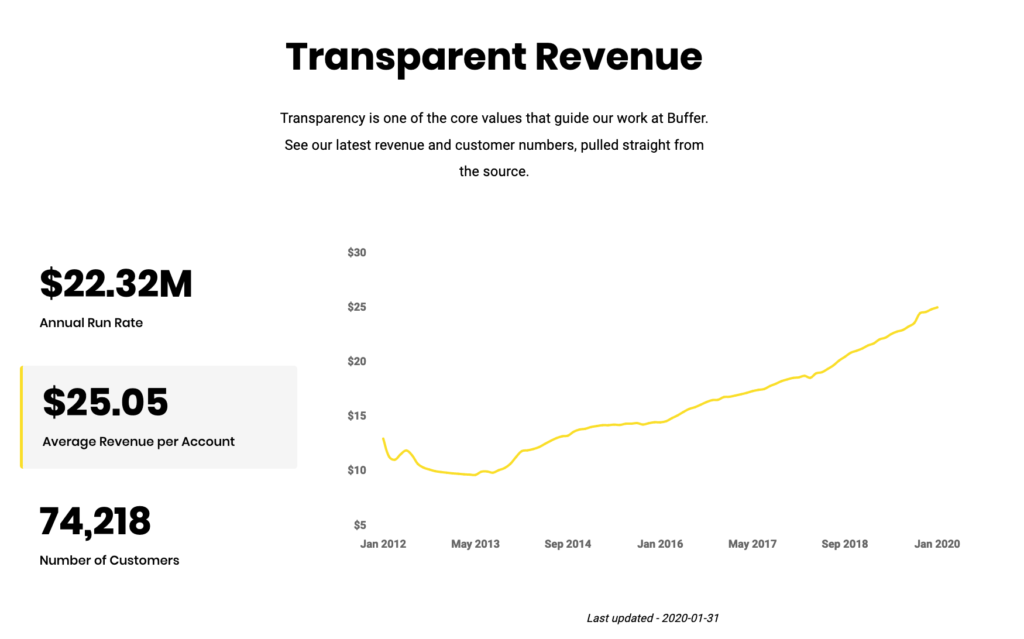
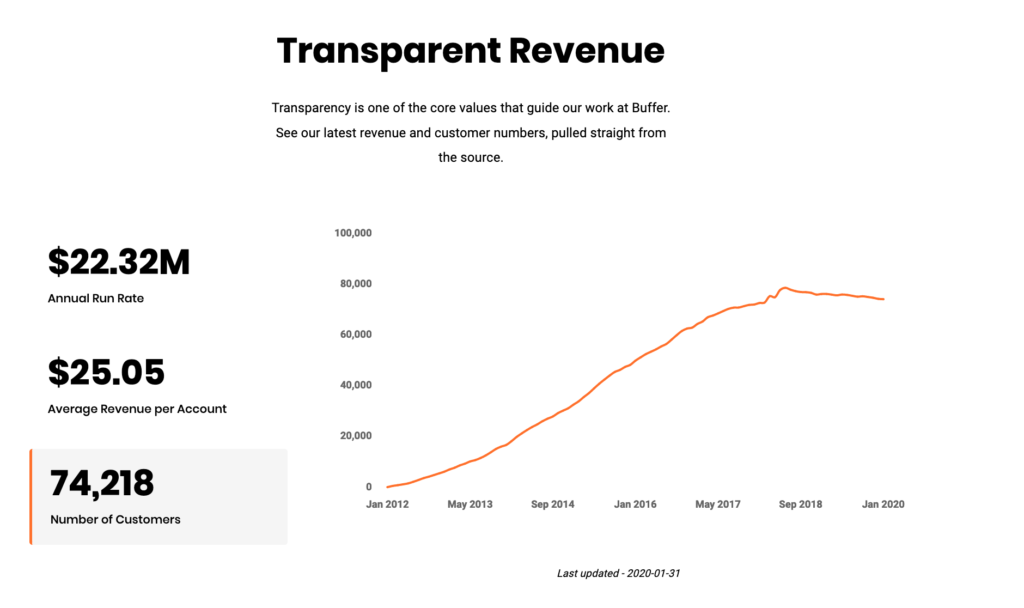
Here’s a bit more about the key metrics you’ll currently find on the dashboard.
Annual Run Rate: A forecasting method for annual earnings that multiplies monthly revenue by 12 to extrapolate an annual figure. (It assumes everything stays exactly as is for the rest of the year – no churn, no new customers and no expansion.) Also know as the yearly version of Monthly Recurring Revenue, or MRR.
Average Revenue Per Account: Also known as average revenue per user, this is calculated by dividing our total monthly revenue by our number of customers
Number of Customers: This is the total of all paying customers of any Buffer product in a given month.
Hover over any moment within the history of Buffer on the dashboard to see more specific numbers for that month.
There’s a lot more we can do and share with this dashboard, so this is just the beginning. We hope this information will be valuable for now for anyone interested in getting some real insights into how Buffer works.
It’d be amazing to hear your feedback on this. Drop us a note below to let us know what you think!