We pay Facebook our hard-earned cash so they deliver our ads to the right people. In addition to that, we also get valuable data about our targeted audience and metrics like CTR, CPM, CPC, etc. These metrics are here to help us understand how our targeted audience interacted with our ad and what actions were made by them.
If we don’t know how to read and understand these metrics, then we’re throwing our money away. So it’s really important we know how to take the data Facebook gives us back and pinpoint the mistakes we did so we can fix them.
I’ll help you understand what these metrics mean and how to read them in order to find the problems in your ad/store.
CPC – Cost Per Link Click
CPC is a really important metric and it tells us a lot about the ad we’re running – It’s one of the first things I look at after checking the results of my test ads. By looking at my CPC, I can understand how the targeted audience reacted to my ad.
If I had cheap link clicks, it can only mean the targeted audience stopped scrolling and actually watched my photo/video ad and then took the time to click the link on it to visit my website. I caught their attention and the offer was interesting enough for them to click on it. And of course, my targeting was on point too!
If my link clicks were expensive or I barely got any, this means my ad or targeting wasn’t good enough. It’s possible the interests I chose were not that good or my ad + offer wasn’t good enough to catch their attention. In most cases I’ve seen, targeting wasn’t the problem… Targeting is pretty simple and almost everyone nails it after a few tries. The ad tho is the real challenge and making a good ad is not an easy task.
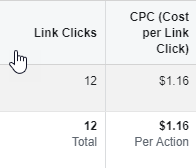
When testing, I expect my link clicks to be pretty cheap – My cost per link click is usually lower than $1 but sometimes they’re higher and I’m fine with it to a certain number. $1~$2 CPC is normal but I will be a bit nervous if I don’t get any Add to Carts/Initiate Checkouts soon.
As you can see, my CPC in the photo above is $1.16 which is fine. I also have a 2 orders for that adset so it’s working great. But if my CPC was $2 and I had no Add to Carts, then I would probably kill it and move on. I don’t like waiting too much on bad adsets.
CPM – Cost Per 1,000 Impressions

CPM is how much we pay per 1,000 impressions – Unfortunately, we don’t have much say here and the one who decides how much we pay is Facebook. But we can still work on our CPM in order to reduce it if it’s too high.
We need to look at the niche – Competitive niches will cost more and we can expect our CPMs to be much higher than CPMs for other niches(like mine). If I were to target the cat niche, I’m more than sure my CPM wouldn’t be $10 like in the photo above. I didn’t target the cat niche for some time now, but from what I remember I had CPMs higher than $20, sometimes even $30. Now, this doesn’t mean you won’t get cheap link clicks or sales, you only have to invest more money.
We need to look at our ad – Facebook likes it when the content on their platform is good. If I launch a good ad which brings good engagement and my targeted audience like it, Facebook will lower my CPMs even if I’m in a highly competitive niche. It won’t be a huge drop but it can save us a few bucks. If the ad sucks and no one even stops for 1 second to give it a look, we could get higher CPMs.
We need to look at our ad account – Facebook isn’t perfect and you already know bugs and stuff like that happen which can affect our delivery. I occasionally help users and guide them and I remember seeing really crazy CPMs like $90 or even $150. Of course, ads like these need to be stopped right away but if the same thing repeats itself no matter what you do, it can be a problem in the ad account. So one of my suggestions was switching to a fresh ad account with a fresh pixel and it worked. The new ads had normal CPMs. If you ever get some crazy CPMs, you can only wait it out or switch ad account if it stays the same.
We need to look at our targeted interests – Even in a highly competitive niche, some interests may get us a much lower CPM than the average. When everyone targets the same interests, you need to be smart and look for some “hidden” interests people tend to never even look for.
Like I already said, usually, there’s nothing we can do about CPMs and we can only hope to not pay too much.
CTR – Click Through Rate

CTR is a pretty basic stat and it shows us how many people clicked on our ad(in percents).
We have 2 CTRs as you can see in the screenshot above:
The first one is the Link-Click CTR and it shows us the percentage of people who actually clicked our link.
The second one is the CTR(all) and it counts any click on our ad.
By looking at our CTR, we can understand how people react to our ad. If the CTR is too low, we should consider changing something in our ad so we stop more people from scrolling and hopefully clicking our ad. It can be our ad copy or the ad itself. Maybe our Call-To-Action isn’t that appealing? Or the video ad beginning isn’t too interesting? And what about our offer? 50% OFF looks better than 25% OFF These are some of the stuff you need to consider looking at and changing if your CTR is too low.
As you can see from the photo above, my CTR isn’t that great. My CPM is great and the CPC is fine but the CTR needs an edit so I can squeeze more link clicks This ad has 2 sales and it just shows me the people love my product BUT my ad could use a little lift.
Ad Ranking


This metric shows us the rank of our ads.
The quality ranking shows us the quality of our ad compared to the average. Facebook likes quality so I guess it’s how people react to our product and how relevant it is to the targeted audience. I guess it’s the same as relevance score. So as you can see, my score is above average and it means I’m doing good and my ad is relevant to my targeted audience. If my score was lower, trying new audiences could help us get a better score.
Engagement rate ranking shows us how our ad is doing with getting engagement compared to the average. Here I’m ranked only average. Maybe if I adjust my ad and make it more catchy, the CTR will be higher and the engagement rate will be above average.
Conversion rate ranking shows us how how our conversion rate compared to the average. In this case, I’m above average and it just shows that the product I sell is really good and people are willing to spend their money to get it. If everything else was good and my conversion rate score was low, then a change in the store or product are needed. Maybe the price is too high? Maybe the product page loads slow? Maybe the problem is in the checkout process? If you read my articles on this blog, you already know how to pinpoint the problems on your store by now. If not, make sure to go through my recent posts
Video Plays

Video plays show us how much of the video our audience actually watched. By checking these stats, we can learn how interested our audience was in our video and how good our video is. In the picture above, you can see our stats and I’m confident to say they’re pretty healthy.
A big chunk of the audience who watched 25% stayed and watched at least half of our video. And 1/3 of the total viewers watched the whole video. These are good stats considering people can barely concentrate for 20 seconds anymore. And of course, this campaign brought us really good sales so it’s working alright 📷
But what if the only half of the 25% plays stayed to watch till 50%? This would mean that a big chunk of our audience wasn’t interested enough to keep watching at least half of our video. In this case, we need to adjust the structure of our video. Make it more interesting, show different footage, show something to keep them watching. We need to have a healthy watch ratio so we can later build good lookalike audiences.
To Sum It Up:
I showed some of the ad metrics I pay attention to when testing my products. I explained what each one of them means and what results are “good” and what are “bad”. By understanding these metrics, I can pinpoint the problem(if such exists) and act accordingly to fix it and have a better chance to get sales.
I’m sure this article will help you understand your metrics a little better now and if you have any questions, ask in the comments
Good luck!