If you’re responsible for your business’ social presence, you might feel a bit under pressure.
Totally understandable.
Perhaps your boss wants to know that your efforts are paying off.
Or maybe the rest of your marketing team wants to make sure you’re on the same page.
And hey, these are fair concerns.
As businesses invest more and more in social media, they want to make sure they’re receiving a positive ROI.
The challenge, though? Presenting your social data in such a way that actually makes sense to your colleagues.
Struggling to convey your social activities to your team? Looking to justify your strategy? Then it’s probably time to step up your social media reporting.
Getting started with social media reporting
If the idea of reporting bores you to death or puts you in panic mode, relax!
We’ve put together a totally free social media reporting template to get you started. You can adapt our template based on your business and its preferred platforms in just a matter of clicks – just open in Adobe or Apple Preview to edit.
This template serves as an awesome starting point if you’re totally new to social media reporting.
And to make the most of your reports, we’ve broken down the must do’s from A to Z.
Figure out your reporting frequency
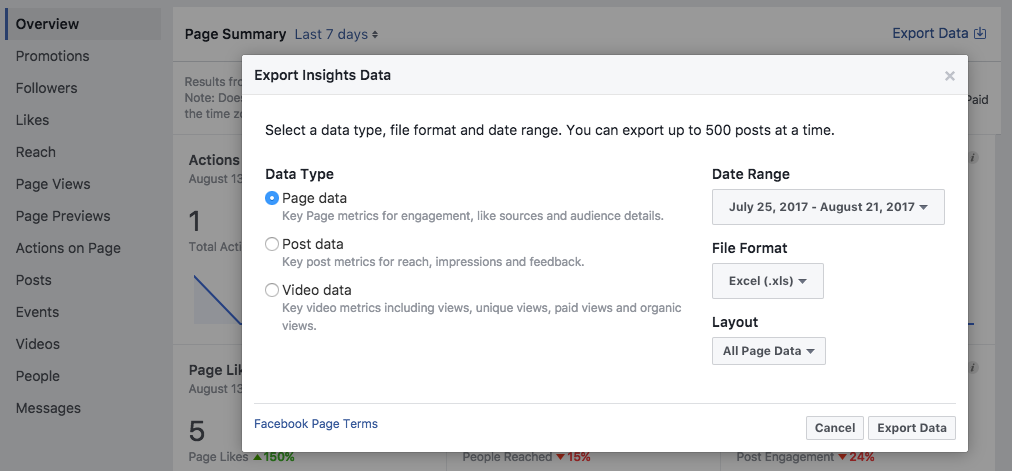
First things first: you need to determine the time-frame for your reports.
All social networks allow you to pull data from their native analytics based on specific date ranges.
Businesses typically produce social reports either weekly, monthly or quarterly.
For the sake of this guide, we’re going to focus on quarterly social media reporting.
Why? Because quarterly reports allow you to collect a larger sample size of data. Whereas short-term reports are skewed by anomalies (think: random high and low-engagement days), quarterly reports convey long-term trends.
Also, quarterly reporting gives you more time to prepare and dig deeper into your data. This informs your strategy more than surface-level data ever could.
Assess your reporting audience
Before putting together the report itself, you need to think about who’s going to be looking at it.
Your marketing team who’s already knee-deep in data and industry jargon?
Your boss or managers who might not exactly be savvy to social?
Or maybe even your entire organization who doesn’t hear from you often?
Based on your audience, you can better determine the level of detail and what to points to highlight.

For example, marketing teams are going to be interested in campaign-specific performance data. Meanwhile, higher-ups might be laser-focused on conversions and financial figures.
No matter who’s going to see your report, they’re going to want to see hard numbers related to campaigns.
And hey, that leads us directly to our next point.
Nail down your KPIs
The most important aspect of assessing social media ROI is conveying your KPIs (key performance indicators).
The following data points can be found through native analytics or reporting via Sprout and should be front and center in your social media reporting:
- New followers. Your follower count isn’t the be-all, end-all of your social presence, but it is a number you should strive to tick upward. You can drill these down from network to network or look at them across all accounts.
- Reach. Note the difference between reach and impressions. Expanding your reach should translate into expanding your audience.
- Engagement. Shares, comments and Likes are valuable currencies for social marketers. Increasing engagement proves that you’re posting content that people want to see.
- Clicks. Like engagement, click-throughs highlight compelling content. These can be divided into link clicks or promotion-specific clicks.
- Posts. How much content is your business pushing out? If you see a correlation between more posts and higher engagement, you’re more inclined to ramp up production.
- Traffic. The more traffic to your site via social, the better. You can measure this easily in Google Analytics.
- Conversions. This is the most pressing metric for those interested in assessing your financial ROI. You can either set conversion goals in Google Analytics or look at the performance of your social ads to figure this out.

Tracking multiple KPIs allows you to look at your social presence in a more holistic way versus harping on a single metric.
Present your reports in context
Reality check: you can collect all the metrics in the world, but they mean little without some context.
For example, what’s is the typical follower count for businesses in your field? What’s the industry standard conversion rate for Facebook ads?
For those unfamiliar with social media, these reference points help them make sense of your KPIs.
So do your social media goals.
Again, data points by themselves are just numbers. Prior to highlighting KPIs, make sure that you throw in a few brief sentences about what your goals were for the quarter.
You don’t need to write a novel here: keep it simple. Your responsibility is to show that you’re working toward something, whatever that may be (think: more conversions, followers).
In terms of your goals themselves, stick to the principle of setting SMART goals, which are:
- Specific. Say which specific strategies you’re going to employ (UGC campaigns, influencer marketing, Facebook carousel ads and so on).
- Measurable. Any social goal needs to be tracked by the numbers.
- Achievable. You need to make sure you have the resources (creatives, budget) to achieve your goals.
- Realistic. Don’t promise results that you can’t produce (think: doubling your follower count in a week).
- Time-Sensitive. Your goals need an end point: they can’t be vague and ongoing (think: “We’re going to increase our follower count”).
Framing your data this way not only helps you understand whether you’re reaching your goals but also clue you in on what needs to change to get there if you’re not.
Make your reporting visual
If you want your reports to shine, you’re going to need to do more than hit people over the head with numbers.
A visual representation of your data and talking points is a good start. This makes your social media reporting even easier to digest at a glance.
And if nothing else, visuals make your reports more entertaining (yes, visual data can be entertaining).
So how do you make your reports more visual?
Let’s start with graphs.
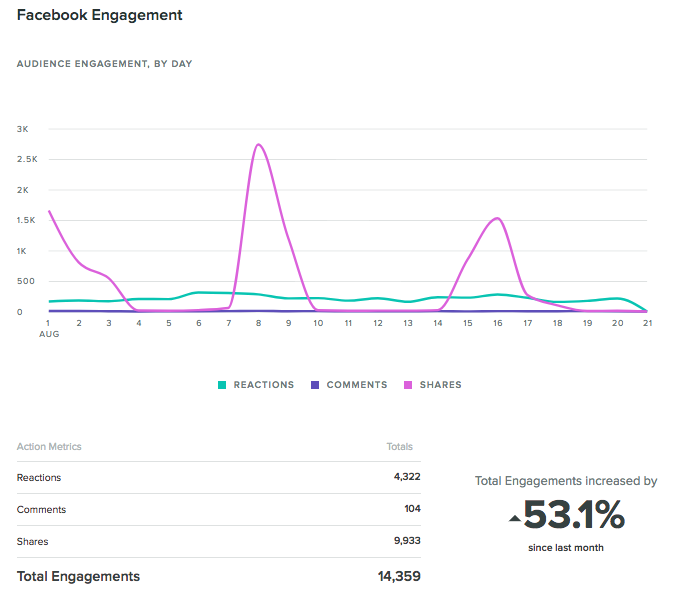
With Sprout, you can customize your reports beyond the sort of data you get from native analytics. These reports range from platform-specific metrics to your entire social presence. The varying color scheme is a nice touch, isn’t it?

Visual reporting is also great for conveying events such as engagement spikes or shout-outs from influencers. These are the sort of events that your reporting audience are most interested in.
Of course, social media reporting is about much more than numbers. Providing real-world examples of what your business is doing on social media can be an eye-opener.
For example, you can grab screenshots of your brand’s social posts that totally knocked it out of the park. Shout-outs, accolades and mentions from fellow industry players are also fair game here.
Oh, and our social media reporting template has built-in spots to place these snapshots to make your reports pop.
Provide competitive context, too
This may come as a surprise, but your reports aren’t necessarily all about you.
Undoubtedly, people will want to know what your competitors are up to, too.
And that’s okay!
When reporting on your competitors, make sure you don’t punch above your weight. For example, it wouldn’t make sense for a local coffee shop to compare their social performance to the likes of Starbucks.
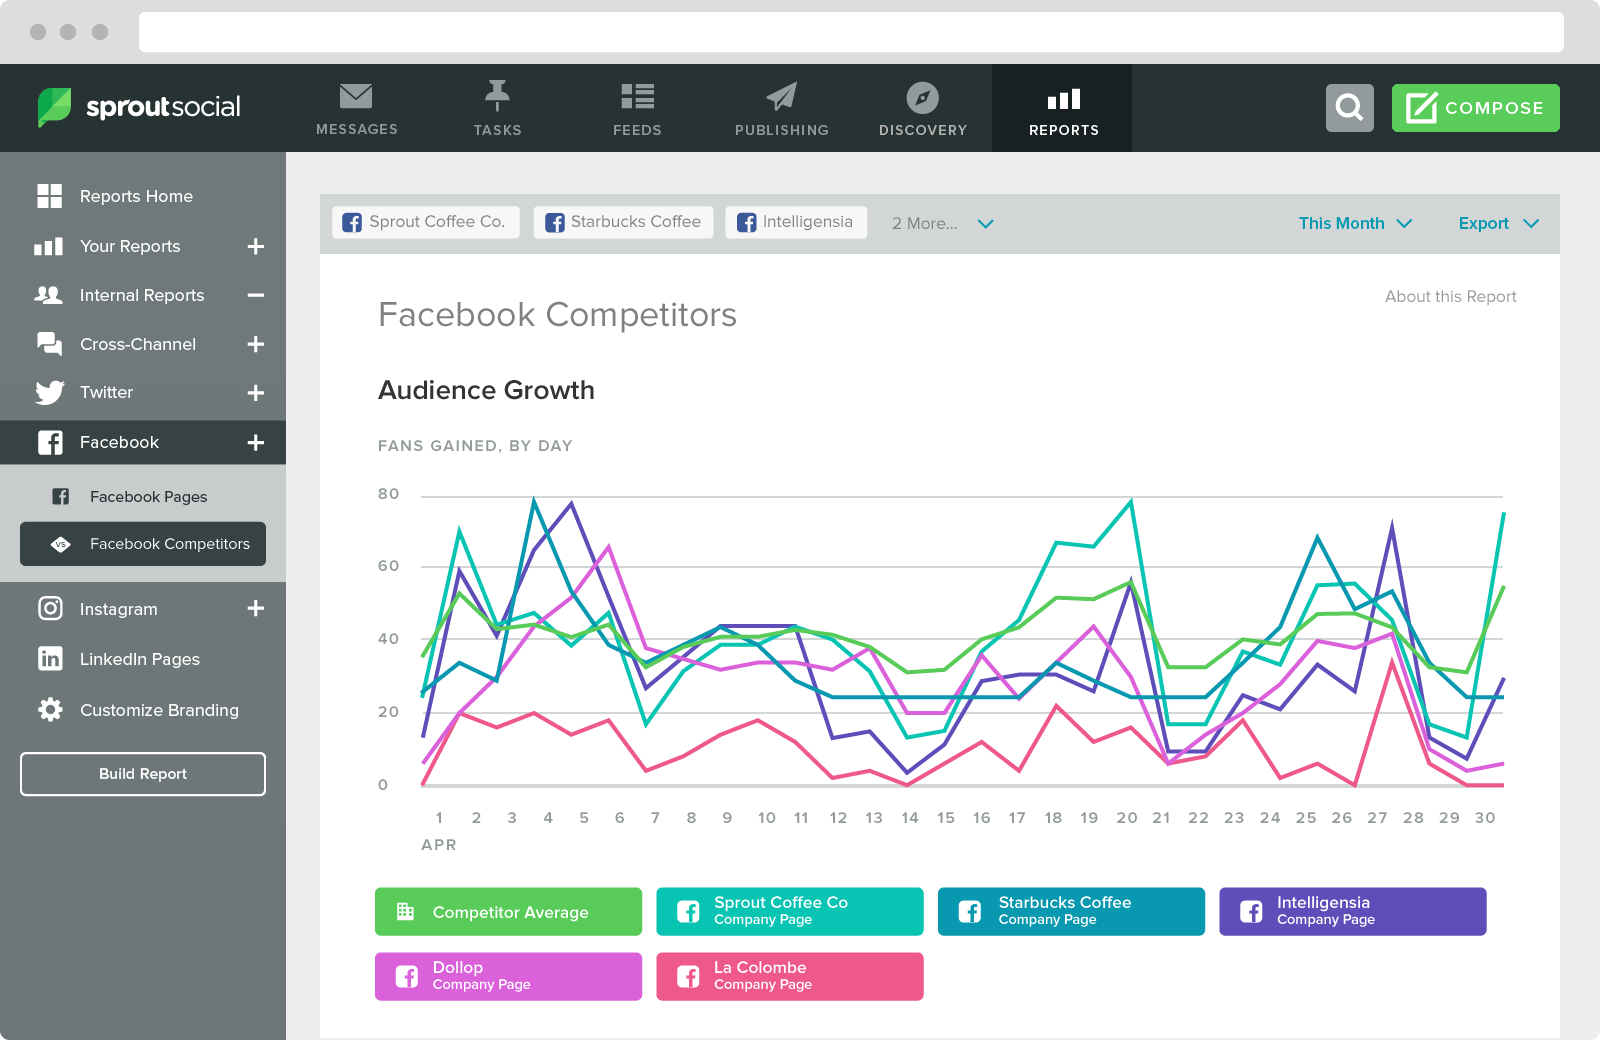
Chances are you already have a good idea of who your closest competitors are, right? With this in mind, you use competitive benchmarks along with Sprout to report on the following:
Audience growth. Are you and your competitors growing at the same rate? If someone’s outpacing you, it might be worthwhile to do a deep dive on their content strategy.
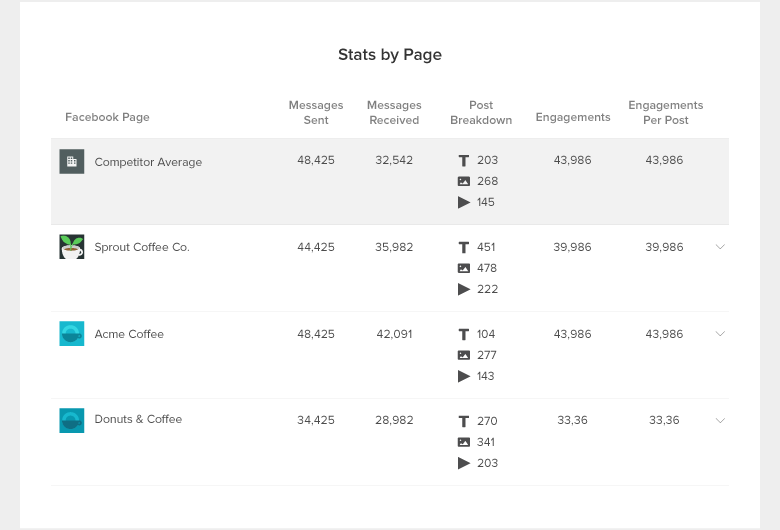
Share of voice. Who’s getting their content shared the most? Who’s getting lots of love via hashtags? Maybe it’s time for you to get a bit louder, so to speak.
Content performance. Who’s dominating key social terms in your industry? Who’s posting the most? You can use third-party competitive analysis tools to figure this out or have Sprout do some of the legwork for you.
Finally, summarize your key learnings and next steps
At a glance, reporting might seem like a review exercise.
In reality, social media reporting is about taking action.
To round off your report, you need to let your readers know exactly what you’re going to do next based on what you’ve learned (think: SMART goals).
Run more ads. Publish more UGC. The choices are endless and your data can inform you of where to go.
And as always, conveying this information doesn’t require you to be wordy. Bullet points are more than enough: if someone needs further elaboration, they can always ask.
That wasn’t so bad, now was it?
Ready to try your hand at social media reporting?
From improving your social ROI to justifying your campaigns, social media reporting is a must-do for modern businesses.
And putting together a comprehensive social report is much less daunting when you know what to focus on.
With the help of our template, you can whip up your own report sooner rather than later.
Download our template (open in Adobe or Apple Preview to edit) and start putting together a social media report today!
If you have any questions or need further help with your reporting, feel free to comment down below!