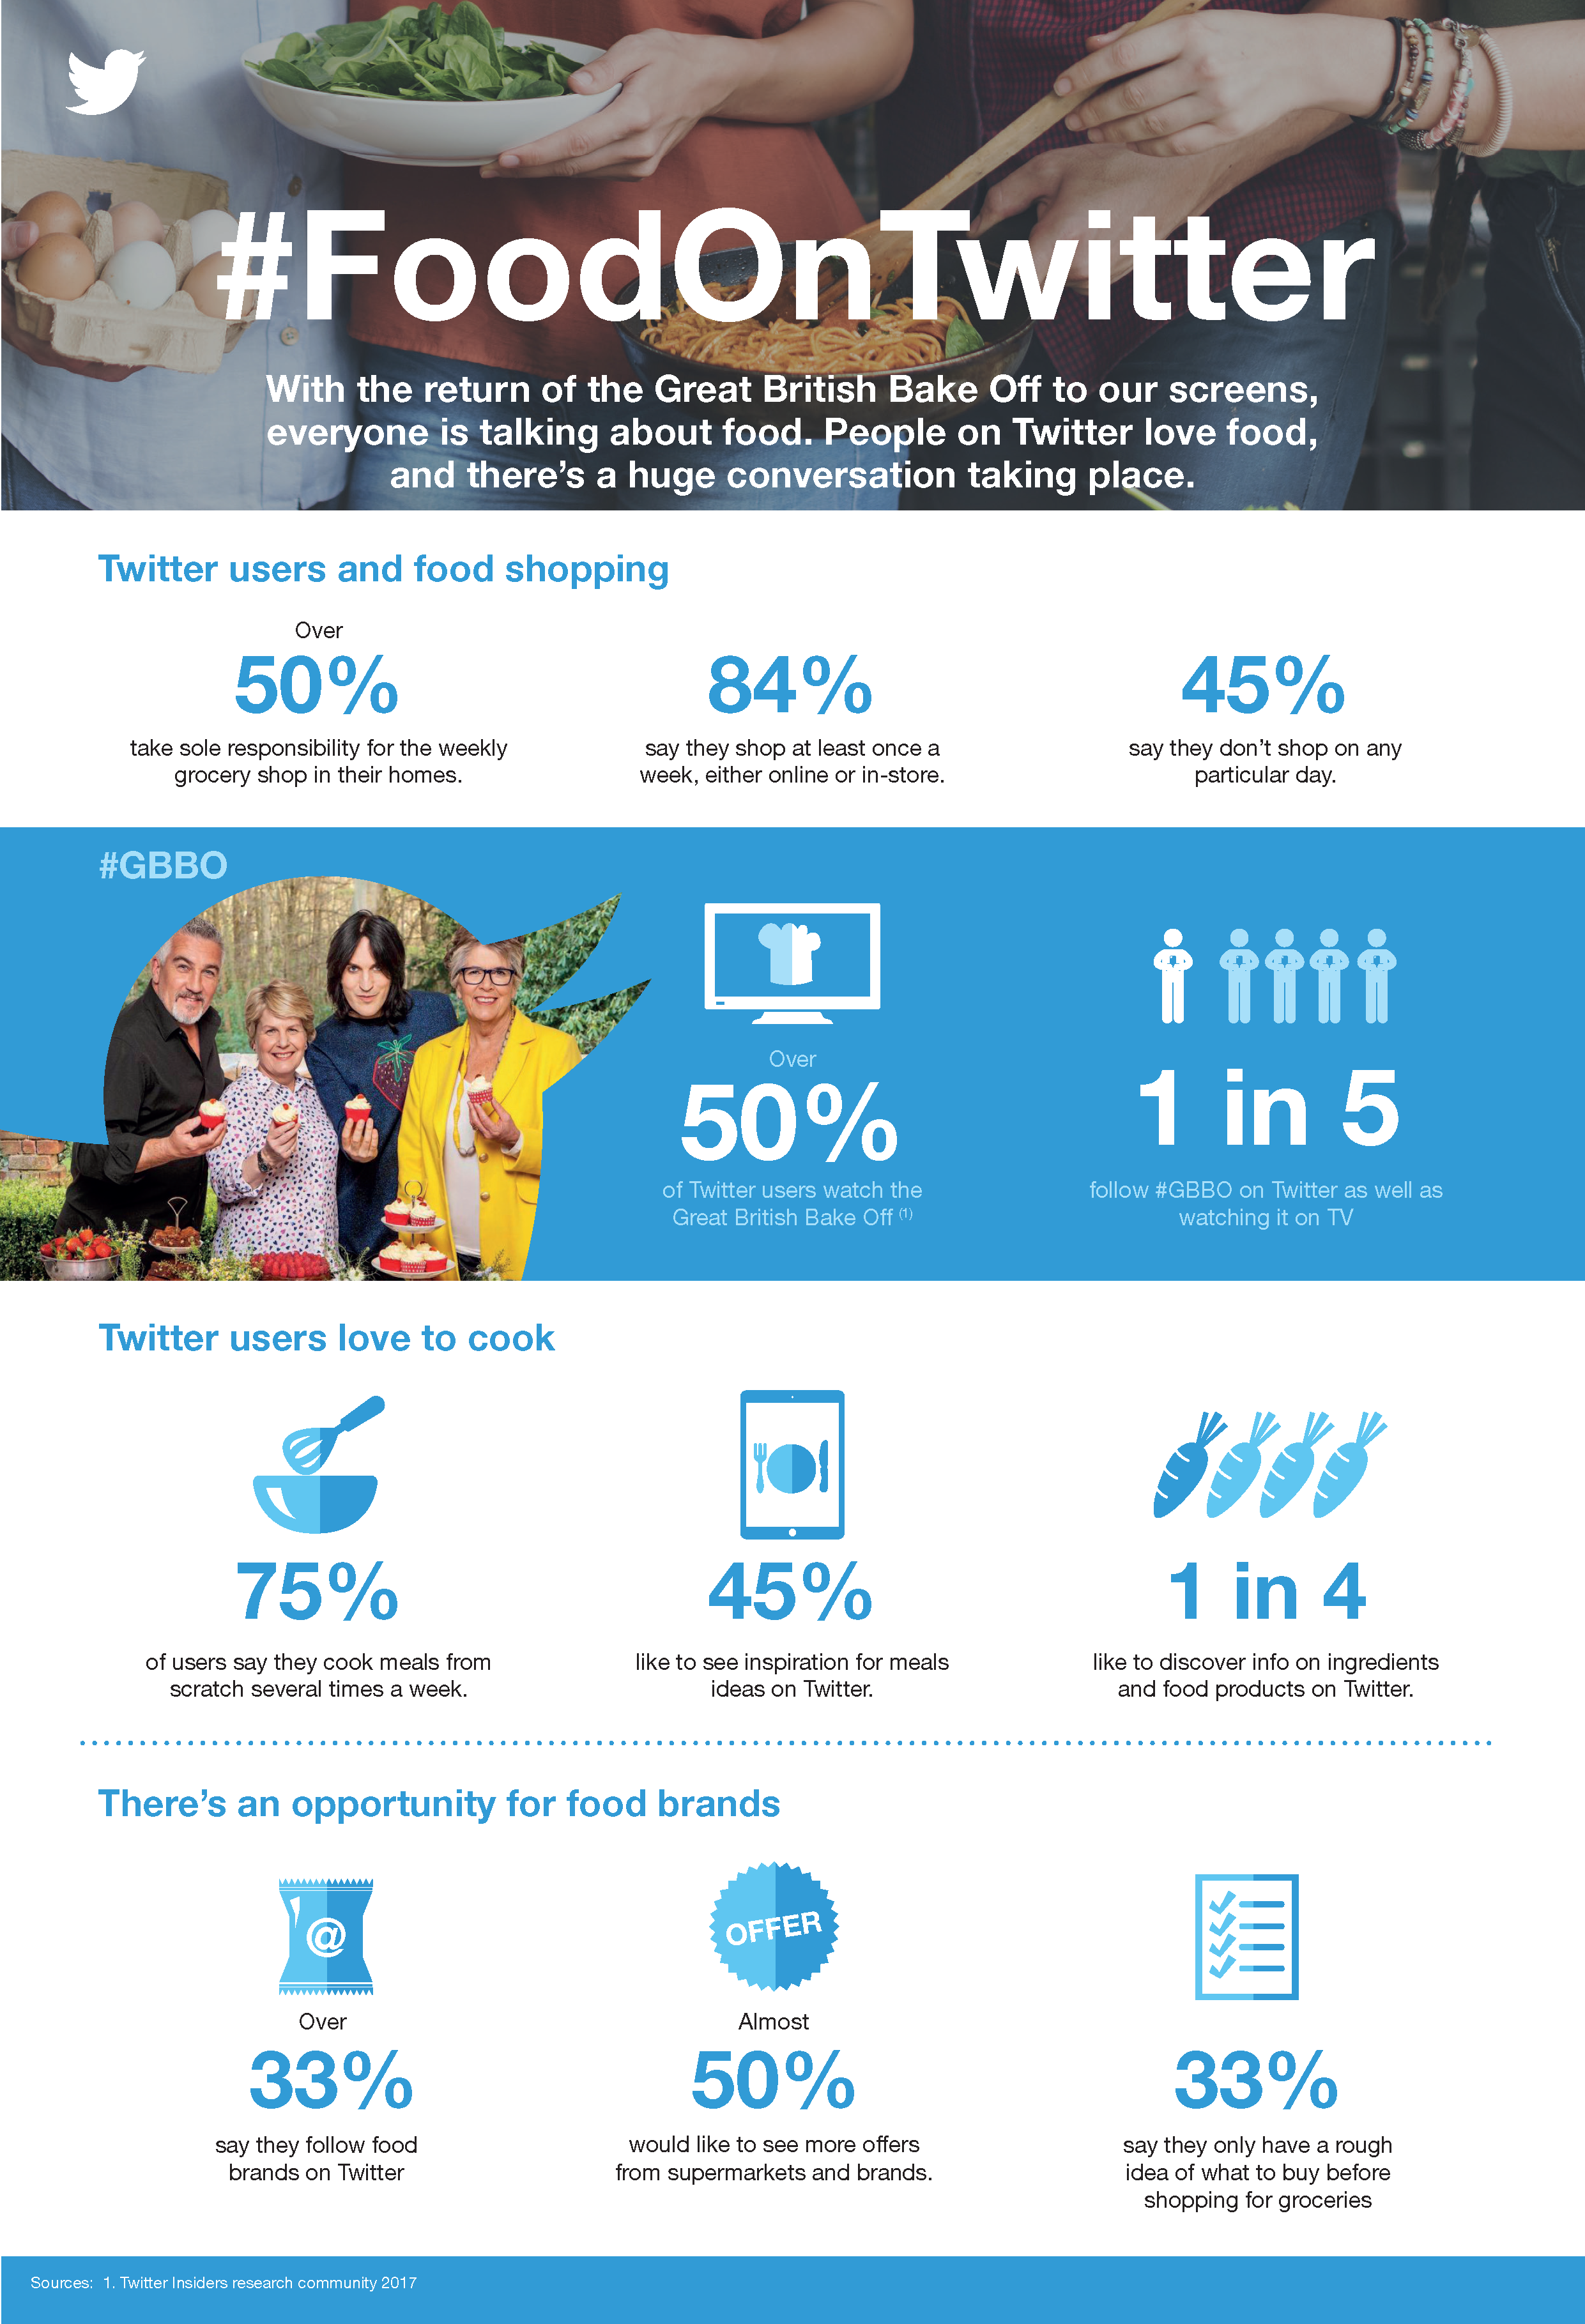
It’s not as well-known everywhere, but ‘The Great British Bake-Off’ is huge in the UK, pulling in an average of around 10 million viewers per week. The program recently underwent a range of significant changes, putting it in the spotlight, which lead to Twitter putting together this new infographic which looks at how Twitter users discuss food-related topics on the platform.
And while the data is UK-specific, it raises some interesting considerations about food-related discussion via tweets. Generally, Pinterest and Instagram are considered the more responsive destinations for food-related content, while food videos have proven hugely popular on Facebook.
Based on these stats, Twitter seems somewhere in the middle, but still, some interesting considerations, particularly if you were to assume that at least some of these trends hold in other regions.
![Measuring Food-Related Discussion on Twitter [Infographic] | Social Media Today](http://www.socialmediatoday.com/sites/default/files/adhutchinson/files/food%20on%20twitter%20info.png)
Comments are closed.