We’re very excited to announce a new tool to get even more awesome data! It’s Nena’s Dynamite Industry Report! 🎉 It’s a great way to check your business’ stats against real US census data in a fun format. We’re also now on Product Hunt so please upvote us when you get a chance! So what exactly can you check?
Keep reading for some great tips on how to get the most of out our new Industry Report tool from SumAll!
Here’s the different data sets that you can easily find and share on Nena’s Dynamite Industry Report!

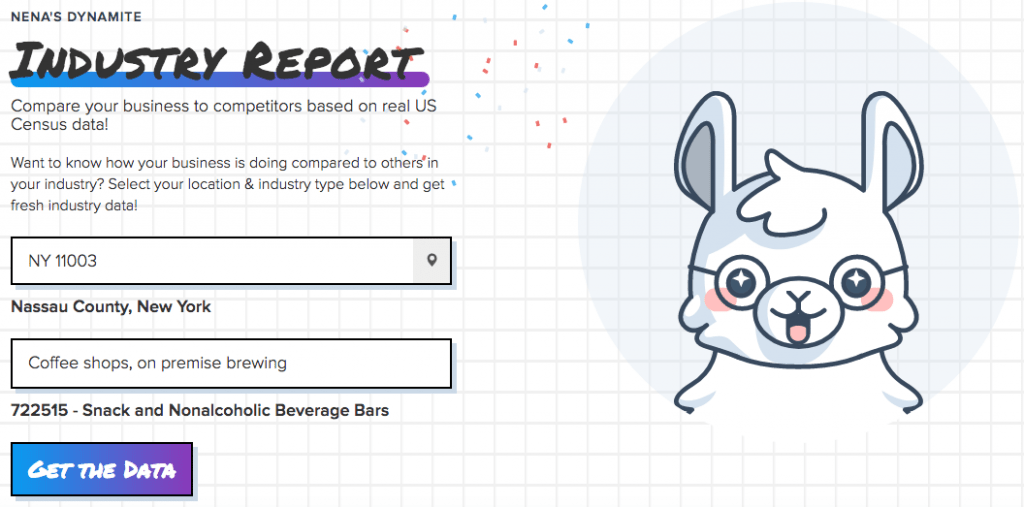
First, be sure to enter in the correct location and choose from the drop-down menu. Next, choose what type of business it is. In the above example, we are looking at Coffee Shops with on-site brewing in Nassau County, New York.
Competition:

The first set of data, we’ll pull up once we have location and business type is competition. How many competitors in that particular bucket based off of real census data and the total number of people who are in your business vertical.
Employees:

The second set of data is the number of employees located in that area for that particular role and what the average overall payroll is along with the average salary per employee.
Revenue:

And finally, the third set of data with average revenue in USD, average revenue per business day and what competitor’s revenue may look like in that particular area.
And there you have it! A fun way to compare your business (big or small) with real US census data for your particular location. Try it yourself now!
Want more great analytics for free? Sign up for SumAll account today!