Google added annotation cards in change history reports in the Google Ads UI on Wednesday. There are also new sections for
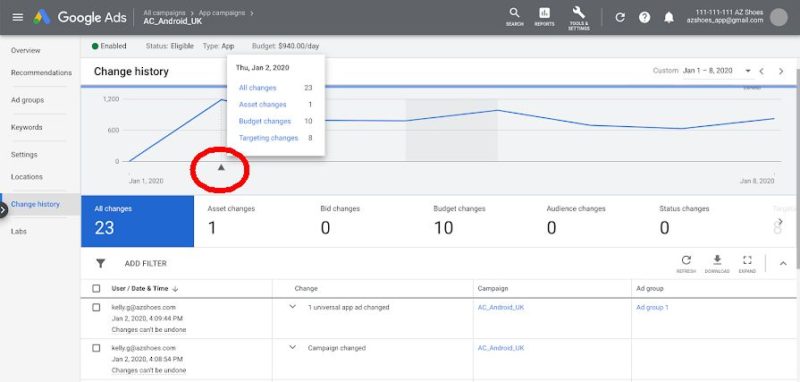
Using annotations. You’ll see a little triangle icon below the change history performance chart indicating an annotation. Click on the triangle to open a card that lists and links to the types of changes made during that time period.
Clicking on any of the links will take you to that section of the change history report. For example, clicking on “Budget changes” will highlight that section of the report and show the 10 changes made.
Why we care. This a pretty handy update that can help you identify and navigate to the changes that might have impacted your performance faster.
Google will also show audience list, optimization goal and asset (for App campaigns) in the list below as well, when applicable
About The Author

Ginny Marvin is Third Door Media’s Editor-in-Chief, running the day to day editorial operations across all publications and overseeing paid media coverage. Ginny Marvin writes about paid digital advertising and analytics news and trends for Search Engine Land, Marketing Land and MarTech Today. With more than 15 years of marketing experience, Ginny has held both in-house and agency management positions. She can be found on Twitter as @ginnymarvin.