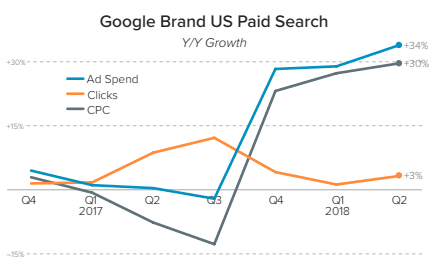
The average CPC paid by Google search advertisers for keywords that included their own brand name rose 30% Y/Y in Q2 2018 whilst desktop organic search visits fell 5%
Benchmarking company performance against goals and competitors is vital in understanding your current cut-through in digital, market share and potential revenue losses. It also helps identify opportunities in digital and set a KPI driven 90-day digital marketing strategy or campaign to improve current performance and achieve digital excellence.
New research from Merkle’s Digital Marketing Report Q2 2018 shows benchmarks for paid and organic search and social media reach, click through and cost. We’ve summarised the most important (and surprising) statistics below:
Paid search benchmarks 2018
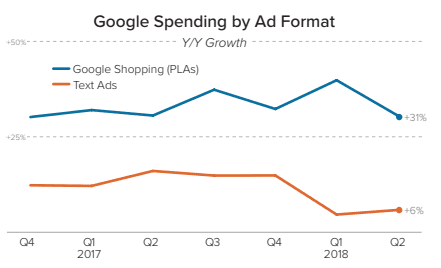
The use of Google Shopping ads for ecommerce and online retailers is vital. Shopping ads expose your brand’s products in a visual element on SERPs, which includes brand name and pricing.
Google shopping ads spend is up 31% in Q2 2018 year-on-year. However, spend on text ads is considerably lower than that in 2017 with a 6% growth since Q1 2018. On top of this, Google Shopping ads 59% of Google’s search ad clicks. Excluding brand keyword clicks, Shopping ads generated more than 82% of retailers’ Google search ad clicks in the quarter.
More paid search benchmark statistics:
- Click growth held roughly steady at 7% Y/Y, while CPC growth fell from 13% in Q1 2018 to 10% in Q2 2018.
- Spending growth for Google search ads slowed for the third straight quarter but still came in at 18% Y/Y in Q2 2018.
- Clicks from Google’s search partners were down 16% Y/Y in Q2 2018, compared to 7% growth for Google.com clicks.
- Health and pharma, retail and consumer goods, and financial services advertisers saw the largest increases in CPC.
- Spending on non-brand Google Shopping and text ads grew 13% Y/Y in Q2 2018.
- The average CPC paid by Google search advertisers for keywords that included their own brand name rose 30% Y/Y in Q2 2018.
What’s surprising is that only 37% of Google search ads clicks use audience targeting – although this is significantly up since January 2017.
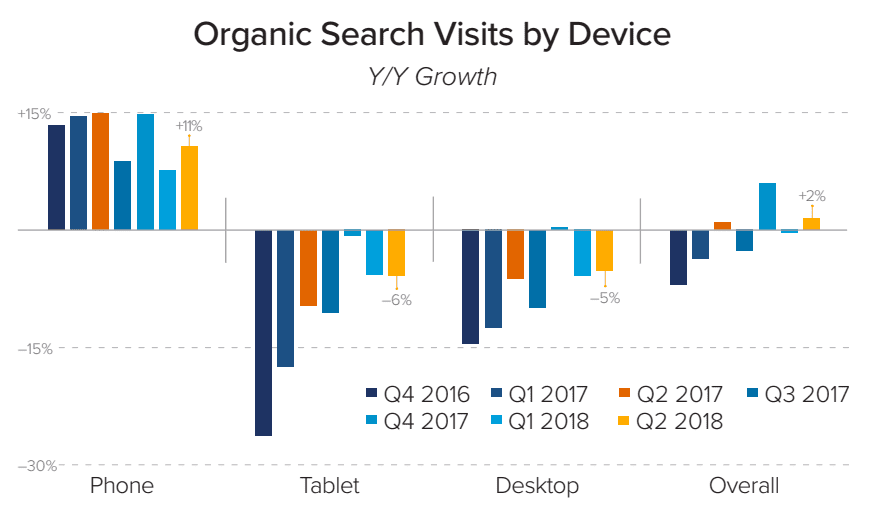
With the introduction of cross-device reporting made available by Google, it is more important than ever to understand which devices are being used at different touchpoints in the customer journey and how these can be optimized for maximum click-through and conversion.
More than half (53%) of search ad clicks were produced by phones in Q2 2018 – up 48% from the previous year. Tablet click-through has fallen to 8%.
Have you read our detailed write up of Google Marketing Live?
The Google Marketing Live conference detailed new products and ad campaigns they are slowly going to start rolling out. These include Smart Campaigns for SMEs and Smart Shopping campaigns, as well as a new speed score metric in Google Ads and new responsive ads.
Read more about Google Marketing Live: Smart Campaigns, Automated ads, and Machine Learning.
Organic search (SEO) statistics 2018
Some interesting statistics for organic search growth and changes include Total site visits driven by organic search rose 2% Y/Y in Q2 2018 and with the rise of mobile searching desktop organic search visits fell 5% in Q2 2018.
It’s no surprise that Google produces the majority (96%) of US mobile organic search visits since is has the largest search engine market share and mobile search is on the rise – hitting an all-time high of organic search visits of 55%.
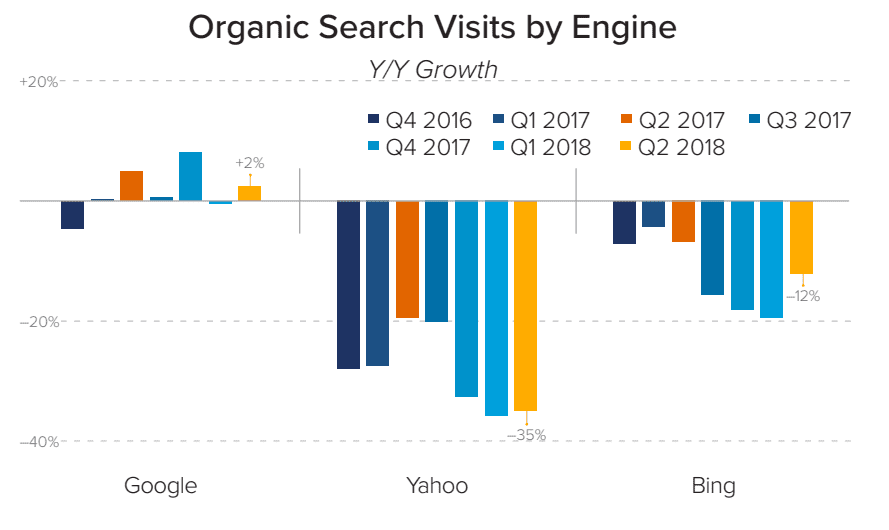
Since losing its position as a default browser on Firefox, Yahoo organic search ists have fallen significantly by 35% and keep falling by over 30% year-on-year for the previous three quarters.
Download Our Premium Resource – Successful SEO Guide
This guide is one of our most popular and rightly so. If you get it right, SEO can be a fantastic, relatively low-cost way to drive quality visitors who want to do business with you to your site.
Access the Successful SEO guide
Organic and Paid social media benchmarks 2018
Although some marketers dismiss the overall effect of social media marketing on performance and ROI, there is no doubt social media is in the hearts and minds of all consumers, B2B and B2C and social media play a key functional role in their daily lives. Reaching potential customers on social media is key to achieving a fully integrated digital marketing strategy that reaches and speaks to target audiences in all possible touchpoint areas. But how are the most social media channels performing?
Social media-driven site referrals are relatively low for the majority of companies (with exceptions of those who have used and grown their company from social media roots -LADbible, BuzzFeed etc.). For instance, news and media sites like BuzzFeed have close to 30% social media visit referrals since their content is actively published and widely shared throughout social media channels. LADbible’s main traffic source comes from social media with over 85% of traffic being referred from social.
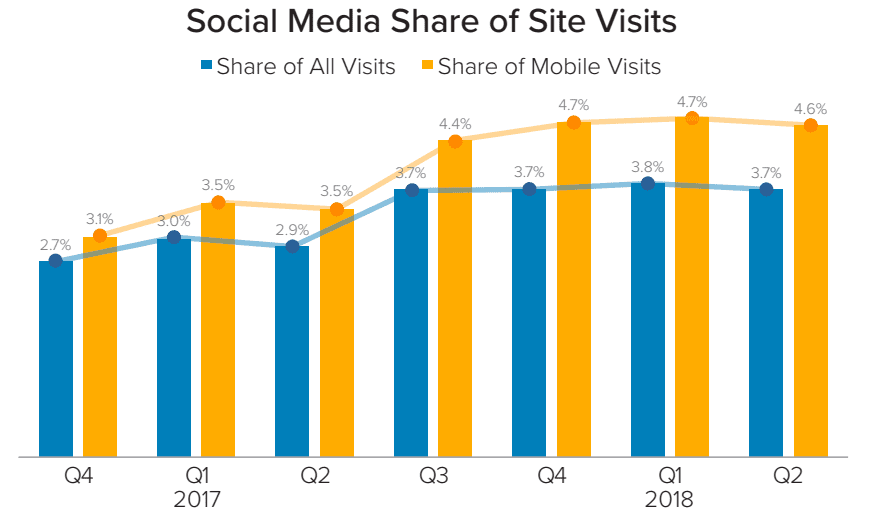
Merkle reports that social media produced 3.7% of all site visits in Q2 2018, up from 2.9% the previous year. This is significantly higher for mobile devices.
What is the state of paid social media spend and performance?
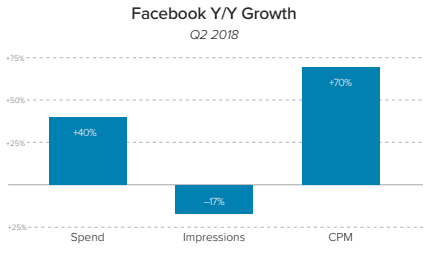
Facebook ad spend is up 40% (not including Instagram) indicating investing in Facebook ads provides desirable performance, or more money is needed to boost campaigns and reach audiences – we’re swaying more for the latter reason since impressions were down 17%.
Instagram spend growth is currently more than four times that of Facebook (up 177%) with impressions up by 209%. With the increase in shoppable Instagram ads and social media referrals through Instagram sponsored stories, it is no surprise that Instagram ad spend is on the rise.
More social media marketing statistics:
- Site visits produced by YouTube grew nearly 300% Y/Y in Q2 2018, while Instagram-produced visits rose 236%.
- Facebook accounts for the majority of social media-driven site visits only produced 8% year-on-year visit growth.
- Between phones and tablets, mobile devices combined to produce more than 77% of site visits driven by social media platforms in Q2 2018.
- Brands investing in YouTube advertising since at least Q2 2017 increased spend by 189% Y/Y, driven primarily by an increase in impressions, which grew 225% Y/Y.