Generic reports in Google Analytics contain aggregated data, data from all the things on one big pile. That’s a lot of information, but not very specific. So, if you’re just monitoring your data, you might manage that by looking at the standard data you see in Google Analytics. But, if you want to go beyond that, to thoroughly analyze your data, you need more context. One of the (easy) ways you can add context to your data is by adding secondary dimensions. Gotten curious? Read on!
What are secondary dimensions?
To explain what secondary dimensions are, we need to explain what dimensions are first. I’ve written a post about dimensions (and metrics) in which you can read that:
A dimension is a description, a characteristic, a feature or aspect of your data. It’s not a quantitative variable but more a qualitative variable.
So, it’s quite often letters instead of numbers. Let me give you a concrete example: in Google Analytics’ reports, the first column of the table is always a dimension:
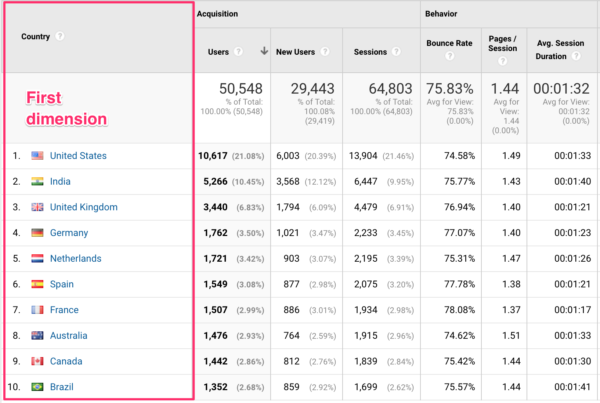
In this case, ‘Country’ is a dimension. Now, what you can do, is click on the first country you see in your reports. This will take you to a more specified report about the country you’ve clicked on: you’ll see regions. Now, these regions can sometimes be clicked on as well. That depends on the country. If you want to see cities, you can add a secondary dimension. Here’s how:
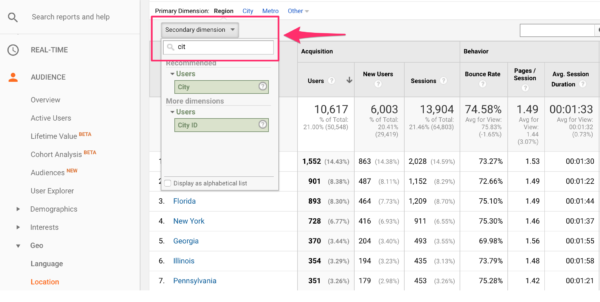
Click on the ‘Secondary dimension’ button you see above the first column. If you know the name of the dimension you want to add, you can enter that in the search bar. Otherwise, you need to scroll around a bit to find what you’re looking for.
Why should I use secondary dimensions?
In the previous example, you can see that adding a secondary dimension adds more information to your report. For instance, you could initially have concluded that it’s a good idea to run an advert campaign for all of California. But, if you had looked at city data as well, you might’ve concluded that it’s a good idea to run that campaign in LA only because that’s where all your traffic is coming from.
Another example to show you why you should use secondary dimensions in Google Analytics. Perhaps you’re interested in SEO: then you want to check your traffic coming from a search engine. That’s called ‘Organic traffic’ in Google Analytics. Seeing how much traffic you’re getting from Organic is fun, of course. But, it has the potential to be much more informative than just knowing how many users and sessions you’ve had. It’s really interesting to check which of your site’s pages users land on (called ‘Landing Page’ in Google Analytics). Here’s how you do that:
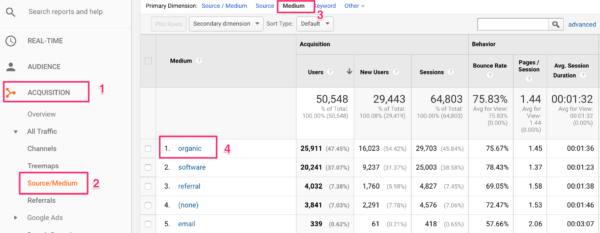
- Go to the ‘Acquisition’ section in the left sidebar
- Click on ‘Source/Medium’
- Then click on ‘Medium’, it’s above the table
- Click on ‘organic’ to see all traffic from search engines
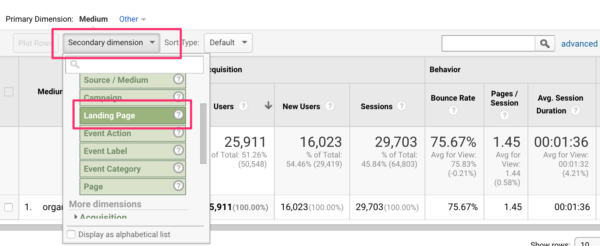
Then, it’s time to add the secondary dimension: ‘Landing Page’. Click on the button above the first column of the table and look for ‘Landing Page’, and click on that. Now, you have a nice overview of all pages that people land on that come from a search result in a search engine. Look at the numbers you’re seeing: what’s the bounce rate? Did they stay for long? Did they buy anything? And are the pages you’re seeing, the pages you want to rank with? What can you do to optimize further?
Which secondary dimensions should I use?
Now, doing all this can be very hard, that’s why you should always have a question in mind when opening your Google Analytics reports. Because that question will dictate which dimension you should add to your reports. Of course, if you’re like me, you often open Google Analytics without a question in mind because you just want to play a bit, have a look around.
For those of you who play and also for those of you who have a specific question, there’s a new feature in Google Analytics that helps you with picking a useful secondary dimension. Look at this:
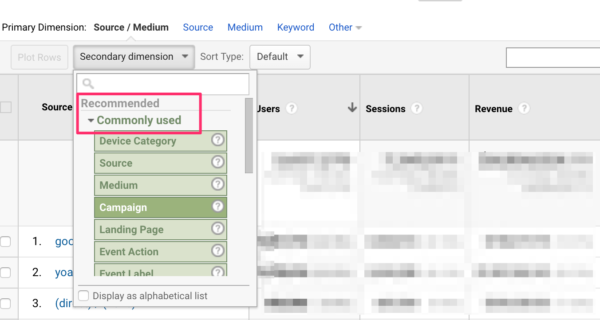
Now that’s awesome! It shows you which dimensions are commonly used in a report, in this case, the ‘Source/Medium’ report. That’s valuable advice!
If you’re using UTM tags properly, the secondary dimension brings a lot of context to your reports. Let’s say you’ve started a campaign and also added the utm_content UTM tag: you can add that as a secondary dimension, called ‘Ad Content’ in Google Analytics. Then, you can find out which item of your campaign, for instance, a text link or a button was more successful.
Conclusion
Using secondary dimensions in Google Analytics gives your data so much more meaning. It adds context to your data, allowing you to understand what you’re seeing better. And with more understanding about what your data actually means, it’s easier to draw the right conclusions. In other words, using secondary dimensions is a MUST in Google Analytics.
Read more: Annelieke’s analytics: What are dimensions and metrics in Google Analytics? »