Social media is a powerful tool to connect your business or brand with your audience. But posting without understanding who your audience is or what type of content they want is like driving in the dark without headlights—unnecessary and downright dangerous.
Luckily Facebook has a powerful and free analytics tool—Facebook Insights—that allows you to easily measure the performance of your business’s page. Insights tracks likes, page views, reach, and more. No matter what your goals are on Facebook— building brand awareness, communicating with customers, or getting followers to take an action—Facebook analytics will help you understand who your most engaged audience is and how they’re interacting with your page.
Why use Facebook Insights?
With over 1.4 billion active daily users, Facebook is a platform that has incredible reach. But, thanks to a number of big changes to its algorithm, Facebook prioritizes content from family and friends. That means it’s harder than ever to get your audience’s attention on the platform.
That’s where Facebook Insights comes in. Understanding your Facebook page’s metrics gives you the information you need to make sure you’re putting the right content in front of the right audience. It helps you work with Facebook’s algorithm instead of just sending content into the void and hoping someone will see it.
To explore each of the key areas Facebook analytics measures, we put together a guide to Facebook Insights that will help you understand how and why each metric is important to your overall social media strategy.
How to use Facebook Insights
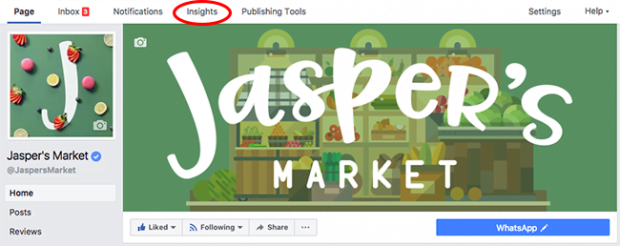
To get started, go to your brand’s page and click “Insights.”
From there, you’ll end up on your dashboard, which is split into sections.
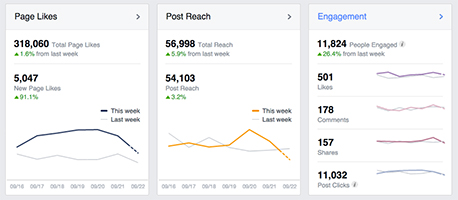
Overview
The overview section gives you a big picture view of everything that’s happened on your page in the last week. Specifically it tracks three important measurements:
- Page likes: How many people liked your page over the last seven days.
- Post reach: How many people saw all the content you posted over the last seven days.
- Engagement: How many people liked, shared, or commented on your posts over the last seven days.
Tip: if your social media goal is to grow your following as quickly as possible, you can view how your page likes and reach have changed over the last seven days. Then if you see a pattern developing or want to learn more, you can dig deeper into other sections.
Page Likes
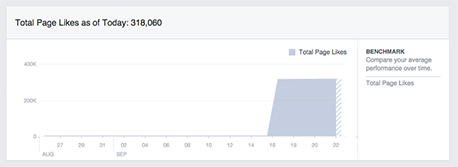
This section of your Insights page breaks down the total number of likes your page has received. It looks at three key metrics:
- Total Likes: The total number of page likes over a 28 day period.
- Net Likes: The total number of new likes (meaning new likes minus unlikes).
- Where These Likes Happened: Where each of your new likes came from, such as from visiting your page directly, or from a page suggestion, or from mobile or desktop.
Tip: The Page Likes section is a great place both to monitor the overall growth of your followers and understand the source of these likes, such as organic posts on your page or a Facebook ad campaign. You can narrow your focus to specific time periods by clicking or dragging to select a date range on any of the graphs. This can help you isolate the effects of a specific ad campaign or series of posts.
Post Reach
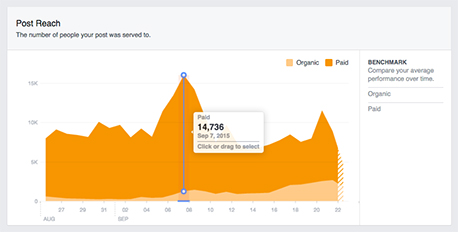
The Post Reach section gives you an overview of how many people saw content from your page and how they interacted with it. This information is broken down into four key metrics:
- Post Reach: The total number of people who were shown a specific post. This section is also broken down into organic and paid reach.
- Likes, Comments, and Shares: How much positive engagement your page got. The higher this number is, the more people will be shown your posts in the future.
- Hide, Report as Spam, and Unlikes: How many people engaged negatively with your page. High levels of negative engagement will decrease the number of people who see your posts in the future.
- Total Reach: The total number of people who saw any kind of activity from your page.
The information in this section lets you tie the content of your posts to different trends in your graph. If you want to track a specific time period, just click on any of the charts. A pop-up will appear to tell you which posts people saw during the selected time period.
Tip: If you see a spike in activity, you can click or drag to select that section of the graph to find out what posts were active during that time. This will help you hone in on what kind of content is most popular with your audience (or which kinds of posts might be hurting your performance).
Visits
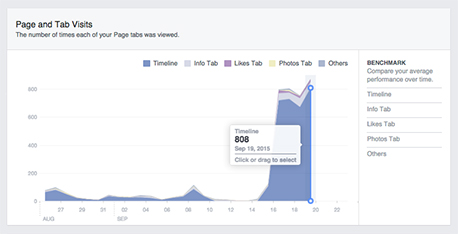
This section lets you see how many people are coming to your page and where they’re coming from. It’s broken down into two key metrics:
- Page and Tab Visits: The total number of times each of your pages or tabs was viewed.
- External Referrers: The total number of times visitors came to your page from a website other than Facebook.
Tip: The External Referrers section also lists the top non-Facebook websites that send visitors to your page. If you want to see how these external referrers have performed over time, you can select sections of the graph to compare time periods. Often these sites will be familiar, but if you see a new site it could be a good opportunity for a partnership.
Posts
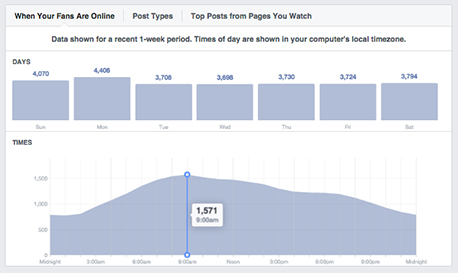
This section is divided into three metrics:
- When Your Fans are Online: When the people who like your page are on Facebook viewing content.
- Post Type: How successful different types of posts were based on the average reach and audience engagement.
- Top Posts From Pages You Watch: Engagement stats of posts made by the pages you’re watching. This is a great way to keep track of how your competitors are approaching similar audiences or content.
Tip: The Posts section gives you a powerful range of metrics that allow you to review and respond to the type of content resonates most with your audience. Do they love links to articles? Photos? Or something else? This knowledge can help you get more likes or even create great Facebook ads.
You can also learn what the best time of day and day of the week to post is. Engaging with the right content at the right time is one of the best ways to get more likes on Facebook.
Video
This section uses three different metrics to give you a sense of what kind of video content is most successful on your page:
- Video Views: The total number of times your page’s videos were viewed for at least three seconds.
- 30-Second Views: The number of times your page’s videos were viewed for at least 30 seconds (if your video is less than 30 seconds, this will measure how many times people viewed 97 percent of that video).
- Top Videos: The most-viewed videos on your page that were watched for three seconds or more.
As of 2016, over 8 billion videos a day are viewed on Facebook. And four years from now, video content is poised to account for 80% of all consumer internet traffic. So understanding which videos are popular with your audience and how video content works for your brand is vital to your business’s success.
People
The final tab on your dashboard will help you get to know your audience better by looking at three different metrics:
- Your Fans: Who is liking your page with stats like their gender, age, location, and language.
- People Reached: Stats on the people Facebook served your page to over the last 28 days.
- People Engaged: Who interacted positively with your page over the last 28 days, either through liking, commenting, or sharing your posts.
Once you get to know who your most engaged audience is, you can decide what kind of content to create or boost to specific audiences. This is the first step to creating a comprehensive Facebook marketing strategy and running a Facebook ad campaign.
Facebook analytics tips & tricks
Once you have a good understanding of the data provided by your Facebook page analytics, these tips and tricks will help you get even more out of Insights:
- Check back often. Your Facebook analytics page is constantly updating, so you’ll want to pay attention to any patterns you see developing.
- Download the free Facebook Pages Manager App so you can communicate with your audience on the go and keep track of everything happening on your Facebook page, even if you’re away from your computer.
- Target your posts to specific audiences and connect with the people who matter to your brand.
- Update relevant info. Make sure people can contact you by ensuring that your website, phone number, and any other important information are up-to-date.
- Request an easy-to-find Facebook page URL by going to your General Account Settings. We suggest: facebook.com/yourbusinessname.
- Schedule your posts for when you know your audience will be online.
- Download data about you page from the past 180 days by clicking Export Data on the top right of the overview tab. Just choose the specific date range and field.
You can measure the success of your Facebook page, as well as your other social media accounts, easily and efficiently from the Hootsuite dashboard. Try it for free today.
Get Started
