
Do you have your own website or maintain the website of the company you work for? Of course, to do this right, you need to keep a keen eye on the performance of your website. Google offers several tools to collect and analyze data of your website. You probably have heard of Google Analytics and Google Search Console before. These tools are free to use for everyone maintaining a website and can give you very valuable insights about your website.
Why everyone with a website should use Google Search Console
Google Search Console has been created to easily track the performance of your website. You can get valuable insights out of your Google Search Console account which means that you can see what part of your website needs work. This can be a technical part of your website, such as an increasing number of crawl errors that need to be fixed. This can also be giving a specific keyword more attention because the rankings or impressions are decreasing.
Besides seeing this kind of data, you’ll get mail notifications when new errors are noticed by Google Search Console. Because of these notifications, you’re quickly aware of issues you need to fix.
Setting up an account
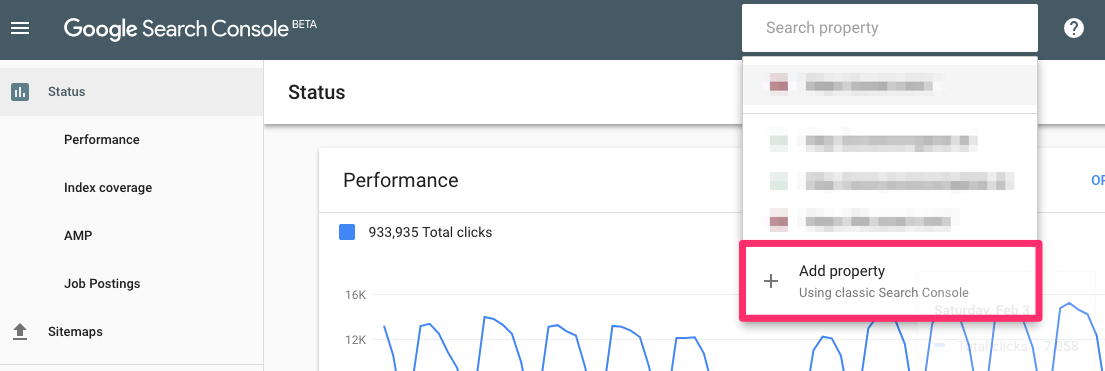
To start using Google Search Console, you’ll need to create an account. Within the new Google Search Console, you can click on ‘add a new property’ in the top bar:
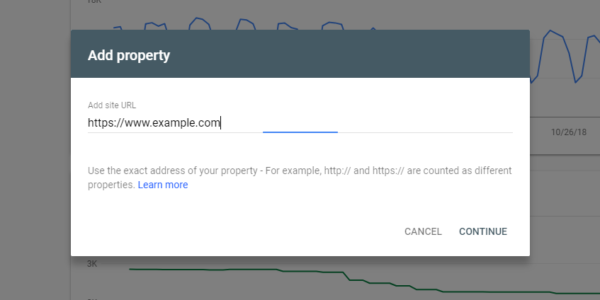
Clicking on the ‘Add a property’ button, you can insert the website you want to add. Make sure you add the right URL, so with ‘https’ if you have an https website and with or without ‘www’. For collecting the right data, it’s important to add the right version:
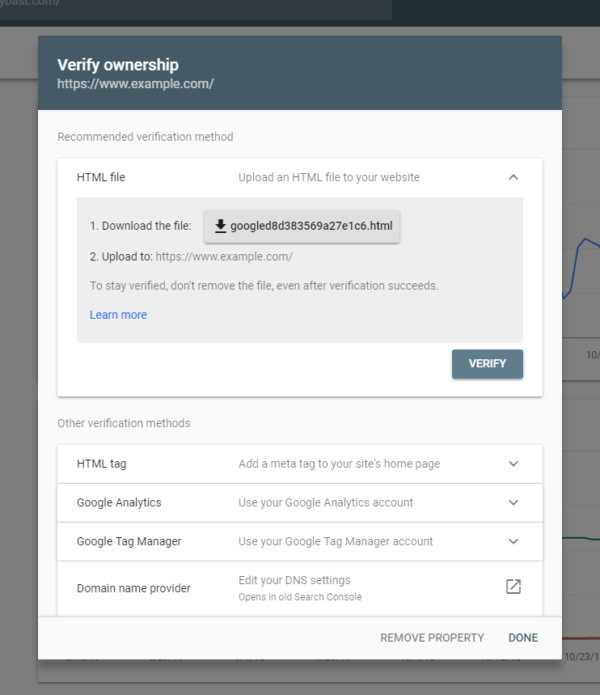
When you’ve added a website, you need to verify that you’re the owner. There are several options to verify your ownership.
For WordPress users who use Yoast SEO we recommend using the ‘HTML tag’ method:
You can easily copy this code and paste it into the ‘Webmaster tools’ tab within the Yoast SEO plugin:
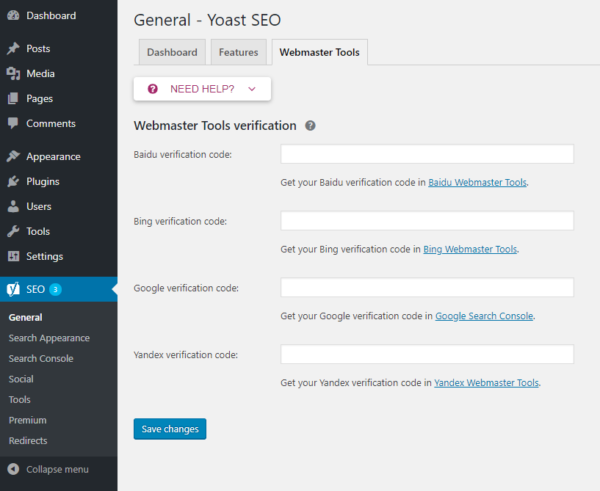
After saving this, you can return to Google Search Console and click on the ‘Verify’ button to confirm. If everything is ok, you’ll get a success message and GSC will start collecting data for your website.
Features in Google Search Console
Now you’ve set up your account what would be the next step? Well, it’s time to look at some of your data! We’ll explore some of the reports and information available in the rest of this article.
Performance
Within the performance tab, you can see what pages and what keywords your website ranks for in Google. In the old version of GSC you could see the data of a maximum of the last 90 days but in the new version, it’s possible to see the data up to 16 months. Keep in mind that the data is available from the moment you set up your account.
If you check the performance tab regularly, you can quickly see what keywords or what pages need some more attention and optimization. So where to begin? Within the performance tab, you see a list of ‘queries’, ‘pages’, ‘countries’ or ‘devices’. Each of those sections can be sorted by the number of ‘clicks’, ‘impressions’, ‘average CTR’ or ‘average position’. We’ll explain each of them below:
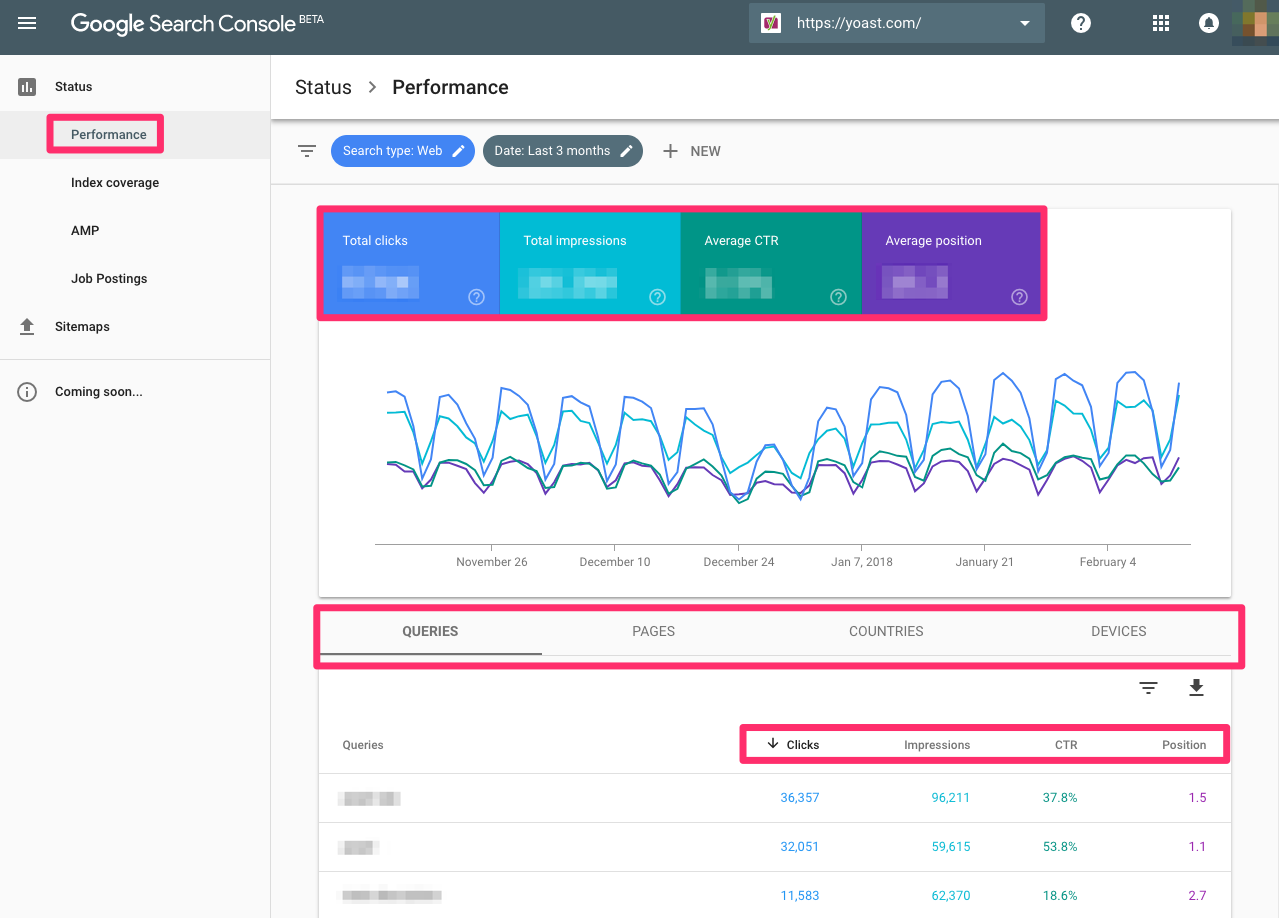
1. Clicks
The amount of clicks tells you how often people clicked on your website in the search results of Google. This number can tell something about the performance of your page titles and meta descriptions: if just a few people click on your result, your result might not stand out in the search results. It could be helpful to check what other results are displayed around you to see what can be optimized for your snippet.
The position of the search result also has an impact on the number of clicks of course. If your page is in the top 3 of Google’s first result page it will automatically get more clicks than a page that ranks on the second page of the search results.
2. Impressions
The impressions tell you how often your website in general or how often a specific page is shown in the search results. For example, in the GSC account of our own website, Yoast SEO is one of the keywords our website ranks for. The number of impressions shown after this keyword shows how often our website is shown for that keyword in the search results of Google. You don’t know yet what page ranks for that keyword.
To see what pages might rank for the specific keyword, you can click on the line of the keyword. Doing this for the keyword [Yoast SEO], the keyword is added as a filter:
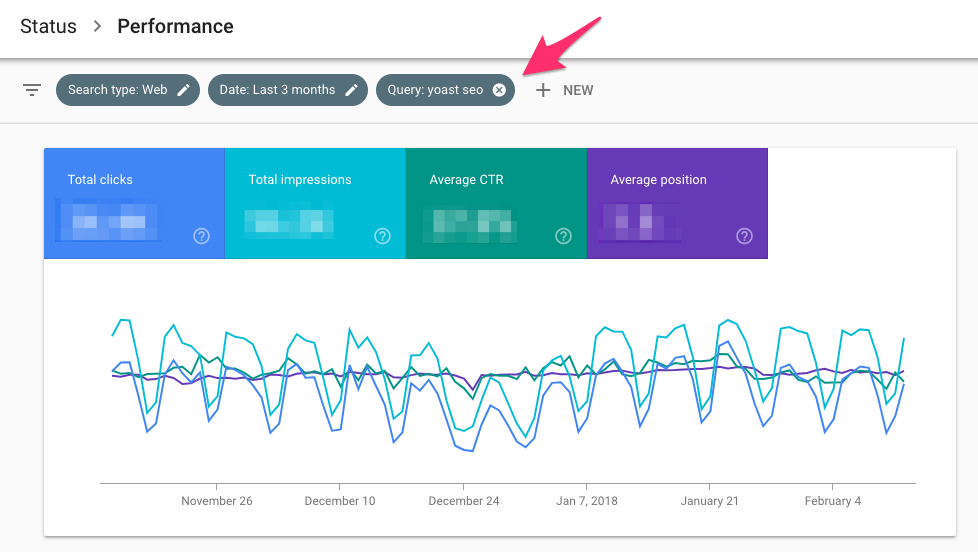
After that, you could navigate to the ‘Pages’ tab to see what pages exactly rank for this keyword. Are those pages the ones you’d want to rank for that keyword? If not, you might need to optimize the page you’d like to rank. Think of writing better content containing the keyword on that page, adding internal links from relevant pages or posts to the page, making the page load faster, etc.
3. Average CTR
The CTR – Click-through rate – tells you what percentage of the people that have seen your website in the search results also clicked through to your website. You probably understand that higher rankings mostly also lead to higher click-through rates.
However, there are also things you can do yourself to increase the CTR. For example, you could rewrite your meta description and make it more appealing. When the description of your site stands out from the other results, more people will probably click on your result and your CTR will increase. Keep in mind that this will not have a big impact if you’re not ranking on the first page yet. You might need to try other things first to improve your ranking.
4. Average position
The last one in this list is the ‘Average position’. This tells you what the average ranking of a specific keyword or page was in the time period you’ve selected. Of course, this position isn’t always reliable since more and more people seem to get different search results. Google seems to understand better and better which results fit best for which visitor. However, this indicator still gives you an idea if the clicks, impressions and the average CTR are explainable.
Index coverage
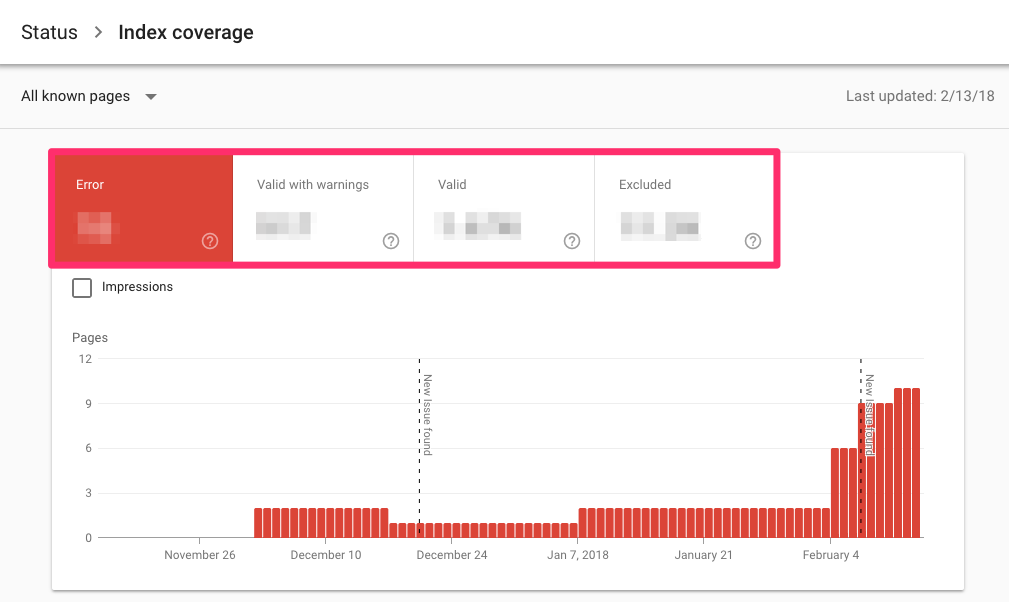
A more technical but very valuable tab within Google Search Console is the ‘Index coverage’ tab. This section shows how many pages are in the index of Google since the last update, how many pages aren’t and what errors and warnings caused difficulties for Google indexing your pages properly.
 We recommend checking this tab regularly to see what errors and warnings appear on your website. However, you also get notifications when Google has found new errors. When you get such a notification you can check the error in more detail here.
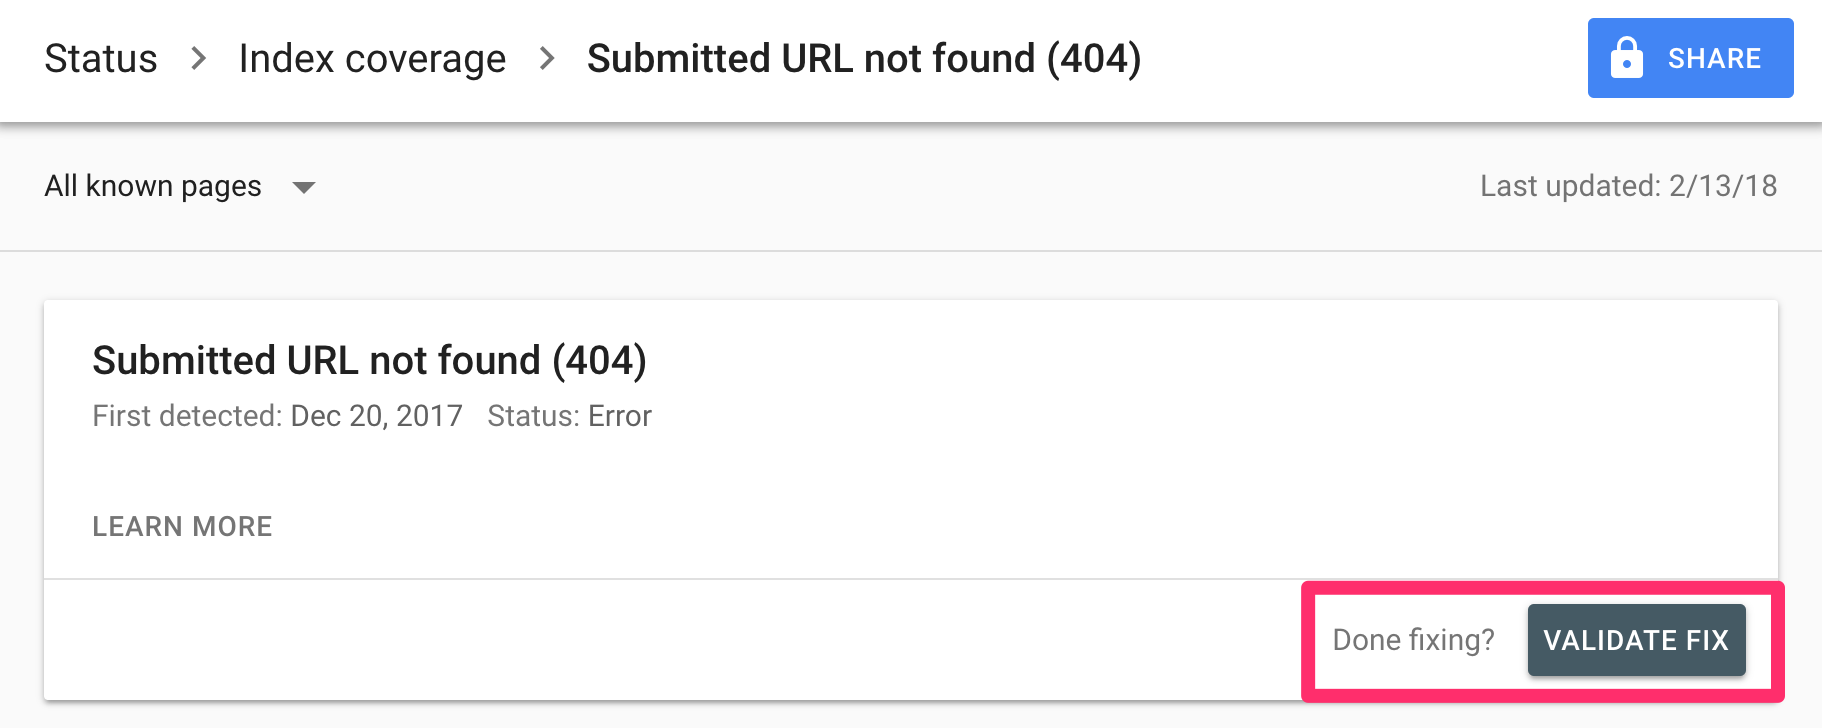
You may find that errors are caused when, e.g., a redirect doesn’t seem to work correctly, or Google is finding broken code or error pages in your theme.
Clicking on the link, you can analyze the error more in depth to see what specific URLs are affected. When you’ve fixed the error you can mark it as fixed to make sure Google will test the URL again:
There are a few things you should always look for when checking out your coverage reports:
- If you’re writing new content, your indexed pages should be a steadily increasing number. This tells you two things: Google can index your site and you keep your site ‘alive’ by adding content.
- Watch out for sudden drops! This might mean that Google is having trouble accessing (all of) your website. Something may be blocking Google; whether it’s robots.txt changes or a server that’s down: you need to look into it!
- Sudden (and unexpected) spikes in the graph might mean an issue with duplicate content (such as both www and non-www, wrong canonicals, etc.), automatically generated pages, or even hacks.
We recommend that you monitor these types of situations closely and resolve errors quickly, as too many errors could send a signal of low quality (bad maintenance) to Google.
AMP
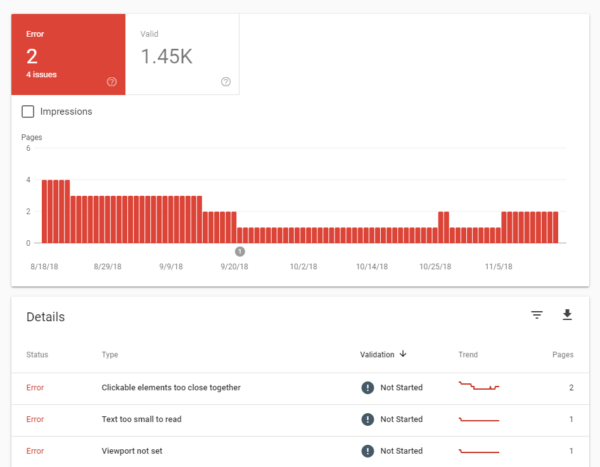
Below the ‘Index coverage,’ you can find the ‘AMP’ tab. AMP stands for Accelerated Mobile Pages: lightning fast mobile pages. If you’ve set up AMP for your website you can check for errors in Google Search Console. Within this section you can see the valid AMP pages, the valid ones with warnings and errors:
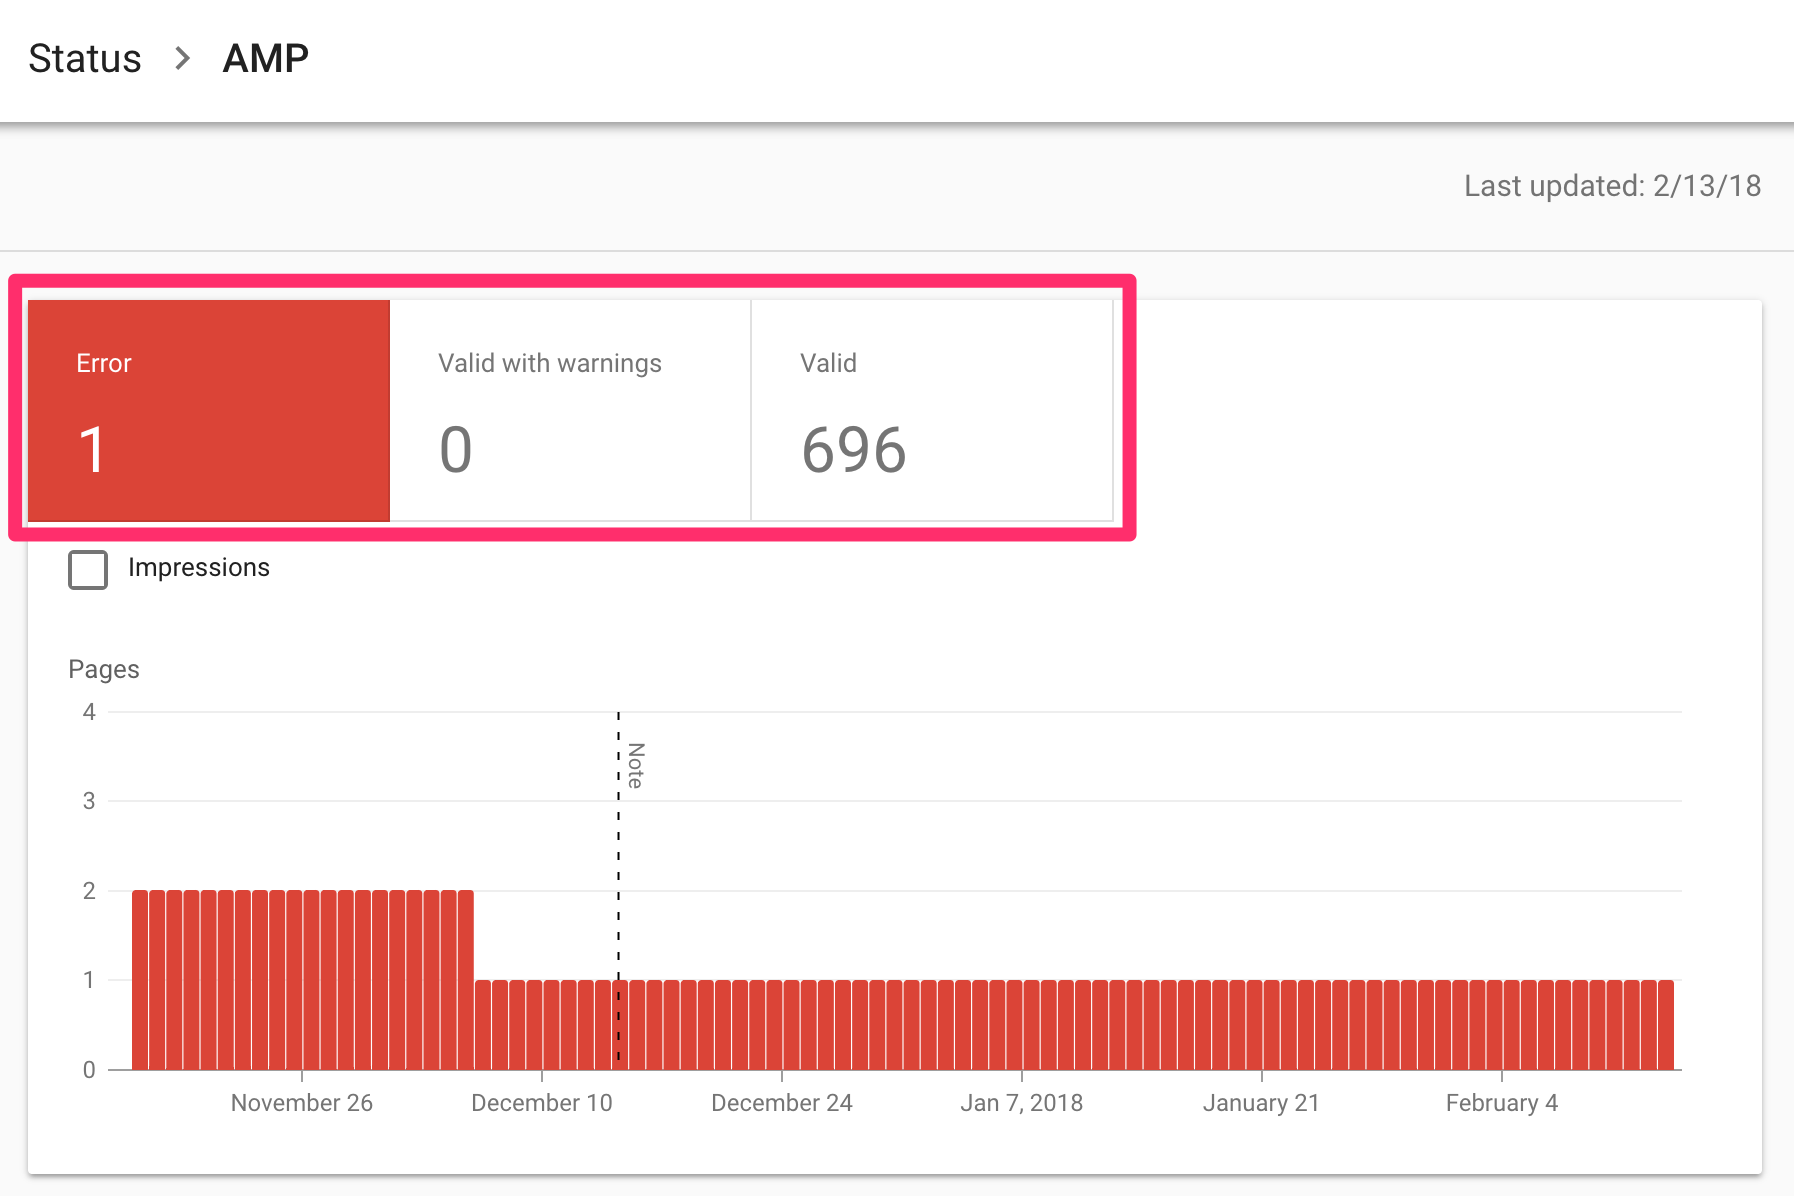 Below the chart, the issues are listed. If you click on one of the issues, you can see the affected URLs. Just as in the index section of GSC you can validate your fix if you’ve fixed an issue.
Job Postings
Within this tab, you’ll be able to list your job openings and to track their performance. If there are any errors, you’ll see them in here. It’s not the most important feature of GSC, but it can be valuable for specific companies or websites.
Events
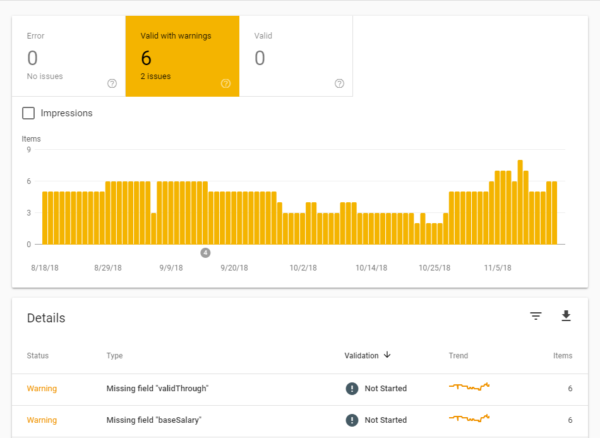
This section provides useful feedback on your structured markup for events. Events can be complex to tag up correctly, so this can be an extremely helpful report for finding out where you need to tweak details like dates and location!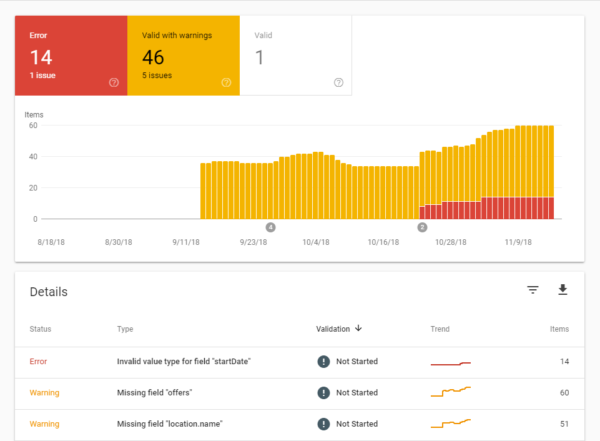
Sitemaps
An XML sitemap is like a roadmap to all important pages and posts on your website. We think every website would benefit from having one. Is our Yoast SEO plugin running on your website? Then you automatically have an XML sitemap. If not, we recommend creating one to make sure Google can find your most important pages and posts easily.
Within the XML sitemap tab of Google Search Console you can tell Google where your XML sitemap is located on your site:
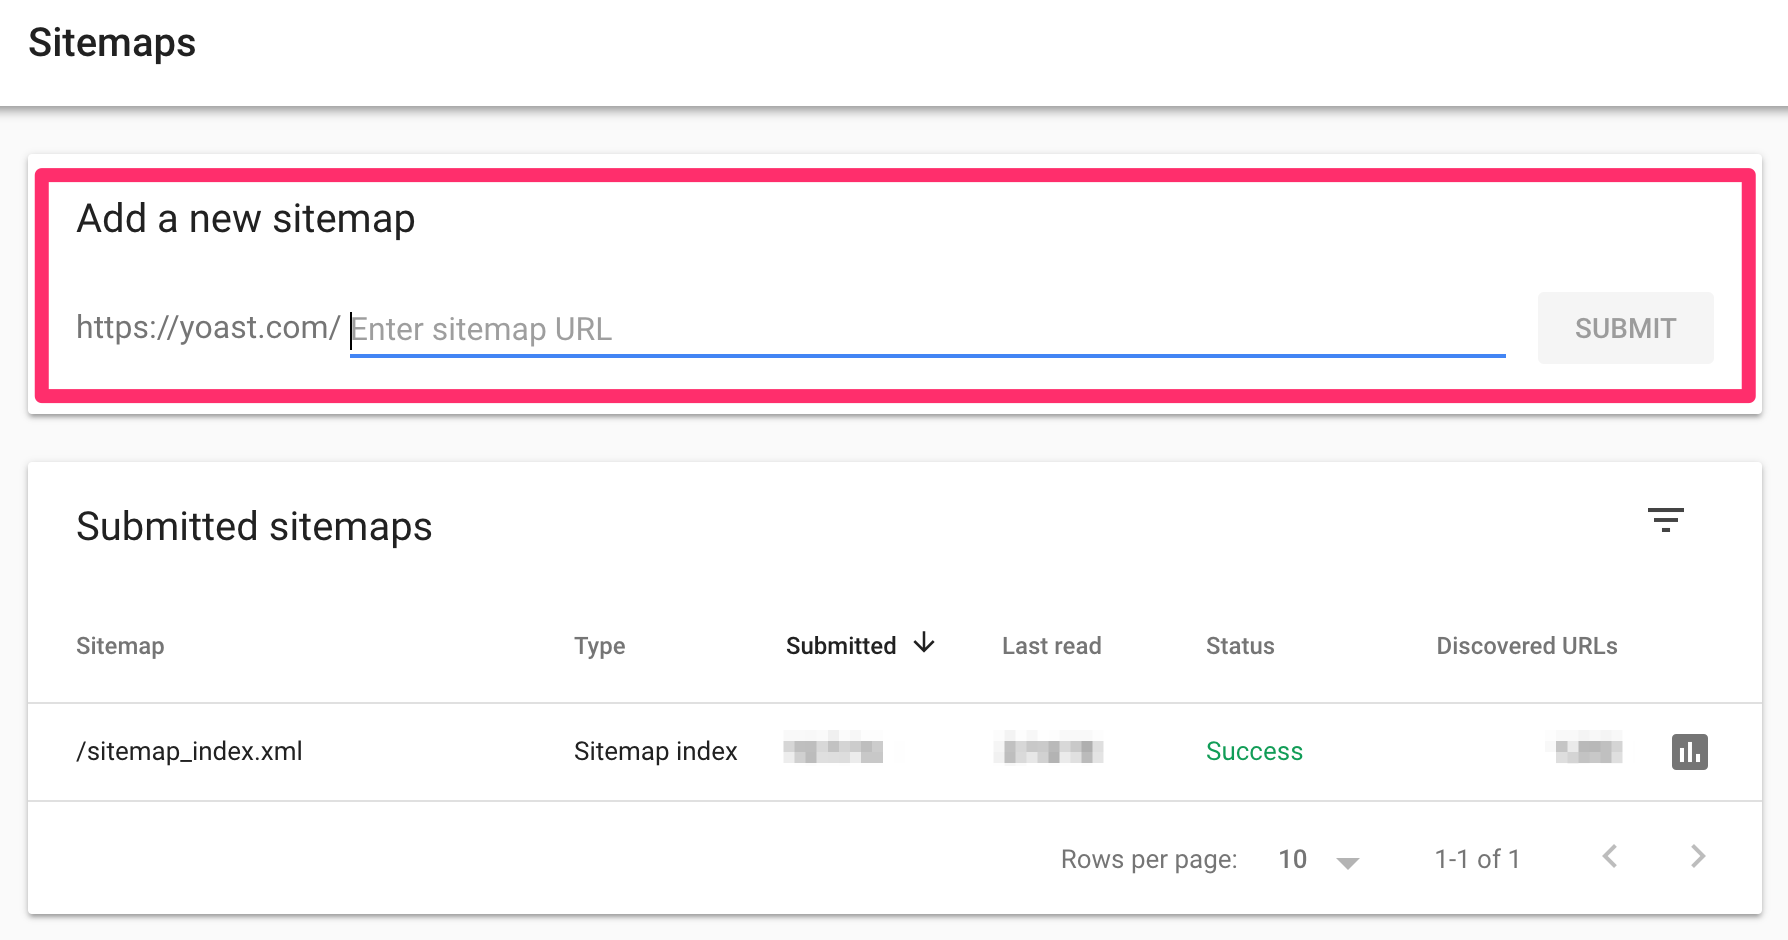
We recommend everyone entering the URL of their XML sitemap into GSC to make Google find it easily. In addition to that, you can quickly see if your sitemap gives errors or if some pages aren’t indexed, for instance. Checking this regularly, you’re sure Google can find and read your XML sitemap correctly.
We recommend regularly checking the XML sitemap section in our plugin to manage which post types or taxonomies you’re including in your sitemaps!
Links
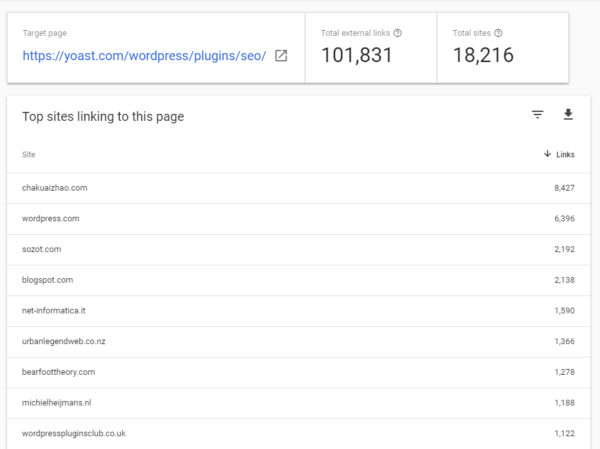
Within the links to your site section, you can see how many links from other sites are pointing to your website. Besides, you can see what websites link, how many links those websites contain to your site and lastly, what anchor texts are used most linking to your website. This can be valuable information because links still are very important for SEO.
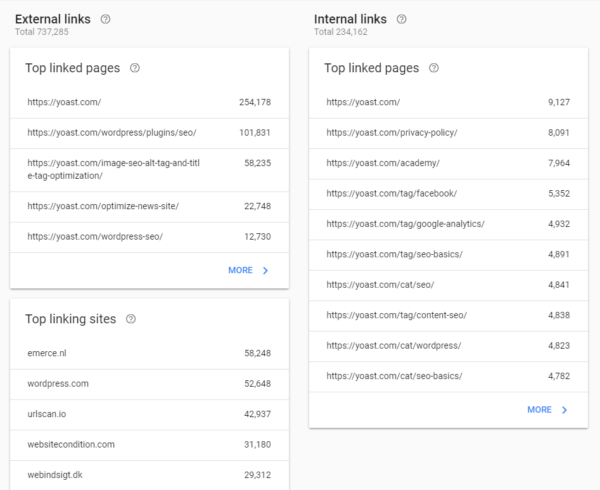
Within the internal links section, you can check what pages of your website are most linked from other spots on your site. This list can be valuable to analyze regularly because you want your most important pages and posts to get most internal links. Doing this, you make sure Google understands as well what your cornerstones are.
Mobile usability
The mobile usability tab within this section shows you usability issues with your mobile website or with specific mobile pages. Since mobile traffic is rising all over the world, we recommend checking this regularly. If your mobile site isn’t user-friendly, lots of visitors will leave it quickly.
Manual Actions
The manual actions tab is the one you don’t want to see anything in. If your site is penalized by Google, you’ll get more information in here. If your site is affected by a manual action, you’ll also get messaged via email.
There are a number of scenarios which can lead to these kinds of penalties, including:
- You have unnatural/bought links
Make sure from and to your site are valuable, not just for SEO. Preferably your links come from and link to related content that is valuable for your readers. - Your site has been hacked
A message stating your site’s probably hacked by a third party. Google might label your site as compromised or lower your rankings. - You’re hiding something from Google
If you’re ‘cloaking’ (that is, intentionally showing different to content than to users, for the purposes of decieving either of them), or using ‘sneaky’ redirects (e.g., hiding affiliate URLs), then you’re violating of Google’s Webmaster Guidelines. - Plain Spam
Automatically generated content, scraped content and aggressive cloaking could cause Google to blacklist your site. - Spammy structured markup
If you use rich snippets for too many irrelevant elements on a page, or mark up content that is hidden to the visitor, that might be considered spammy. Mark up what’s necessary, and not everything is necessary.
Missing features in the new version of Google Search Console
As you might have noticed not all features are integrated yet into the new version of Google Search Console. Google explains that this could have two reasons: they may have found a better way of presenting the data or they’re still in the process of migrating the feature to the new version. As said before, we’ll update this post when there’s progress made in the migration.
The old version of GSC is still available for everyone. So, why should you switch back to the old version once in a while? We’ll list the features that are missing in the new version, but that seems valuable to keep an eye on, below.
Search appearance
From the ‘Search appearance’ section of the old Google Search Console, we miss the following features in the new version: ‘Structured data‘, ‘Rich cards‘, ‘Data highlighter‘ and the ‘HTML improvements‘.
If you’ve added structured data to your website we recommend checking the structured data tab of the old version regularly. Here you’ll see if all structured data is recognized by Google and errors will be listed. If you’ve added structured data meant for rich cards, you can check for errors in the rich cards tab. The data highlighter can be used to markup your pages without having to code yourself. You can read more in-depth about Google Search Console and structured data here.
In the last missing feature of the search appearance tab, the HTML improvements, you can easily check, for instance, for duplicate titles or quite short titles which can be improved. These listings can be an easy pick: optimizing your titles and meta descriptions might increase your rankings and CTR.
International targeting
The international targeting tab is important for websites who have pages in different languages and who target people in different countries or regions. When you’ve implemented hreflang to your website, you can check for errors within this section of GSC.
Crawl stats
In the crawl tab, you can find the sections ‘Crawl errors’, ‘Crawl stats’, ‘Fetch as Google’, ‘Robots.txt tester’, ‘Sitemaps’ and ‘URL parameters’.
It seems that you can find some crawl errors in the new index coverage tag but if we look at our account, we don’t see all crawl errors in the new version. This means that it’s important to check your crawl errors still in the old version of GSC. When you’ve fixed a crawl error you can mark it as fixed. The crawl stats aren’t included yet so you can find those stats in the old version.
The crawl stats tell you something about how many pages are crawled per day, how many kilobytes are downloaded per day and how many time was spent downloading a page. If one of the graphs seem to decrease, you know it’s time to do something about it.
The fetch as Google feature gives you the opportunity to see if Google can access a specific page correctly, how it exactly renders the page and if there are blocked resources on the page. You can test your pages both for desktop as for mobile to see the differences between those.
The robots.txt tester is made to add your robots.txt and to test if any errors or warnings seem to appear. You can also add specific URLs to check whether they’re blocked or not.
The sitemaps are already moved to the new version of GSC so it’s time for the last feature of the crawl tab: URL parameters. In the URL Parameters section, you can add parameters for your website and ‘tell’ Google how they should be handled. If you want to use this, we recommend reading the guidelines carefully. Don’t just add some parameters to see what happens. This can cause serious problems with your site’s SEO.
Security issues
Last but not least: within the security issues tab you’ll get a notification when your website seems to have a security issue.
Do you already use Google Search Console for your website? If not, we definitely recommend creating an account so you can start collecting data about your website. Do you think something is missing? Feel free to leave a comment!
Read more: How to make your site stand out in the search results »