Have you ever wondered what drives your sales? Ecommerce businesses typically know the source of their revenue, the cost of acquisition, and whether campaigns are working.
But what if you could drill down to find specific sales drivers? Using regression analysis, a business can determine subtle causes, such as:
- The social media channel that impacts sales more.
- The amount that sales should increase after a bump in marketing spend.
- Whether free shipping or discounts contribute more to sales.
- Whether one product category should be marketed aggressively.
Regression Model
Businesses use regression models to understand how changes in a set of independent variables affect a dependent one.
For ecommerce businesses, the dependent variable is often sales. It can also be conversion rates or email signups, as examples. For this article, I’ll assume the dependent variable is sales. The independent variables could be email sends and expenditures on social media and search engine optimization, as examples. The regression model lets business owners measure, one at a time, each independent variable’s impact on sales.
In other words, a regression model can predict, say, how much a 20 percent increase in Facebook ad spend will increase sales. It can use past sales and, perhaps, weather data by date to predict how a coming storm will slow or speed sales. It can also give you an idea of the increase or decrease in sales resulting from additional email sends — a decrease would indicate subscriber annoyance.
The chart below is a representation of sales and SEO spend. This ecommerce business owner needed only sales amounts and cost of SEO to create a chart that predicts how SEO spend impacts revenue.
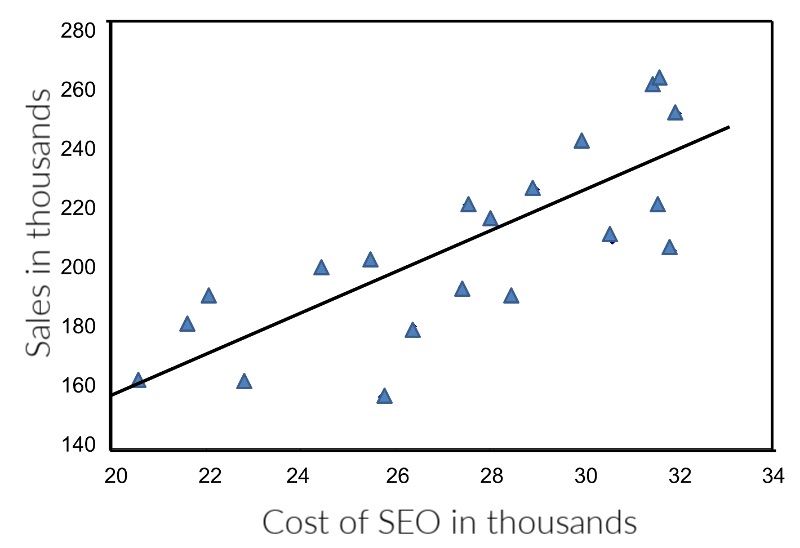
An ecommerce owner needs only historical sales and cost of SEO to predict how SEO spend impacts revenue, as depicted on this chart.
A simple regression formula could be:
Y = A+B(X)
- Y is the dependent variable — sales, email signups.
- X is the value of the independent variable — Facebook ads, email frequency.
- B is a constant that reflects how much Y changes for every value of X. (Getting an accurate number may require a mathematician or an app.)
- A is a constant that equals the value of Y when X is zero. Determine A by plugging 0 into X.
Statistical software such as SAS or IBM SPSS (or packages available for R or Python) can make this calculation simple. Plug in data about sales (the dependent variable) and a marketing or product variation (the independent variable) and it measures B and Y.
Building a Regression Model
1. Ask the right question. Before building any statistical model, understand the problem you are trying to solve. If you are looking to see why Facebook performance is down, you probably do not need a time consuming and sometimes expensive statistical model. A simple analysis will likely do the job. However, if a simple analysis does not identify why your overall sales are down and many potential variables can impact sales, a regression model is your likely solution.
2. Data collection and manipulation. The second step is usually the most critical and time-consuming. It is collecting and manipulating the data so that it’s usable. Your data should be aligned across all sources for the same period — weekly, monthly. The more data points you have, the better the model.
What are potential sources of data?
- Seasonality is one of the most critical data points. Breaking down your data by the week or the month can help explain a decline in sales.
- Industry data can be expensive, or impossible, to acquire. But the primary reason why your sales are down could have nothing to do with your marketing. It could be that consumers’ tastes have changed, and they no longer buy into your category.
- Sales data is typically used to set your Y outcome (dependent variable).
- Product information. Plug in specific product sales numbers to determine the impact on overall revenue. More research will reveal whether phasing it out is the right course.
- Marketing data. Examine marketing data by source, spend, and other factors. Pinpoint whether a specific marketing campaign or channel contributes to sales increases or declines.
- Other sources. Depending on the business, you may have additional data that can help explain sales performance. Examples are product availability, product quality, price, and so on.
3. Interpret your analysis. Hopefully, the results for your regression analysis will make sense. Suspicious or unclear results, however, indicate your work is not done. A few sub-analysis models can go deeper into causes, but you may need professional help to get to the bottom of your sales issues.
4. Take action. Insights from regressive models reduce costs and boost sales as long as you act on them.
For example, the regression model may have uncovered that running Google Ads helps drive sales, and if you increase your spend by 10 percent, you should see a 5 percent sales increase. You can test that theory by increasing your spend and tracking the results. (A regression model is an estimate and should always be tested before making large-scale changes.)
Other Tools
There are other analytical and statistical models to derive key marketing and product-development insights. However, if you are looking at what drives your sales, the regression model works well.