


Modified Transcript
Hi everyone. Today we are looking at tabletopia.com. We are going to try to figure out if we can increase this website’s amount of traffic by not moving rank, but by improving the attractiveness of its search snippets. So we are going to try to improve the CTR.
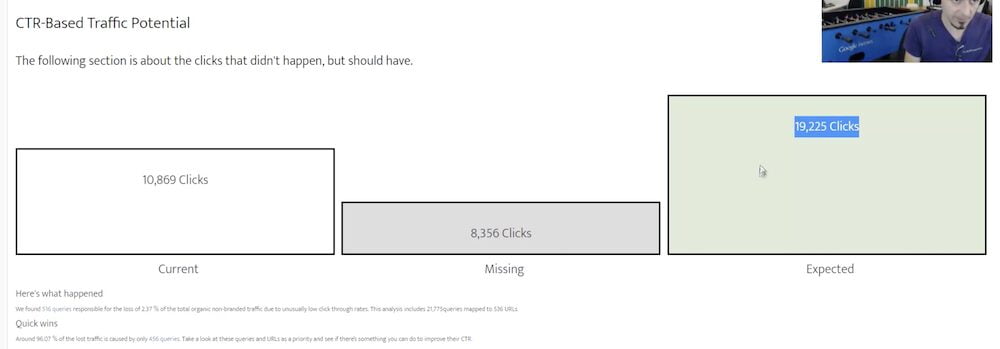
So our report took into consideration 10,000 clicks. We felt that this many were missing, and this is the number we could get up to if we reclaim all that.


How do we get to these figures? Let’s take a look at our keywords.
“Play Board Games Online”
Now, this query triggered 255 clicks over 11 URLs, with an average click-through rate of 5.27% with 4,840 impressions on an average position of 2.1. Here is the magic of what we have just discovered. We expected 12%, and we got a click-through rate of 5% instead. We have a nearly 7% click-through rate difference, and it is in a negative. So we expected 585 clicks, and we got only 255. Therefore our traffic loss is 330 clicks within the given date range.
How did we work this out? The answer is in a top. So this is the website’s CTR curve, which displays the average click-through rate for any given ranking position.


And this data is compiled across every single position, across this many keywords, and this many times that keyword appearing in the results. This is one thing we have to do in our settings to make sure that this is completely perfect. So in the keyword settings, I am going to add topia in there and hit save. Now I don’t know the conversion rate and value for this website, but I am just going to assume a 2% conversion rate and let’s say $50 value.
So let’s find the queries that have lost us the most traffic.
“Online Board Games”
We have 10 different URLs triggering this query. We have an average of 3% click-through rate on position three. That is pretty bad. You don’t really need any special report to tell you that. But let’s take a look at the expected CTR. We expected CTR of almost eight on position three, so our CTR deviation was minus 4.76. We expected one and a half thousand clicks, and we feel like we could reclaim 916 clicks if we just improved the click-through rate on this query.
So what is going on? I don’t see any sudden drop in the CTR. So what happens sometimes webmasters change the snippet, and suddenly, you can see a sharp drop in the CTR.


I don’t think that’s the case here. Tabletopia is sitting right here, and it has a fairly good snippet. Very minimal, it is very concise. I like it a lot. Now I don’t think in this case this website could have done anything to improve on this. So this is basically the reason for such a terrible click-through rate on position three for this website.
What Triggered This Featured Snippet?
So the correct strategy for Tabletopia is to take a look at pogo.com and to see what triggered this featured snippet at the top and try to overtake. So the featured snippet is coming from pogo.com, which is ranking just below them, which signals that this website is just as authoritative, if not more authoritative and relevant. But this one appears to have the type of content that fits better within the perception of Google’s featured snippet.
So let’s take a look at that. That is quite interesting. This looks more like an eCommerce setup. It is a really well-defined list.


So my recommendation in this case is to examine the HTML and the layout and compare it against a URL that comes up for Tabletopia, and see if we can in some way simulate what is going on here and create a bit of a list perception, in an attempt to overtake this position, because we know that this is the click magnet that is taking clicks away from such a good position.
This is something that we could experiment with, I suppose, to try to create a snippet that is a lot more attractive.


In fact, it is very rare that I see results so plain as this; this is where you can do something. Situations, where CTR is very difficult to optimize, is when you have carousels and knowledge panels and video results and image results, and all sorts of special search features, that sidetrack users and make the whole SERP experience nonlinear. This one is very linear, right until we get to the bottom of the results. We can see some extra special features, including this accordion.


So this one would be a prime candidate for setting up our first click-through rate experiment. Now this list is huge. We have a lot of queries to cover here. But what I have done now is just sorted this entire table by traffic loss. I’m going top-down, the biggest offenders, and I’m trying to find how do we reclaim all this lost traffic through CTR optimization. This one probably has the biggest potential in terms of the balance between the difficulty and the opportunity presented.


So I am going into my experiments, creating a new experiment. Just going to fetch this data, see if I can preload it automatically, so I don’t have to type it all up. So one thing I’m going to do for our experiment is to remove Tabletopia. Play 700 board games online for free. Does that match user intent?
“Play board games online” — we even have an incentive here free. I am not sure if I like the word sandbox. My hypothesis is that there might be some sort of limited feature. “High-quality board games to play for free.”


Now, I didn’t really think this through to a great extent. In fact, the owner of this website could probably come up with a better description. But for the sake of our presentation, I am going to go and create a new experiment.
All right. So obviously we want to enter this in the case B. So our old data is case A. The new data is case B.


So what we will be doing is comparing seven days of data with this snippet, and seven days of data with that snippet. And we will be seeing how they perform against each other. If you want to run longer experiments, you can do that. For example, set it for 30 days.
Now what needs to happen is you need to make the change that you’re proposing to make on the actual page. Make the update on the page and go to search console and request indexing (7:38). Now we just started the experiment, so all the data is blank. Obviously we can see the CTR for this keyword, for this page, on different ranking positions. And once the data starts coming through for the new one, we will see it in red, right next to the blue one. And that same information will be broken down in this area here.


So there you go. We have reviewed our keywords, we have found any deviations from the norm, and we have highlighted them as traffic loss. Now an interesting thing is that you could sort this table in a completely opposite way, and you can see where CTR is above the expectation.


So you can find cases where clicks are very high. There is one. So for this query, on position one, we are receiving CTR of 48 or 49%. And the site average is actually 20%, so we have a superb click-through rate here. What you want to do right now is understand why. And you want to find every such keyword so you can understand the rules and patterns within your titles and descriptions and structured data schema, that make pages like this and snippets like this appear super attractive to cause such an enormous click-through rate.
I am going to go and inspect this to see what is going on.


So we have rich snippets happening with a rating and the number of votes. And the one next to us shows the same thing basically, with slightly poorer ratings and fewer reviews and a price tag, which could be a deterrent actually. So it appears that if we have the ratings in place and the votes and perhaps something in the title and the description, I am not sure at this point, I am just surfacing information to the top, that makes this particular snippet very, very attractive. So what you want to do is you want to find more of those queries that have very high click-through rates.
So another thing that, if you remember, we did in our little settings section, we added the conversion rate and the goal value. So we can determine our most valuable queries in terms of the potential to deliver revenue to the website. We can do this on the basis of its current position, or movement in the rankings. So we can see that this particular query, on the basis of the data that we entered, could deliver this much revenue to the website.