Hello Moz readers,
We’re proud to bring some insights from the Wolfgang E-Commerce KPI Study 2020.
The annual study provides KPI benchmark data which allow digital marketers analyze their 2019 performance and plan their 2020. The most popular section in the report amongst Moz readers has always been the conversion correlation, where we crunch the numbers to see what sets the high-performing websites apart.
We’re privileged to count a number of particularly high-performance websites among our dataset participants. There have been over twenty international digital marketing awards won by a spread of participant websites in the last three years. In these findings, you’re getting insights from the global top tier of campaigns.
If we take a five-year look-back, we can see the conversion correlation section acts as an accurate predictor of upcoming trends in digital marketing.
In our 2016 study, the two stand-out correlations with conversion rate were:
- High-performing websites got more significantly paid search traffic than the chasing pack.
- High-performing websites got significantly more mobile traffic than the chasing pack.
The two strongest overall trends in our 2020 report are:
- It’s the first year in which paid search has eclipsed organic for website revenue.
- It’s the first year the majority of revenue has come from mobile devices.
This tells us that the majority of websites have now caught up with what the top-performing websites were doing five years ago.
So, what are the top performing websites doing differently now?
These points of differentiation are likely to become the major shifts in the online marketing mix over the next 5 years.
Let’s count down to the strongest correlation in the study:
4. Race back up to the top! Online PR and display deliver conversions
For the majority of the 2010s, marketers were racing to the bottom of the purchase funnel. More and more budget flowed to search to win exposure to the cherished searcher — that person pounding on their keyboard with their credit card between their teeth, drunk on the newfound novelty of online shopping. The only advertising that performed better than search was remarketing, which inched the advertising closer and closer to that precious purchase moment.
Now in 2020, these essential elements of the marketing mix are operating at maximum capacity for any advertiser worth their salt. Top performing websites are now focusing extra budget back up towards the top of the funnel. The best way to kill the competition on Search is to have the audience’s first search, be your brand. Outmarket your competition by generating more of your cheapest and best converting traffic, luvly brand traffic. We saw correlations with Average Order Value from websites that got higher than average referral traffic (0.34) and I can’t believe I’m going to write this, but display correlated with a conversion success metric, Average Order Value (0.37). I guess there’s a first time for everything!
3. Efficiencies of scale
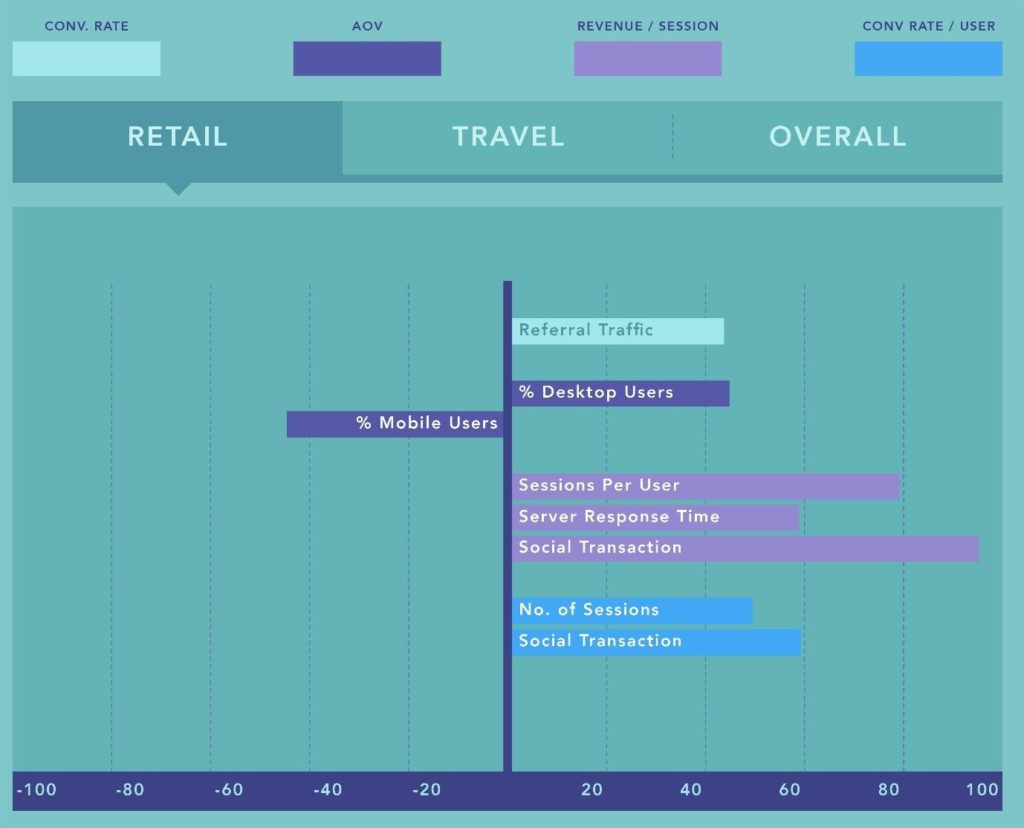
Every budding business student knows that when volume increases, cost per unit decreases. It’s called economies of scale. But what do you call it when it’s revenue per unit that’s increasing with volume? At Wolfgang, we call it efficiencies of scale. Similar to last year’s report, one of the strongest correlations against a number of the success metrics was simply the number of sessions. More visitors to the site equals a higher conversion rate per user (0.49). This stat summons the final wag for the long-tail of smaller specialist retailers. This finding is consistent across both the retail and travel sectors.
And it illustrates another reversal of a significant trend in the 2010s. The long-tail of retailers were the early settlers in the e-commerce land of plenty. Very specialist websites with a narrow product range could capture high volumes of traffic and sales.
For example, www.outboardengines.com could dominate the SERP and then affiliate link or dropship product, making for a highly profitable small business. The entrepreneur behind this microbusiness could automate the process and replicate the model again and again for the products of her choosing. Timothy Ferris’ book, The 4 Hour Work Week, became the bible to the first flush of digital nomads; affiliate conferences in Vegas saw leaning towers of chips being pushed around by solopreneur digital marketers with wild abandon.
Alas, by the end of the decade, Google had started to prioritize brands in the SERP, and the big players had finally gotten their online act together. As a result, we are now seeing significant ‘efficiencies of scale’ as described above
2. Attract that user back
What’s the key insight digital marketers need to act upon to succeed in the 2020s? Average Sessions per Visitor is 2, Average Sessions per Purchaser is 5.
In other words, the core role of the marketer is to create an elegant journey across touchpoints to deliver a person from two click prospect to five click purchaser. Any activity which increases sessions per visitor will increase conversion. Similar to last year’s report, another of the strongest and most consistent correlations was the number of Sessions per User (0.7) — which emphasizes the importance of this metric.
So where should a marketer seek these extra interactions?
Check out the strongest correlation we found with conversion success in the Wolfgang KPI Report 2020….
1. The social transaction
The three strongest conversion correlations across the 4,000 datapoints were related to social transactions. This tells us that the very top performing websites were significantly better than everybody else at generating traffic from social that purchases.
Google Analytics is astonishingly rigorous at suppressing social media success stats. It appears they would rather have an inferior analytics product than accurately track cross-device conversions and give social its due. They can track cross-device conversions in Google Ads — why not in Analytics? So, if our Google Analytics data is telling us social is the strongest conversion success factor, we need to take notice.
This finding runs in parallel with recent research by Forrester which finds one-third of CMOs still don’t know what to do with social.
Our correlation calc finds that social is the biggest point of difference between the high flyers and the chasing pack. The marketers who do know how to use social, are the tip top performing marketers of the bunch. We also have further findings on how to out-market the competition on social in the full study.
Here’s the top tier of correlations we extracted from a third of a billion euro in online revenues and over 100 million website visits:
Retail
Travel

Overall

To read more of our findings pertaining to:
- The social sweet spot
- Average conversion rates in your industry
- In-store sales benchmarked
- Why data is the new oil
- 2010 was the decade of the…
- And much, much more
Have a look at the full e-commerce KPI report for 2020. If you found yourself with any questions or anecdotes relating to the data shared here, please let us know in the comments!