Biomarkers Market Overview:
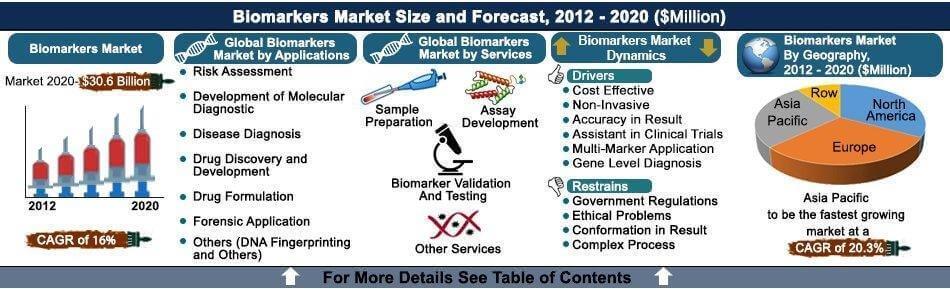
Global Biomarker Market for Diagnostic Applications is expected to garner $30.6 Billion Globally by 2020, registering a CAGR of 16% during the forecast period 2013 to 2020.
The demands of diagnostic markets are increasing. Where conventional diagnostic tools were focused on producing accurate and consistent results, today’s market demand extend to early diagnosis with accurate and consistent results. There are significant challenges in presenting accurate results in the early stage of diseases, especially in case of cancer.
Diagnostic biomarkers are minimally or non-invasive tools. Biomarkers, integrated with key imaging and data management technologies, is meeting the market expectations; however, has set backs too. Biomarkers are used in imaging technology to provide clear imaging of oncology tumors and other problems and also eliminate chance of radiation exposure during imaging through CT scan and MRI scan.
Omics, proteomics, meta-bolomics technologies are used in biomarkers discovery and disease diagnosis. Biomarkers are used in risk assessment, molecular diagnostic, disease diagnosis, DNA fingerprinting and other molecular applications. Biomarkers enable pharmaceutical companies to analyze and discover novel drugs as demand for cost effective and efficient treatment dose is increasing. Biomarkers are used in drug validation and testing, sample preparation and assay development to eliminate complexity in discovery and development of novel drugs.
The biomarker market in this report includes the application of biomarkers in the diagnosis (molecular diagnosis and disease diagnosis), drug validation, drug development, risk assessment, drug formulation and forensic applications. Technologies that immensely make use of biomarkers such as Omics, imaging technologies, bioinformatics and personalized medicines are also included in the study. The report however excludes the application of biomarkers in the clinical trials, research and other environment biomarkers. This report focuses keenly on the market assessment of diagnostic biomarkers across its extensive application segments.
Segment Review:
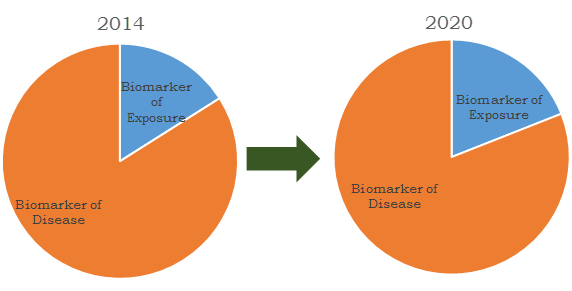
Diagnostic biomarkers are divided in two major types which include biomarkers of exposure and biomarker of disease. Biomarkers of exposure are an emerging technology of identifying the hazardous chemical level in individual body. These biomarkers enable the diagnosis of abnormal activities to calculate the pre-disease condition. Biomarkers of disease are used in identification of disease condition and also help in validation of clinical trials for novel drug.
Biomarkers market revenues share by segment, 2012 and 2020
Get more information on this report : Request Sample Pages
Diagnostic biomarker market is growing with development of technologies in clinical laboratory tests, imaging exams, and in recent years biomarker tests are impacting the clinical management of patients. Biomarkers are identified conventionally by analyzing the science of pathophysiology and epidemiology, which derive insensitive and nonspecific markers. Diagnostic biomarker technology is expected to transform the scenario of clinical research, medical practice and drug development, as technological advances are changing from conventional approach of pathophysiology/epidemiology to biomarker studies such as genomics and proteomic. The amount of information provided by the biomarker helps in pharmaceutical drug development, diagnosis of critical diseases, and in clinical trial of drugs. The diagnostic biomarker technology provides simple diagnostic treatments to pathologists to perform faster, accurate disease identification, which enables physician to prescribe better treatments for those diseases.
Though as on today there are immense developments in infrastructure for data sharing and analysis such as bioinformatics, the utility is not to its best. Furthermore, there is no standard regulatory framework globally. For example, countries in the European Union and other regions have their own set of regulations, which may be a bigger challenge in conducting transnational research and data sharing. However, the role of biomarkers is increasing with its crucial application in diagnosis of fatal diseases such as cancer and cardiovascular diseases. Biomarkers in these cases enable early diagnosis and are of immense importance in designing effective treatments and progress. Reimbursement issues are being solved with the intervention of regulatory authorities, which is expected to propel the growth of the market for diagnosis at commercial level.
Get more information on this report : Request Sample Pages
Asia Pacific Market Review:
Heart diseases are the leading cause of death in worldwide and Asia Pacific has the significant share especially in coronary heart disease. Diagnosis for cardiovascular disease is done through conventional methods such as clinical observation, electrocardiogram (ECG) findings. According to data published by ministry of health in China, about 203 million people are suffering from cardiovascular diseases and this number is expected to increase by 73% in 2030. Projected trends in blood pressure, increased cholesterol and active smoking are also increase the number of CVD by an additional 23% which denotes 21.3 million cardiovascular events. Demographic changes such as aging population and lesser younger people is the main driver for increased CVD disease. Biomarker market is expected to increase its presence as biopharmaceutical companies are investing more in Asian countries for drug discovery and development since market for health care process is more in Asia Pacific region. Application of biomarkers in drug discovery and development process, personalized medicine, molecular diagnosis, and diagnosis of other diseases are increases the interest of research based pharmaceutical company to develop novel biomarkers.
KEY BENEFITS OF THE REPORT
- The report offers an assessment and ranking of the factors that favor the biomarkers market growth and those factors which act as a hindrance for the growth of the market
- Forecast period for estimating market size is from 2013 to 2020. Two historic years include 2011 and 2012
- The report identifies top investment pockets and offers an analysis of top winning strategies for diagnostic biomarker industry.
- The report analyses the various strategies adopted by some of the key companies in the industry.
- The report tracks and analyses key innovations and patents for biomarkers in the last five years
BIOMARKERS MARKET KEY SEGMENTS
Diagnostic Biomarkers Market is segmented as follows:
BY TYPES
- Biomarker of Exposure
- Biomarker of Diseases
BY APPLICATIONS
- Risk Assessment
- Development of Molecular Diagnostic
- Disease Diagnosis
- Drug Discovery and Development
- Drug Formulation
- Forensic Application
- Others (DNA Fingerprinting and Others)
BY SERVICES
- Sample Preparation
- Assay Development
- Biomarker Validation and Testing
- Other Services
BY GEOGRAPHY
- North America
- Europe
- Asia-Pacific
- Row (Rest of World)
KEY AUDIENCES
- Pharmaceutical companies
- Government & Private research institutes
- Academic institutes
- Medical device manufacturing companies
CHAPTER 1 INTRODUCTION
1.1 Scope and Coverage
1.2 Report Description
CHAPTER 2 EXECUTIVE SUMMARY
2.1 Biomarker Diagnosis Vs. Conventional Diagnosis
2.2 Why Diagnostic Biomarkers are Used in Diagnosis and Drug Development?
CHAPTER 3 MARKET OVERVIEW
3.1 Key Application of Diagnostic Biomarkers in Top Technologies
3.1.1 Omics Technology
3.1.1.1 Applications of Omics Technology
3.1.1.1.1 Lung Disease Identification
3.1.1.1.2 Quantifying Abnormalities
3.1.1.1.3 Genetic Trait Diagnosis
3.1.1.1.4 Analyzing Drug Efficiency
3.1.1.1.5 Functional Food Development
3.1.1.1.6 Pharmacogenomics
3.1.1.1.7 Drivers
3.1.1.1.8 Restraints
3.1.1.1.8.1 Lengthy Process
3.1.1.1.8.2 Ethical Problems
3.1.1.1.8.3 Sample Collection
3.1.1.1.8.4 Gene Expression
3.1.1.1.8.5 Inefficiency in Pre-Disease Identification
3.1.2 Imaging Technology
3.1.2.1 Application of Diagnostic Imaging Technology
3.1.2.2 Drivers
3.1.2.2.1 Faster Test Result
3.1.2.2.2 Improved Nursing Services
3.1.2.2.3 Noninvasive Technique
3.1.2.3 Restraints
3.1.2.3.1 Radiation Effect
3.1.2.3.2 Complex Process
3.1.2.3.3 Genetic Variation
3.1.2.4 Trends
3.1.3 Bioinformatics
3.1.3.1 Applications of Bioinformatics
3.1.3.2 Drivers
3.1.3.2.1 Open Source of Information
3.1.3.2.2 Relevant Information
3.1.3.2.3 Forecasting of Information
3.1.3.3 Restraints
3.1.3.3.1 Difficulty in Practical Application
3.1.3.3.2 Over-Fitting
3.1.3.3.3 Complex Operation Process
3.1.3.3.4 Security Issue
3.1.3.3.5 Costly Management
3.1.3.3.6 Virtual Storage
3.1.4 Personalized Medicines
3.1.4.1 Drivers
3.1.4.1.1 Unique Solution
3.1.4.1.2 Minimal Invasive
3.1.4.1.3 Reduction in Failure
3.1.4.1.4 Effective Prescription
3.1.4.2 Restraints
3.1.4.2.1 Need Specialized Setup for Treatment
3.1.4.2.2 Liability Issue
3.1.4.2.3 Ethical Question
3.1.5 Others (Nutritional Technology)
3.2 Importance of Non-Invasive Diagnostics
3.3 Key Advantages of Dm
3.4 Regulatory Scenario
3.5 Reimbursement Issues
3.6 Key Patents and Analysis
3.7 Top Ten Factors Impacting DBM Market
3.7.1 Non-Invasive Technique
3.7.2 Drug Discovery and Development
3.7.3 Cost Effective Tool for Diagnosis
3.7.4 Multi-Marker Application
3.7.5 Accuracy and Reliability
3.7.6 Ethical Issues
3.7.7 Gene Level Diagnosis
3.7.8 Complex Processes
3.7.9 Government Regulations
3.7.10 Reimbursement Issues
3.8 Top Investment Pockets
3.9 Market Intelligence
3.9.1 Top Three Winning Strategies
3.9.1.1 Product Launch
3.9.1.2 Collaboration and Agreement
3.9.1.3 Merger and Acquisition
3.10 Market Dynamics
3.10.1 Drivers
3.10.1.1 Cost Effective
3.10.1.2 Non-Invasive
3.10.1.3 Accuracy in Result
3.10.1.4 Assistant in Clinical Trials
3.10.1.5 Multi-Marker Application
3.10.1.6 Gene Level Diagnosis
3.10.2 Restrains
3.10.2.1 Government Regulation
3.10.2.2 Ethical Problems
3.10.2.3 Conformation in Result
3.10.2.4 Complex Process
3.10.3 Opportunity
3.10.3.1 Local Market
3.10.3.2 Personalized Medicine
3.10.3.3 Tissue Specific Treatment
CHAPTER 4 GLOBAL DIAGNOSTIC BIOMARKERS MARKET BY TYPES, 2013-2020, $MILLION
4.1 Biomarker of Exposure
4.2 Biomarkers of Disease
CHAPTER 5 GLOBAL DIAGNOSTIC BIOMARKERS MARKET BY APPLICATIONS, 2013-2020, $MILLION
5.1 Risk Assessment
5.1.1 Applications
5.1.1.1 Oncology Treatment
5.1.1.2 Cardiovascular Treatment
5.1.2 Drivers
5.1.2.1 Forecasting of Abnormal Conditions
5.1.2.2 Cost Effective
5.1.3 Restraints
5.1.3.1 Government Regulations
5.1.3.2 Ethical Issues
5.2 Development of Molecular Diagnostic
5.2.1 Application
5.2.1.1 Prenatal Diagnostics
5.2.1.2 Human Clinical Molecular Diagnostic Testing
5.2.1.3 Veterinary Molecular Diagnostic Testing
5.2.1.4 Identity Testing
5.2.1.5 Histocompatibility Testing
5.2.2 Drivers
5.2.2.1 Uniformity in Test Result
5.2.2.2 Cost Effective
5.2.2.3 Fast Result
5.2.2.4 More Profitable
5.2.2.5 Automation
5.2.3 Restraints
5.2.3.1 Not Applicable for Twins Genomes
5.2.3.2 Government Regulations
5.2.3.3 Ethical Issues
5.3 Disease Diagnosis
5.3.1 Oncology
5.3.1.1 Drivers
5.3.1.2 Restraints
5.3.1.2.1 Complex Process
5.3.1.2.3 Used for Early Diagnosis Only
5.3.2 Cardiology
5.3.2.1 Application
5.3.2.2 Drivers
5.3.2.2.1 Cost Effective
5.3.2.2.2 Tissue Specific
5.3.2.2.3 Accurate Result
5.3.2.3 Restraints
5.3.2.3.1 Loss of Specificity
5.3.2.3.2 Low Specificity
5.3.2.3.3 Low Sensitivity
5.3.3 Neurology
5.3.3.1 Application
5.3.3.2 Drivers
5.3.3.2.1 Relevant Information
5.3.3.2.2 Efficient Diagnosis
5.3.3.2.3 Assistant in Clinical Trials
5.3.3.3 Restraints
5.3.3.3.1 Complex Process
5.3.3.3.2 Chromosomal Variation
5.3.3.3.3 Hurdles in Tracking
5.3.3.4 Alzheimers
5.3.3.5 Multiple Sclerosis
5.3.3.6 Parkinson’s Disease
5.3.3.7 Others (Renal Diseases, Urinal Disease)
5.4 Drug Discovery and Development
5.4.1 Application
5.4.2 Drivers
5.4.2.1 Increased Efficiency
5.4.2.2 High Quality Support
5.4.2.3 Cost Effective
5.4.2.4 Collaboration for Novel Development
5.4.3 Restraints
5.4.3.1 Drug Metabolism
5.4.3.2 Stability of Biomarkers
5.4.3.3 Complex Process
5.5 Drug Formulation
5.5.1 Application
5.5.2 Drivers
5.5.3 Restraint
5.6 Forensic Application
5.7 Others (Dna Fingerprinting and Others)
5.7.1 Blood Alcohol Concentration Biomarker
5.7.2 Dna Fingerprinting
CHAPTER 6 GLOBAL DIAGNOSTIC BIOMARKERS MARKET BY SERVICES, 2013-2020, $MILLION
6.1 Sample Preparation
6.1.1 Application
6.1.1.1 Biological Mass Spectrometry
6.1.2 Drivers
6.1.2.1 Cost Effective
6.1.2.2 Sample Rigidity
6.1.2.3 Efficient Forensic Studies
6.1.3 Restraints
6.1.3.1 Complex Structure
6.1.3.2 Lack of Effectiveness
6.1.3.3 Extensive Fractionation
6.1.3.4 Loss of Biological Compounds
6.2 Assay Development
6.2.1 Application
6.2.1.1 Clinical Trials
6.2.1.2 Drug Development and Validation
6.2.1.3 Others
6.2.2 Drivers
6.2.2.1 Accuracy
6.2.2.2 Cost Effective
6.2.2.3 imely Result
6.2.3 Restraints
6.2.3.1 Complexity in Technique
6.2.3.2 Tissue Specific
6.3 Biomarker Validation and Testing
6.3.1 Drivers
6.3.1.1 Reduce Failure Rate
6.3.2 Restraints
6.3.2.1 Clinical Errors
6.3.2.2 Time Consuming
6.4 Other Services
CHAPTER 7 GLOBAL DIAGNOSTIC BIOMARKERS MARKET BY GEOGRAPHY, 2013-2020, $MILLION
7.1 North America
7.2 Europe
7.3 Asia-Pacific
7.4 Row (Rest of World)
CHAPTER 8 COMPETITIVE LANDSCAPE
8.1 Product Launch
8.1.1 Recent Development
8.2 Collaboration and Partnership
8.2.1 Recent Development
8.3 Clearance and Approval
8.3.1 Recent Development
8.4 Mergers and Acquisition
8.4.1 Recent Development
CHAPTER 9 COMPANY PROFILES
9.1 Abbott Laboratories, Inc.
9.1.1 Company Overview
9.1.2 Company Snapshot
9.1.3 Business Performance
9.1.4 Strategic Moves and Developments
9.1.4.1 Principal Strategies
9.1.4.2 Secondary Strategies
9.1.5 Swot Analysis & Strategic Conclusions
9.2 Agilent Technologies Inc.
9.2.1 Company Overview
9.2.2 Company Snapshot
9.2.3 Business Performance
9.2.4 Strategic Moves and Developments
9.2.4.1 Primary Strategies
9.2.4.2 Secondary Strategies
9.2.5 Swot Analysis & Strate
9.3 Aushon Biosystem
9.3.1 Company Profile
9.3.2 Company Snapshot
9.3.3 Strategic Moves and Developments
9.3.3.1 Primary Strategies
9.3.3.2 Secondary Strategies
9.3.4 Swot Analysis & Strategic Conclusions
9.4 Bio-Rad Laboratories
9.4.1 Company Profile
9.4.2 Company Snapshot
9.4.3 Business Performance
9.4.4 Strategic Moves and Developments
9.4.4.1 Primary Strategies
9.4.4.2 Secondary Strategies
9.4.5 Swot Analysis & Strategic Conclusions
9.5 Eisai Co. Ltd.
9.5.1 Company Profile
9.5.2 Company Snapshot
9.5.3 Business Performance
9.5.4 Strategic Moves and Developments
9.5.4.1 Primary Strategies
9.5.4.2 Secondary Strategies
9.5.5 Swot Analysis & Strategic Conclusions
9.6 Epistem Ltd.
9.6.1 Company Profile
9.6.2 Company Snapshot
9.6.3 Business Performance
9.6.4 Strategic Moves and Developments
9.6.4.1 Primary Strategies
9.6.4.2 Secondary Strategies
9.6.5 Swot Analysis & Strategic Conclusions
9.7 Ge Healthcare
9.7.1 Company Profile
9.7.2 Company Snapshot
9.7.3 Business Performance
9.7.4 Strategic Moves and Developments
9.7.4.1 Principle Strategies
9.7.4.2 Secondary Strategies
9.7.5 Swot Analysis & Strategic Conclusions
9.8 Roche Diagnostics Limited
9.8.1 Company Profile
9.8.2 Company Snapshot
9.8.3 Business Performance
9.8.4 Strategic Moves and Developments
9.8.4.1 Principal Strategies
9.8.4.2 Secondary Strategies
9.8.5 Swot Analysis & Strategic Conclusions
9.9 Siemens AG
9.9.1 Company Profile
9.9.2 Company Snapshot
9.9.3 Business Performance
9.9.4 Strategic Moves and Developments
9.9.4.1 Primary Strategies
9.9.4.2 Secondary Strategies
9.9.5 Swot Analysis & Strategic Conclusions
9.10 Thermo Fisher Scientific Inc.
9.10.1 Company Profile
9.10.2 Company Snapshot
9.10.3 Business Performance
9.10.4 Strategic Moves and Developments
9.10.4.1 Primary Strategies
9.10.4.2 Secondary Strategies
9.10.5 Swot Analysis & Strategic Conclusions
LIST OF TABLES:
TABLE 1 GLOBAL DIAGNOSTIC BIOMARKERS MARKET BY REVENUE 2011-2020 ($MILLION)
TABLE 2 GLOBAL DIAGNOSTIC BIOMARKERS MARKET BY APPLICATION 2011-2020 ($MILLION)
TABLE 3 GLOBAL DIAGNOSTIC BIOMARKERS MARKET FOR TECHNOLOGY 2011-2020 ($MILLION)
TABLE 4 DIAGNOSTIC BIOMARKER APPLICATION MARKET 2011-2020 ($MILLION)
TABLE 5 DIAGNOSTIC BIOMARKER APPLICATION MARKET 2011-2020 ($MILLION)
TABLE 6 GLOBAL MARKET OF IMAGING TECHNOLOGY 2011-2020 ($MILLION)
TABLE 7 GLOBAL MARKET OF BIOINFORMATICS 2011-2020 ($MILLION)
TABLE 8 GLOBAL MARKET OF PERSONALIZED MEDICINE 2011-2020 ($MILLION)
TABLE 9 GLOBAL MARKET OF OTHER DISEASES 2011-2020 ($MILLION)
TABLE 10 BIOMARKERS MARKET BY TYPES IN 2011-2020 ($MILLION)
TABLE 11 GLOBAL MARKET FOR BIOMARKERS OF EXPOSURE IN 2011-2020 ($MILLION)
TABLE 12 GLOBAL MARKET FOR BIOMARKERS OF EXPOSURE IN 2011-2020 ($MILLION)
TABLE 13 DIAGNOSTIC BIOMARKER APPLICATION MARKET IN 2011-2020 ($MILLION)
TABLE 14 GLOBAL DIAGNOSTIC BIOMARKERSMARKET APPLICATION MARKET IN 2011-2020 ($MILLION)
TABLE 15 GLOBAL DIAGNOSTIC BIOMARKERS MARKET OF RISK ASSESSMENT IN 2011-2020 ($MILLION)
TABLE 16 GLOBAL DIAGNOSTIC BIOMARKERS MARKET FOR DEVELOPMENT OF MOLECULAR DIAGNOSTIC IN 2011-2020 ($MILLION)
TABLE 17 DIAGNOSTIC BIOMARKERS MARKET OF DISEASE DIAGNOSIS IN 2011-2020 ($MILLION)
TABLE 18 GLOBAL MARKET FOR DEVELOPMENT OF MOLECULAR DIAGNOSTIC IN 2011-2020 ($MILLION)
TABLE 19 GLOBAL MARKET OF CARDIOLOGY DIAGNOSIS IN 2011-2020 ($MILLION)
TABLE 20 GLOBAL MARKET OF CARDIOLOGY DIAGNOSIS IN 2011-2020 ($MILLION)
TABLE 21 GLOBAL MARKET OF NEUROLOGY DIAGNOSIS IN 2011-2020 ($MILLION)
TABLE 22 DIAGNOSTIC BIOMARKERS MARKET FOR NEUROLOGY DISEASE DIAGNOSIS IN 2011-2020 ($MILLION)
TABLE 23 GLOBAL DIAGNOSTIC BIOMARKERS MARKET OF OTHER DISEASE DIAGNOSIS IN 2011-2020 ($MILLION)
TABLE 24 GLOBAL DIAGNOSTIC BIOMARKERS MARKET OF OTHER DISEASE DIAGNOSIS IN 2011-2020 ($MILLION)
TABLE 25 GLOBAL DIAGNOSTIC BIOMARKERS MARKET OF DRUG FORMULATION IN 2011-2020 ($MILLION)
TABLE 26 GLOBAL DIAGNOSTIC BIOMARKERS MARKET OF FORENSIC APPLICATION IN 2011-2020 ($MILLION)
TABLE 27 GLOBAL DIAGNOSTIC BIOMARKERS MARKET OF OTHER DISEASES IN 2011-202 ($MILLION)
TABLE 28 DIAGNOSTIC BIOMARKERS MARKET OF SERVICES IN 2011-202($MILLION)
TABLE 29 GLOBAL MARKET OF SERVICES IN 2011-2020 ($MILLION)
TABLE 30 GLOBAL MARKET OF SAMPLE PREPARATION IN 2011-2020 ($MILLION)
TABLE 31 GLOBAL MARKET OF ASSAY DEVELOPMENT IN 2011-2020 ($MILLION)
TABLE 32 GLOBAL MARKET OF BIOMARKER VALIDATION IN 2011-2020 ($MILLION)
TABLE 33 GLOBAL MARKET OF OTHER SERVICES IN 2011-2020 ($MILLION)
TABLE 34 GLOBAL MARKET IN 2011-2020 ($MILLION)
TABLE 35 TYPES OF DEVELOPMENTS FROM 2013-2010
TABLE 36 RECENT DEVELOPMENT IN PRODUCT LAUNCH
TABLE 37 PRODUCT LAUNCHES FROM 2013-2010
TABLE 38 COLLABORATION AND PARTNERSHIP
TABLE 39 PARTNERSHIP AND COLLABORATION FROM 2013-2010
TABLE 40 RECENT DEVELOPMENT IN CLEARANCE AND APPROVAL
TABLE 41 DIAGNOSTIC BIOMARKER APPROVAL AND CLEARANCE FROM 2013-2010
TABLE 42 RECENT DEVELOPMENT IN MERGERS AND ACQUISITION
TABLE 43 MERGER AND ACQUISITION FROM 2013-2010
TABLE 44 ABBOTT LABORATORIES BUSINESS SNAPSHOT
TABLE 45 AGILENT TECHNOLOGIES INC. BUSINESS SNAPSHOT
TABLE 46 AUSHON BIOSYSTEM BUSINESS SNAPSHOT
TABLE 47 BIO-RAD LABORATORIES BUSINESS SNAPSHOT
TABLE 48 EISAI CO. LTD BUSINESS SNAPSHOT
TABLE 49 EPISTEM COMPANY BUSINESS SNAPSHOT
TABLE 50 GE HEALTHCARE BUSINESS SNAPSHOT
TABLE 51 ROCHE DIAGNOSTICS LIMITED BUSINESS SNAPSHOT
TABLE 52 SIEMENS INC. BUSINESS SNAPSHOT
TABLE 53 THERMO FISHER SCIENTIFIC INC. BUSINESS SNAPSHOT
LIST OF FIGURES:
FIG. 1 PATENTS APPLICATION FILLED BY GENERAL ELECTRICAL FOR IMAGING TECHNOLOGY IN INDIA (2012)
FIG. 2 SPIDER-CHART FOR CHANGES IN KEY ADVANTAGES FROM 2013-2020
FIG. 3 EXPECTED GROWTH OF BIOMARKERS APPLICATION FOR CANCER TESTING
FIG. 4 PATENT ANALYSIS BY GEOGRAPHY 2013
FIG. 5 TOP 10 KEY STRATEGIES SPIDER CHART 2012-2020
FIG. 6 EXPECTED GROWTH IN CAGR FROM 2011-2020 FOR DIAGNOSTIC BIOMARKER TECHNOLOGY
FIG. 7 EXPECTED GROWTH IN CAGR FROM 2011-2020 FOR DIAGNOSTIC BIOMARKERS IN APPLICATION
FIG. 8 EXPECTED GROWTH IN CAGR FROM 2011-2020 FOR DIAGNOSTIC BIOMARKERS IN SERVICES
FIG. 9 TOP 3 WINING STRATEGIES FROM 2012-2020
FIG. 10 TOP 10 COUNTRIES IN CANCER POPULATION (PER 100,000 PEOPLE) 2011
FIG. 11 CANCER STATISTICS FOR ESTIMATED NEW CASES AND DEATHS IN U.S. FOR 2012
FIG. 12 LEADING CAUSES OF MORTALITY IN U.S. 2012
FIG. 13 COST ON ALZHEIMER`S DISEASE TO U.S. IN 2013 (IN BILLION)
FIG. 14 ESTIMATED DEATHS VS. ESTIMATED CASES IN DIFFERENT TYPES OF CANCER IN NORTH AMERICA 2013
FIG. 15 DEVELOPMENTAL STRATEGIES ADOPTED FROM 2013-2010
FIG. 16 DIAGNOSTIC BIOMARKER PRODUCT LAUNCH BY COMPANIES FROM 2013-2010
FIG. 17 PARTNERSHIP AND COLLABORATION OF COMPANIES FROM 2013-2010
FIG. 18 CLEARANCE AND APPROVAL OF TOP 5 COMPANIES FROM 2013-2010
FIG. 19 MERGERS AND ACQUISITION FROM 2013-2010
FIG. 20 ABBOTT LABORATORIES, INC. FINANCIAL REVENUES BY BUSINESS UNITS (2012)
FIG. 21 ABBOTT LABORATORIES, INC. FINANCIAL REVENUES BY GEOGRAPHY (2012)
FIG. 22 SWOT ANALYSIS OF ABBOTT LABORATORIES
FIG. 23 AGILENT TECHNOLOGIES INC. FINANCIAL REVENUES BY BUSINESS UNITS (2012)
FIG. 24 AGILENT TECHNOLOGIES INC. FINANCIAL REVENUES BY GEOGRAPHY (2012)
FIG. 25 SWOT ANALYSIS OF AGILENT TECHNOLOGIES
FIG. 26 SWOT ANALYSIS OF AUSHON BIOSYSTEM
FIG. 27 BIO-RAD LABORATORIES FINANCIAL REVENUES BY BUSINESS UNITS (2012)
FIG. 28 BIO-RAD LABORATORIES FINANCIAL REVENUES BY GEOGRAPHY (2012)
FIG. 29 SWOT ANALYSIS OF BIO-RAD LABORATORIES
FIG. 30 EISAI CO. LTD FINANCIAL REVENUES BY BUSINESS UNITS (2012)
FIG. 31 EISAI CO. LTD FINANCIAL REVENUES BY GEOGRAPHY (2012)
FIG. 32 SWOT ANALYSIS OF EISAI CO. LTD
FIG. 33 EPISTEM FINANCIAL REVENUES BY BUSINESS UNITS (2012)
FIG. 34 EPISTEM FINANCIAL REVENUES BY GEOGRAPHY (2012)
FIG. 35 SWOT ANALYSIS OF EPISTEM
FIG. 36 GE HEALTHCARE FINANCIAL REVENUES BY BUSINESS UNITS (2012)
FIG. 37 GE HEALTHCARE FINANCIAL REVENUES BY GEOGRAPHY (2012)
FIG. 38 SWOT ANALYSIS GE HEALTHCARE
FIG. 39 ROCHE DIAGNOSTICS LIMITED FINANCIAL REVENUES BY BUSINESS UNITS (2012)
FIG. 40 ROCHE DIAGNOSTICS LIMITED FINANCIAL REVENUES (DIAGNOSTIC DIVISION) BY GEOGRAPHY (2012)
FIG. 41 SWOT ANALYSIS OF ROCHE DIAGNOSTICS LIMITED
FIG. 42 SIEMENS INC. FINANCIAL REVENUES BY BUSINESS UNITS (2012)
FIG. 43 SIEMENS INC. FINANCIAL REVENUES BY GEOGRAPHY (2012)
FIG. 44 SWOT ANALYSIS OF SIEMENS
FIG. 45 THERMO FISHER SCIENTIFIC INC. FINANCIAL REVENUES BY BUSINESS UNITS (2012)
FIG. 46 THERMO FISHER SCIENTIFIC INC. FINANCIAL REVENUES BY GEOGRAPHIC AREAS (2012)
FIG. 47 SWOT ANALYSIS OF THERMO FISHER SCIENTIFIC INC.