For some companies, churn is like cholesterol…
A silent killer without any visible symptoms.
Learn some quick and easy methods you can use to get a handle on your business’s churn rate.
You may not even realize you have a problem until your new customer acquisition flatlines, and suddenly it becomes obvious that your current customers are jumping ship at an alarming rate.
Now, I don’t want to scare you for no reason here. Your business is probably NOT about to have an unexpected heart attack.
But churn rate IS an important metric that you DO need to monitor over time. (Just like cholesterol.)
And when you understand how to measure and manipulate churn, you can use that data to do some really cool stuff.
In this post, you’ll learn some quick and easy methods you can use to get a handle on your business’s churn rate—without hiring an expensive data analyst and without spending hours mired in math problems.
By the time you’re done reading, you’ll know how to use easy “napkin math” to calculate vital business metrics like your churn rate, retention rate, average customer value, and more—data you can use to help you make smarter business decisions and improve customer retention rates.
Churn 101: The Basics of Customer Attrition
Let’s start with a really basic question: What is churn?
The most common way of describing churn looks like this:

Just in case this is a new idea, here’s the quick breakdown. Your business is the bucket. And that bucket has holes in it—small inefficiencies or friction points that result in a loss of water.
The water inside the bucket typically represents the people who are constituents of your company—your customers, leads, email subscribers, etc. But you can also think of the water as your current and potential revenue.
So, you’re constantly losing water over time through these holes. But, of course, you’re also adding new water to the bucket, too, by building your email list and acquiring new customers.
Churn, then, is how you measure the rate at which the water leaves the bucket.
Who Does Churn Affect?
Churn is a really big deal for companies with a subscription product—like SaaS companies and any sort of recurring service like gyms, memberships, and anything else that bills on a regular basis like Birchbox or Netflix.
But churn doesn’t just happen with recurring services. It affects every company in some way or another.
In fact, churn is a perfectly natural part of every business. Nobody who joins your email list will stay forever. Nobody who buys your membership product will stay a customer forever. You’re always going to have people coming in and people leaving.
The goal is not to reach 0% churn. After all, your product, your service, and your message are not always going to be relevant to everyone. And people evolve over time—sooner or later most people will reach a point where your message no longer applies to them the way it once did.
But that doesn’t mean you can ignore churn. Far from it! Because even though some churn is natural, too much churn can be a HUGE problem for your business.
“The Dreaded Plateau” (AKA The Danger of Too Much Churn)
First, it’s important to realize that churn is cumulative.
Warning: We’re going to venture out of the shallow waters of the “math pool” to discuss this, but it’s a key concept for understanding churn.
This is an unavoidable truth because as your membership gets bigger and bigger, churn will start taking out more and more of those people.
Let’s say you run a promotion and you get 100 new subscribers to your membership site. And over the next month, maybe 12 of them leave. Does that mean the other 88 will stay forever?
No, of course not.
Over time, more and more of those people will leave. Some will leave quickly, and others might stay for years. But eventually, all 100 of them will cancel.
Of course, you don’t just add 100 new customers and then stop working, do you?
No!
You’re always working to acquire new customers, to put more water into the bucket.
But over time, more and more of that water starts leaking out—until you can’t get the bucket any fuller than it already is. I call this the point “the plateau.”
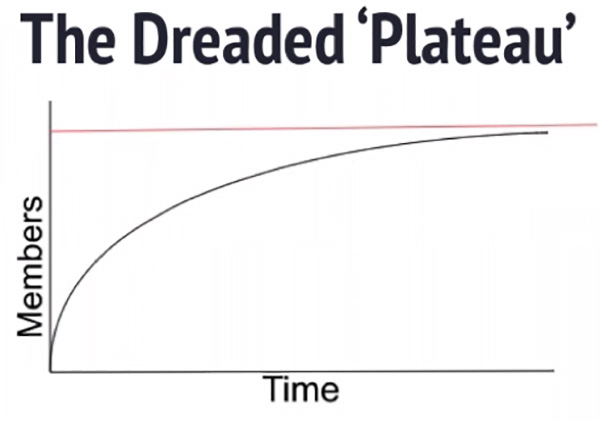
So, what is “the plateau”?
The plateau refers to the point in time when the number of customers added to your audience or membership is equal to the number leaving.
This is an unavoidable truth because as your membership gets bigger and bigger, churn will start taking out more and more of those people.
Let’s look at a simplified churn model. Pretend you’re starting a brand-new membership site. You manage to add 100 new subscribers every month, and your churn rate is 10%.
After the first month, you’ll have 90 members. (Because you added 100, and 10 of them churned.) After the second month, you’ll have 171. (You added 100, bringing you to 190, then lost 10% of that or 19.)
Let’s project this out and see how your site would progress over time:
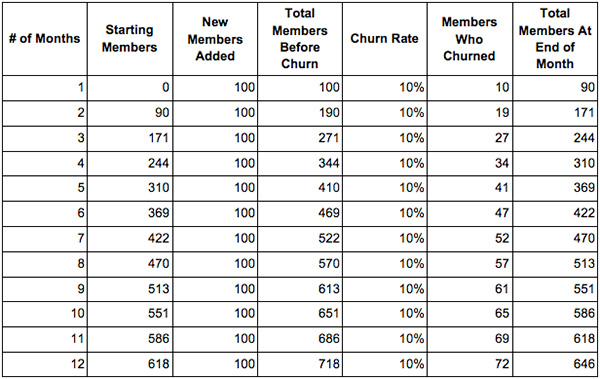
Right away you can tell—if you look at the rightmost column—that your growth is slowing down. The first month, your net growth was 90 new members. After 12 months, it was only 28 (646 – 618).
And eventually, if your “new members added” and “churn rate” stay constant, you’ll reach a point where it levels off completely:
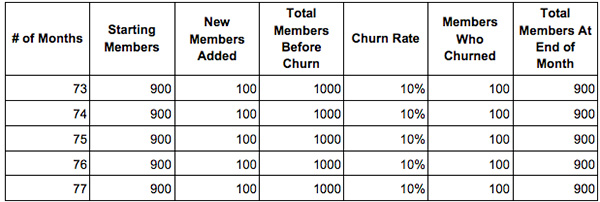
THAT is the plateau.
It’s where the number of new members each month equals the number of members who churned, which means you aren’t growing—you’re stagnant.
When you reach this point, the only way to continue growing your membership is to…
- Add more members every month, and/or
- Reduce your churn rate
The problem with strategy #1 is that acquiring new customers is expensive. Not only is it expensive, but eventually you’ll start to reach market saturation. That’s the point where you’ve reached the relevant lists in your niche, you’ve targeted all the relevant interests on Facebook, and essentially, you’ve acquired all the easy, low-cost customers available.
(In other words, what you’ll eventually find is that there is only so much water that can be added to the bucket, or that adding water gets way more expensive.)
Now take a breath. Don’t freak out. I know this sounds scary, but it’s not quite as bad as it might sound.
It might make you feel better if I told you that we hit this plateau at DigitalMarketer. And guess what? It wasn’t the end of the world. We figured it out. We kept moving.
But it wasn’t easy. Once you hit this plateau, it takes some pretty massive changes to continue growing.
So, can you see why churn is so important?
Why is this something you really need to keep an eye on?
But here’s some good news. When you understand churn, you’ll have the tools you need to tackle the plateau when you reach it—and in some cases, you might be able to avoid it altogether.
What’s a “Good” Churn Rate?
Anytime I start talking about churn, the question invariably arises:
What’s a good churn rate?
Unfortunately, that’s a hard question to answer. It certainly varies depending on industry, and there are confounding factors—for instance, if you’re measuring the churn rate for your email list, the frequency of your email sends will have a big impact on churn.
And because churn rate is such a vital metric for SaaS companies, they tend to be extremely tight-lipped about their churn statistics.
But in the end, it doesn’t really matter. Because when you are trying to grow your business, nobody else’s churn rate really matters; all that matters is your own. This is one part of your business where you aren’t really working against your competitors—you’re working against your past self, trying to improve your own performance.
So, don’t worry too much about industry standard churn rates. What’s really important is that you know what your own churn rate is, and try to improve on it over time.
3 Types of Churn
There are 3 main things that can churn in a business. They might not all apply to your business, but at least 1 of them definitely will. There 3 types of churn are:
Customer Churn
There might be people in your SaaS program or people in your paid membership site.
This could also be clients—for instance, if you’re on retention as a consultant, any client who cancels your service could be thought of as churning.
Revenue Churn
You can also think about churn in terms of revenue, rather than in terms of customers. And this is useful because customer churn and revenue churn don’t always line up.
Maybe your customers have different values, and your higher-value customers have a different churn rate than your lower-value customers.
In situations like this, it makes sense to look at revenue churn in addition to customer churn.
Subscriber Churn
This is a type of churn that people tend to forget about, but it’s a really important metric to look at.
How often do you experience churn among people who are subscribed to your email list? These are the people your company is having a conversation with. They aren’t necessarily customers, but they’re potential customers.
When to Measure Churn
Another question that comes up is: how often should you measure churn? Should you measure it every day, once a week, monthly, or every quarter? What’s the ideal frequency?
This is generally considered to be the sweet spot in terms of churn measurement.
If you measure churn too often—like every day—then you’re going to introduce too much variation into your data. Your measurements will be thrown off by little things. Maybe something breaks on your website one day. And that makes a couple people mad, leading to a few extra cancellations.
In the big picture, that little spike of cancellations isn’t that big of a deal. But if you measure churn too frequently, you’re going to stress out about those little spikes.
On the other hand, looking at churn every year or quarter is going too far in the other direction. You’re never going to be able to make smart, informed decisions—because you’re looking at too much data. And you aren’t looking at it frequently enough to make the changes you need to keep churn under control.
So, where does that leave us?
In short, for most companies, I recommend measuring your churn on a monthly basis. This is generally considered to be the sweet spot in terms of churn measurement.
It’s not too often (so little spikes won’t throw off your data). But it’s also frequent enough that you can spot any troublesome trends and take steps to correct any problems.
However…
Depending on the nature of your membership, it might make sense to measure churn at different intervals. For instance, maybe you have a subscription product that only charges people once a year (like Amazon Prime).
If that’s the case, then it doesn’t make sense to measure churn monthly. Instead, you’ll want to measure churn yearly (or quarterly, or however often you charge your members).
My best rule of thumb is to measure churn based on the frequency of your rebills for customers and revenue, and once a month for subscribers.
(NOTE: Want to learn to use your company’s data to make smart, data-driven decisions? Become a Certified Data & Analytics Specialist and understand the health of your business at every stage. Learn more here.)

How to Measure Churn
OK, so we’ve been talking about churn for a while now. It’s probably time for me to tell you how to actually measure your business’s churn rate.
The equation looks like this:
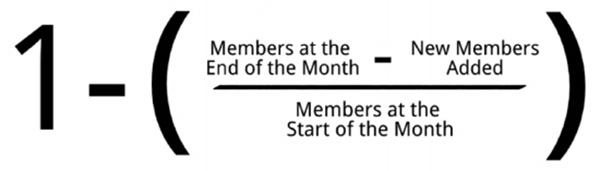
This equation will tell you how many members churned out, compared to how many members you started with. When you finish this calculation, you’ll end with a percentage (so 0.28 is 28%).
The big thing people tend to forget is to subtract the “new members added.” But it’s really, REALLY important to subtract that out.
Here’s why:
It’s a common mistake to say, “I had 100 members last month. This month I have 102. So clearly, churn isn’t a problem for me.”
NOT TRUE!
At least…not necessarily.
Here’s why:
Maybe you lost 33 members last month, but simply generated 35 new members. If that’s the case, then you actually have a churn rate of…
1 – (102-35) / 100 = 33%
In this scenario, you actually have a really high churn rate that you need to figure out. But you wouldn’t know that unless you did the math and calculated it.
So this is how you measure your churn rate. Just use this equation every month to figure out what percentage of your members churned.
How to Predict Future Churn
OK, now you know how to calculate churn that happened in the past. But how can you predict FUTURE churn?
There’s no 1 single answer to that question, but there are 3 common models you can use to predict churn. We’re going to discuss the merits and challenges of each, looking at how they predict the churn of a single cohort (a group that entered into your subscription or list at the same time—more on this after our models).
The Linear Churn Model
The first model of churn is a linear model:
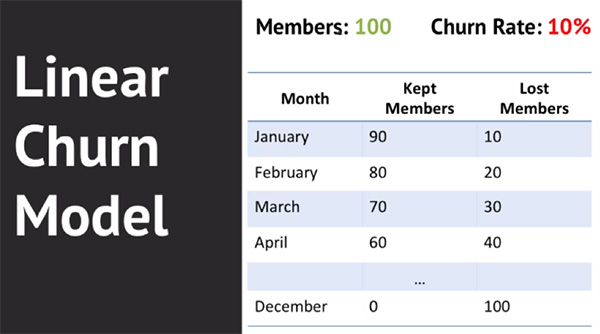
In this model, you lose a certain number of members over time. And that number is constant.
So, if you start with 100 members, and your churn rate is 10%, that means you would lose 10 members every month. So, after 10 months, all 100 members would be gone.
Now the good news about the linear churn model is that it’s not very accurate. In the real world, churn does NOT typically happen this quickly.
So, let’s move to a slightly more complicated (and more realistic) model.
The Exponential Churn Model
Next, let’s take a look at the exponential churn model:
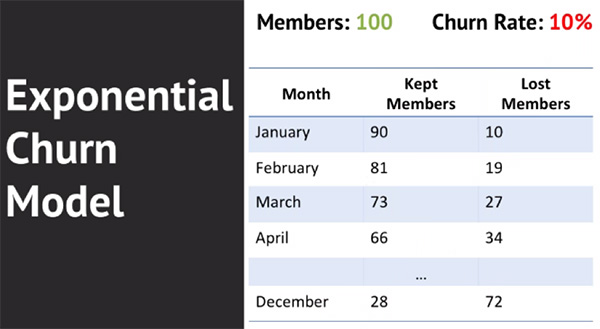
In this model, which is more accurate than the linear model, you lose a certain percentage of your members over time.
So, if your churn rate is 10%, and you start with 100 members in January, then you’ll lose 10 members the first month.
But in February, you start with 90 members—so instead of losing 10, you lose 9. That means you begin March with 81 members, so you’ll lose 8 members that month.
Make sense?
It’s a little more complicated, but it’s much more accurate and useful than the linear model. Using this model, if you started the year with 100 members you would end the year with 28 still subscribing to your service.
Now if you really want to get an accurate (but much more complex) prediction of your churn rate, you can use…
The Adjusted Exponential Churn Model
The last churn model is called the adjusted exponential churn model:
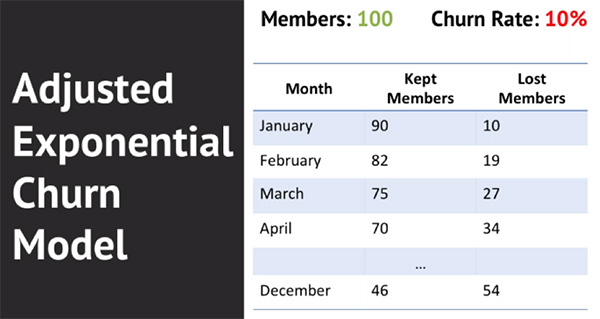
I won’t go into too much detail on the adjusted churn model, because frankly, it’s pretty complex, and there’s no quick and easy way to calculate this on your own.
It is probably the most accurate way to calculate churn. And as you can see, it’s less steep than the other models—this model would predict that you still have 46 members at the end of the year, compared to 0 for the linear model and 28 for the exponential model:

And if you look at all 3 models on one graph here, you can see that the adjusted exponential decay model eventually kind of levels out.
We call this line (the green one) “the retention curve”:
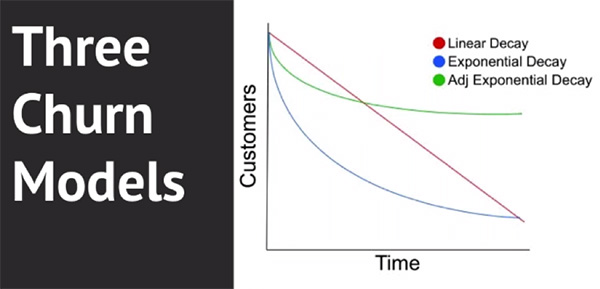
And this is how most churn really works. You have a certain percentage who churn out pretty quickly—probably a pretty big percentage. But the churn quickly levels off, and after that point, churn happens much more slowly.
Now if you’re really interested in calculating your churn based on the adjusted exponential churn model, you can learn more about that here. But we’re not going to do that in this post.
Because while this model is accurate, it’s not especially useful—for one thing, it requires you to make a ton of assumptions about the future of your business that may or may not be correct. The other problem is that this is really difficult and complicated to calculate, a huge barrier for most entrepreneurs and small businesses with limited time for analysis.
Instead, when you’re just getting started, I recommend using the Exponential Churn model. It will over-exaggerate your churn to an extent, but that’s OK. This doesn’t have to be perfect. It just has to be close enough to give you an idea of how many people are going to leave your membership or email list over time.
A Super-Quick Way to Calculate Future Retention Rates
If you want to look really smart the next time you’re talking about churn, break out this equation:
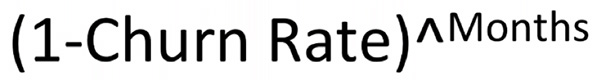
This is a simple equation you can use to project what percentage of your members or subscribers will still be around after a certain number of months. This equation uses the exponential churn model described above.
Let’s see it in action: pretend you have 200 members with a churn rate of 10%. And let’s say you want to figure out how many of those 200 members will still be around after a year (12 months).
Just plug those numbers into the equation (remember 10% = 0.1):
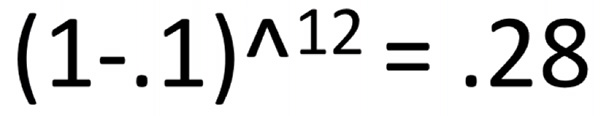
And voila!
After a year, 28% of your members will still be around. If you started with 200 members, that means 56 of them will still be subscribed after a year (200 * 28% = 56).
How Do You Use Churn?
OK, so you’ve learned how to calculate past churn…and how to predict future churn.
So…what do you DO with that information? How do you actually USE it?
Here are a few helpful ideas:
Using Cohorts
A cohort is a group of people with something in common. And when you’re looking at churn, the “thing in common” is usually when those people joined your membership program.
And THIS is where churn gets fun!
So, you might take everyone who joined in January, and put them together in a cohort. Then you can measure their churn as a group—to help get a better idea of your average customer retention and value.
In other words, you use cohorts to figure out how long the average subscriber is going to stick around.
For example, here’s a single cohort for DigitalMarketer Lab:
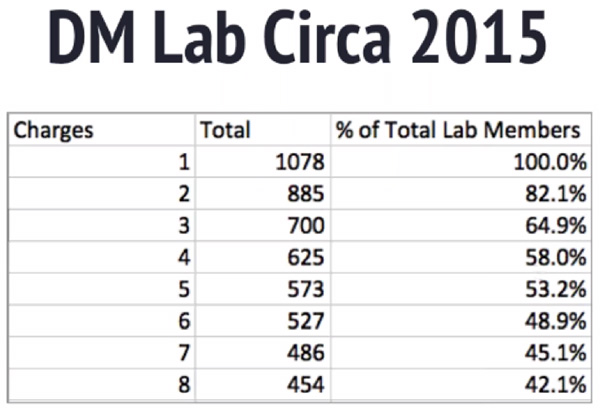
We watched this same group of members over time and found that after 8 months we still had about 42% as subscribers. (DigitalMarketer’s churn rate at the time was around 8%.)
We used this data to help figure out how long our members stick around…which we then used to calculate our average customer lifetime value and projected revenue.
And THIS is where churn gets fun!
(Also, keep in mind we didn’t just do this once. We did it maybe 20 times, with 20 different cohorts, to really get a good idea of our membership site retention rate.)
3 Useful Things You Can Do With This Data
Once you know your churn rate, there’s a lot you can do with that data. Here are 3 of the most useful:
1. Churn Allows You to Project Income Revenue
When you have an idea of your churn rate, you can start to accurately calculate how much revenue you’ll take in each month.
And if you do this at the beginning of January, for instance, you can get an idea of how much revenue you’ll make over the next 12 months—which is important information you can use to help guide your budgeting, spending, and marketing strategies over the next year.
You can also use this data to calculate the total value of an average subscriber.
Here’s an example of what this might look like. First, take your cohort analysis and add in how many charges occurred each month:
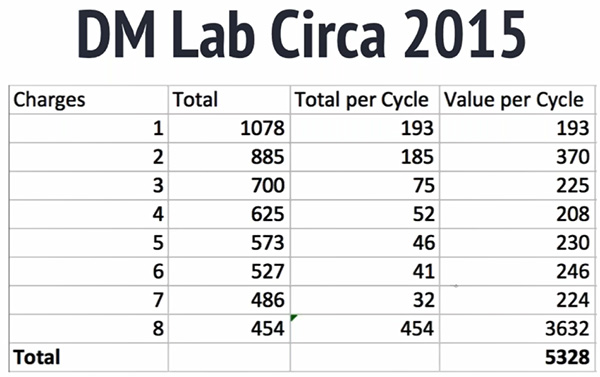
The “Total per Cycle” column refers to how many members left that month. So in the first month, 193 people left after paying only 1 time. In the 2nd month, 185 people left after paying twice.
And so on.
Multiply column 1 (# of charges) times column 3 (how many people paid that number of times) to get the total number of charges for that group.
When you’re done, add them all together, and you get 5,328—this is the total number of payments we processed for this cohort.
And if you divide that by the total number of members who started with us, you can calculate the average amount of time that the average person was a Lab member:
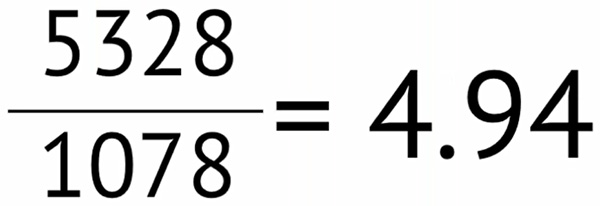
So, in this cohort, people stayed for an average of 5 months. Multiply that by the cost of membership and you get the average customer value.
And that’s REALLY useful information!
Because once you know what a subscriber is worth to your business, you know how much money you can afford to spend on acquiring new customers while still turning a profit.
2. Churn Allows You to Estimate How Many New Members Are Needed to Maintain and/or Grow Your Business
Now that you know how many members you’ll lose each month, and how much revenue that corresponds to, you can figure out how many NEW members you’ll need to acquire if you want to keep growing.
This is really helpful information you can use to help guide your marketing campaigns and avoid “the plateau” I described earlier.
3. Churn Allows You to Establish Performance Baselines, Putting You in a Better Position to Understand How New Strategies Affect Your Customer Retention Rates
Once you know how to calculate churn, you’ll be much better able to measure the impact of changes in your business.
For instance, maybe you made a change to improve your membership site; rather than simply saying, “We improved the interface,” now you’ll be able to say something much more specific and meaningful, like: “We improved churn by 3% and saved the company $3,000 per month.”
5 Churn Causes & Cures
Now you have the tools you need to measure and predict churn quickly. But, of course, you should always be trying to reduce your churn rates. So how do you do that? And what causes people to churn, anyway?
Well, here are 5 things that could be causing people to churn from your membership…and 5 things you can to help reduce that churn.
5 Possible Causes of Churn
Here are 5 of the most common causes of churn we’ve seen across our portfolio of businesses:
1. Consumption Completion
If your membership site offers a limited amount of content, then people are going to cancel once they finish your course.
If you find that this is a big cause of churn for your business, then there’s a simple fix: add more, great new content to your site!
2. Lack of Belief or Investment
If your members don’t believe your product or service will work—or if they’re not invested in using it—that can also cause them to leave your site.
It’s not enough for your product to work; your customers have to BELIEVE it will work.
3. Usability Friction
If your site is hard to use or navigate, that can also cause people to become frustrated and leave your site. If this is the case for your business, then the solution should be clear:
Get to work improving your site, pronto!
4. Cost
Some people will leave your site because the price is too high. They don’t believe the value of membership is worth the cost.
Does this mean you should lower prices? No, not necessarily.
Instead, this is often a market/customer match problem. If a high percentage of your members think the cost is too high, you might be going after the wrong market—and instead, you need to target higher-income people for whom your price won’t be a problem.
5. Involuntary Churn/Billing Issues
Sometimes technical issues cause people to churn involuntarily. Maybe the credit card you have on file expires or gets declined.
As a result, they end up churning—but it’s not because they chose to cancel. It was involuntary.
When this happens, you should make a strong effort to contact the member and have them update their payment information.
5 Things You Can Do to Reduce Churn
Now here are 5 things you can do to help reduce churn over time:
1. Messaging Segmentation
This means breaking down your members into different groups so that you can talk to each group in a way that’s more relevant to them.
For instance, in DM Lab we have entrepreneurs, small business owners, and marketing agencies. If we can keep track of who’s who in DM Lab, then we can provide more relevant messages and content to each of those groups—increasing the value of their membership and reducing churn.
2. Indoctrination
This just means working to build up your relationship with each new member. To help make your members feel invested in your community. To make them feel a part of it. More connected with your business.
(RELATED: 8 Essential Strategies to Build a Thriving Customer Community)
One way to do this is through an email series that shows your new customers how to get started using your product and answers commonly asked questions.
3. Downgrading
Is price an issue for a lot of members? If so, then downgrading can be a powerful way to reduce churn.
Some companies will offer a lower level of service for a lower monthly fee. For example: Instead of paying $15 for 2 DVDs a month, would you like 1 DVD a month for just $8?
You can also use this strategy with email lists by offering a weekly email roundup instead of a daily email.
Either way, the strategy is the same: you’re basically reducing the commitment on the part of the user, thereby getting them to stay in your community.
4. Commitments
When you ask people to commit to themselves (or their friends) in a public way, that can really improve your churn rate.
Maybe you ask new members to share their progress on Facebook or Twitter—or even ask them to refer their friends and family. This kind of thing can increase their sense of commitment and improve customer retention.
5. Billing System Efficiencies
Basically, this means coming up with ways of getting in touch with people when their credit card doesn’t work.
Maybe you send a reminder email the month before their card expires asking them to update it in advance. Then if their card gets declined, you make a point to call them and ask for the updated expiration date.
There’s a lot of low-hanging fruit here for reducing your churn rate by simply making it easy for people to update their payment information.
Conclusion
I know this has been a long post with a lot of math, but you made it!
And more importantly, you’ve learned the essentials of churn rate that you can use to help retain more of your customers and ultimately grow your business.
So, what should you do to get started?
First, go back and measure your churn rate for the past few months. This can help you establish a baseline.
Then set a reminder to measure it again at the end of each month.
Finally, get started with some cohort analysis. Group customers by starting month to start tracking your average customer retention rate and average customer value.
Do those few things, and you’ll be putting yourself in a much better position to make smarter and more informed business decisions.
(NOTE: Want to learn to use your company’s data to make smart, data-driven decisions? Become a Certified Data & Analytics Specialist and understand the health of your business at every stage. Learn more here.)