Editor’s Note: Many people eagerly look forward to the release of a new GRIT Report. In anticipation of the latest Insights Practice edition, here’s a sneak peek by Jeffrey Henning on the emerging methods in the market research industry. Jeffrey’s summary, as well as more detailed findings on a host of other topics, will be printed in the full report.
Returning in this wave of GRIT is our exploration of Buyers’ satisfaction levels with Suppliers, combined with how Suppliers see themselves. Although many individual companies on both sides have formalized programs for capturing satisfaction data, GRIT is the only study that looks at this across the industry in aggregate. New to this wave is an analysis of the types of Suppliers being used.
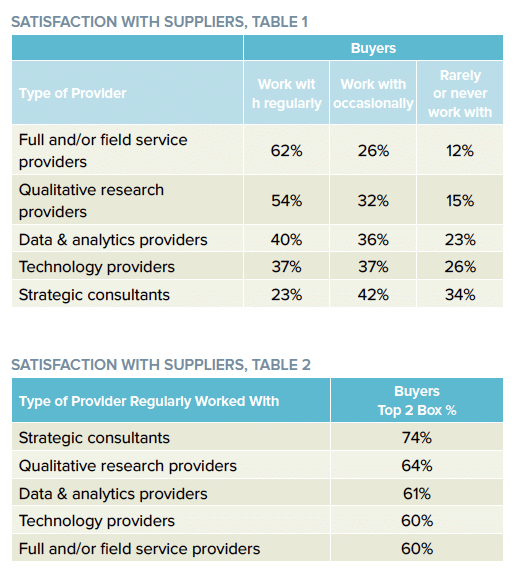
Prior to asking for overall satisfaction with providers, Buyers were prompted for how frequently they worked with different types of providers. The majority of research Buyers work with full service and qualitative providers regularly, while only about four in ten work with analytics and technology providers regularly, and fewer than one in four work with strategic consultants regularly.
Consistent with prior waves, Buyers rated all the providers they work with overall rather than by type (to do so would either expand survey length dramatically, cripple sample per analysis, or both.) Crosstabbing overall satisfaction by those who regularly work with types (even though they may also work with other types) produces the following imperfect measure: 74% of those Buyers who work regularly with strategic consultants are very or completely satisfied, significantly higher than how satisfied they are with more tactical providers, especially technology and field service providers (60%). Strategy sells – and satisfies.
Note that the frequency of work is may be a consequence of satisfaction with a type of provider. For instance, only 45% of those who work occasionally with full-service providers are very or completely satisfied with their providers, vs. 60% for those who work regularly with such providers.
How Buyers Rate Suppliers
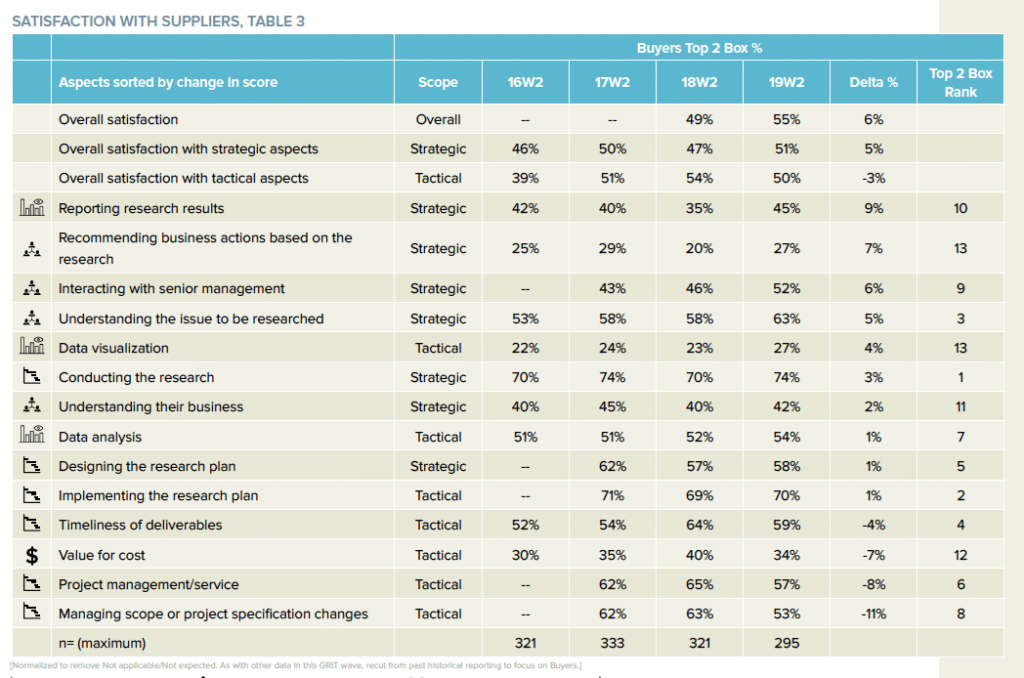
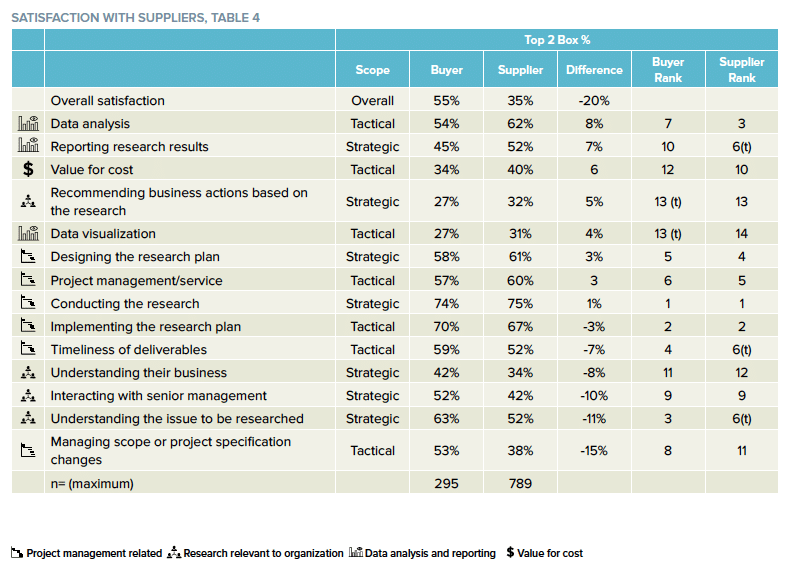
Last year, in its GRIT debut, Buyers’ overall satisfaction with Suppliers (across all types) was an underwhelming 49% (Top 2 Box, completely or very satisfied) but has risen 6 percentage points to 55% over 2019. The improvement is mainly due to higher satisfaction with strategic aspects, which, on average, improved by 5 percentage points, led by reporting research results (9 points), recommending business actions based on the research (7 points), and interacting with senior management (6 points). No strategic aspect declined in satisfaction.
The aggregate score for tactical aspects declined 3 percentage points, despite a 4 point improvement in data visualization. Most tactical aspects – timeliness of deliverables, value for the cost, project management/service, and managing scope/changes dropped 4 percentage points or more.
The top two most satisfying aspects from 2018, conducting the research and implementing the research plan are in the same position this year, with scores of 74% and 70%, respectively. This is consistent with common sense: these are the two aspects that perhaps apply most universally across supplier types, and doing well on them are likely table stakes to be considered for work. The third top aspect from last year, project management/service, fell to 6th place with a score of 57%, an 8 point drop. The third position is now understanding the issue to be researched, a strategic aspect, which improved 5 points to 63%.
 Are Changes in Ratings Artefacts of Survey Changes?
 Are Changes in Ratings Artefacts of Survey Changes?
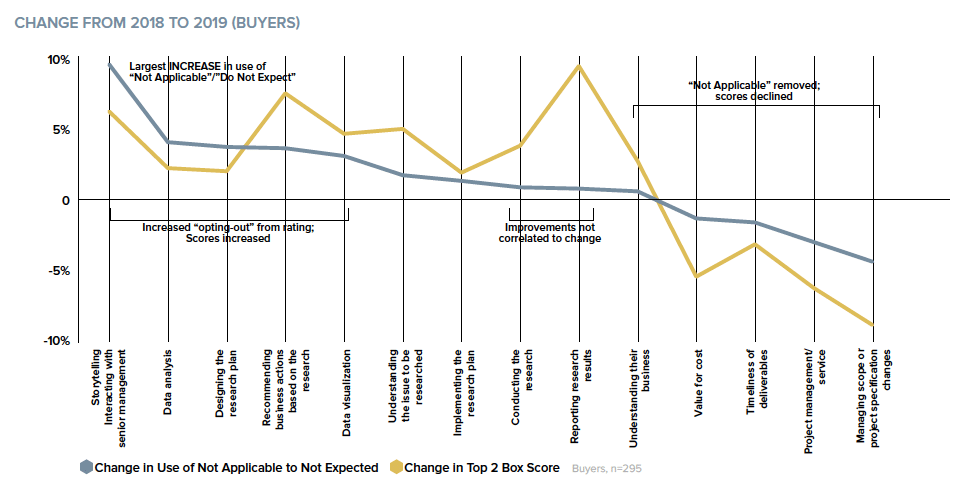
Some of the movement from 2018 to 2019, but not all of it, maybe explained by subtle changes to the strategic and tactical aspect questions. In past waves, the buyer could select a rating from completely satisfied to not at all satisfied or opt-out by choosing Not applicable. In this wave, we tightened up the opt-out option to make it more descriptive, decisive, and appropriate to the specific aspects: Do not expect this from them.
While reviewing the data to date, some answer patterns suggested that some respondents may not know how to answer regarding an aspect that wasn’t expected to be part of the service, but they didn’t necessarily choose not applicable. For example, some buyers love the supplier to interact with senior management because, in some cases, they may bring external credibility that cannot be realized via internal efforts, perhaps a particular area of expertise or the objectivity of an outsider. Other buyers might loathe the prospect of a supplier encroaching on the territory they have carefully cultivated and positioned. If a supplier does not interact with senior management, the first buyer may be less satisfied while the latter may be delighted. In each case, the behavior (or non-behavior) is the same, but the impact on satisfaction is completely opposite.
We believed we saw evidence of this in the data last year, and hypothesized that some buyers would be more comfortable saying that they did not expect the supplier to interact with senior management rather than offer an opinion on something that hadn’t happened (or hadn’t happened yet.) From this perspective, not applicable did not seem to be the right way to opt-out because, if a supplier chose to make it an issue regardless of the buyer’s expectations, it would be extremely applicable. After considering these issues, we decided to change not applicable to not expected from them.
Going a step further, we removed the not applicable choice from aspects that would seem to be baked into any type of supplier service: project management/service, managing the scope and changes, timeliness, and value for the cost. The results are consistent and enlightening.
First, usage of the opt-out option increased for five aspects after it was changed to do not expect this: interacting with senior management (9.5 points), data analysis (3.5), designing the research plan (3.1), recommending business actions (3.0), and data visualization (2.4). Top 2 Box satisfaction scores increased for interacting with senior management, recommending business actions, and data visualization, suggesting that those who did not choose not applicable but would have chosen do not expect in the last wave gave a lower than average rating instead. It seems to have made no difference for data analysis and designing the research plan, perhaps because it is easier to give a more neutral rating for those because they are relatively more behind the scenes.
Second, where the opt-out option was taken away, top 2 box satisfaction declined, from 4 percentage points for timeliness of deliverables to 11 points for managing scope/changes. This suggests that people who opted out the last wave would have provided ratings that were more negative than average for these aspects. Whether one believes the higher 2018 scores are truer than the 2019 scores or not depends on how willing you are to believe that a supplier can provide a service that cannot be evaluated vis a vis timeliness, service quality, and value for the cost.
Last, some aspects did not change relative to the number of op-outs, and some of them did not change while one of them – reporting research results – spiked up. This reminds us that although we can find correlations between how a question is asked and how its measure response changes, sometimes the response is influenced by actual, real-world experiences. So, while the findings relative to the survey changes are consistent and suggestive, they seem to impact the magnitude of the differences, not the direction, and, it can be argued, provide a more accurate accounting of Buyer perceptions of Supplier performance.
 Does Satisfaction Vary by Supplier Type?
 Does Satisfaction Vary by Supplier Type?
Recognizing that the essence of the insights and analytics industry does not boil down to simple classifications like Buyer and Supplier, GRIT continues to pursue a more granular understanding of our structure and players. In this spirit, we have attempted to drill down further into satisfaction with different types of suppliers, but without the survey length or sample size luxury to ask separate sequences for each supplier type.
As a proxy, we asked GRIT Buyers which types of suppliers they work with regularly, occasionally, and rarely or never. Our hypothesis is that if we profile satisfaction responses by the supplier types that are top of mind, we might identify some meaningful differences. Obviously, summary ratings across different types of suppliers will not yield a detailed scorecard of satisfaction levels within a specific supplier type, but any differences we see when profiling Buyers ratings by the supplier types that they know best should provide clues about how different types of suppliers are performing.
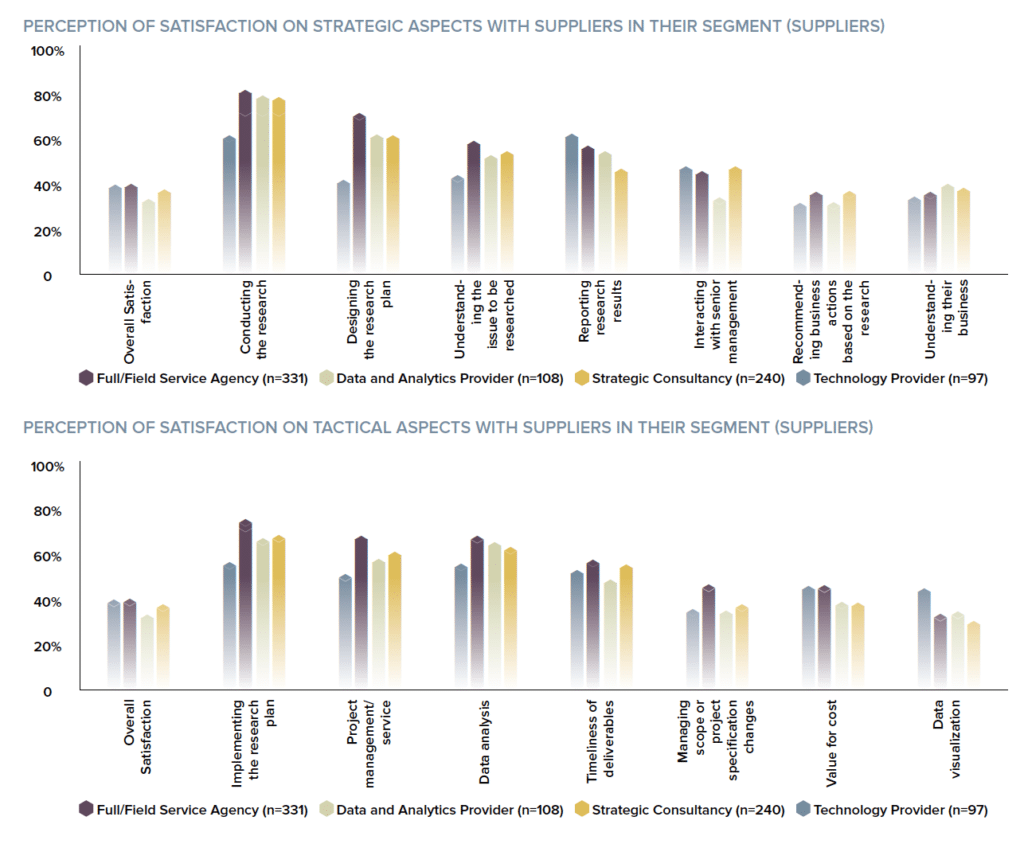
Chart 2 shows the Buyer ratings of suppliers for each of the seven strategic aspects broken out by Buyers who work regularly with each type of supplier. Of course, if a Buyer regularly works with more than one type of supplier, the response will count for multiple types, making it more difficult to find differences.
However, we do see some differences, mainly with respect to strategic consultancies, data and analytics providers, and technology providers. Working regularly with just 23% of Buyers, strategic consultancies drive the smallest, but most unique type in the analysis. Overall satisfaction with suppliers, in general, is higher for Buyers if they work regularly with strategic consultancies. Satisfaction is particularly high with respect to interacting with senior management and higher for recommending business actions.
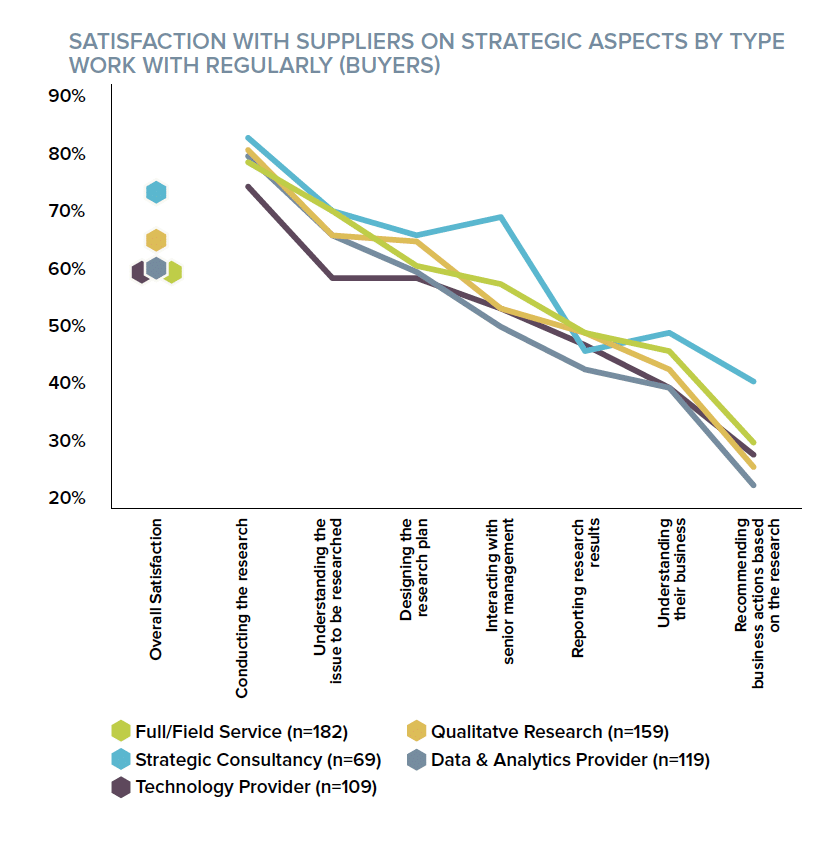
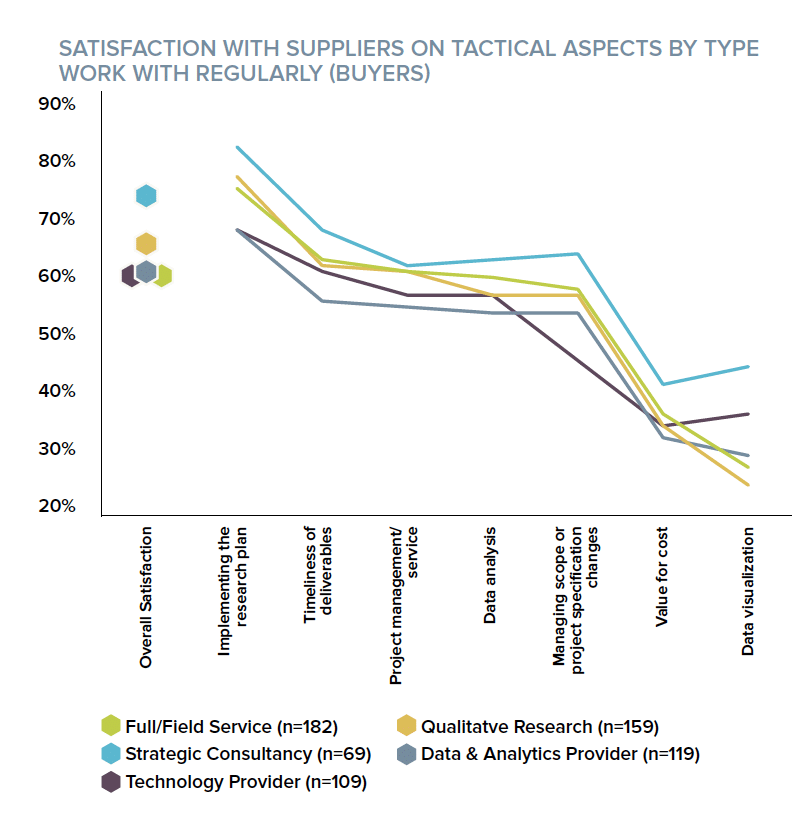
Chart 3 shows similar information for the tactical aspects. The Buyers that regularly work with strategic consultancies are more satisfied with implementing the research plan, timeliness of deliverables, managing project scope and changes, value for cost, and data visualization.
Buyers who regularly work with technology providers are less satisfied with suppliers’ understanding of their business, while those who regularly work with data and analytics providers are less satisfied with interaction with senior management and reporting research results, as well as timeliness of deliverable and project management/ service.
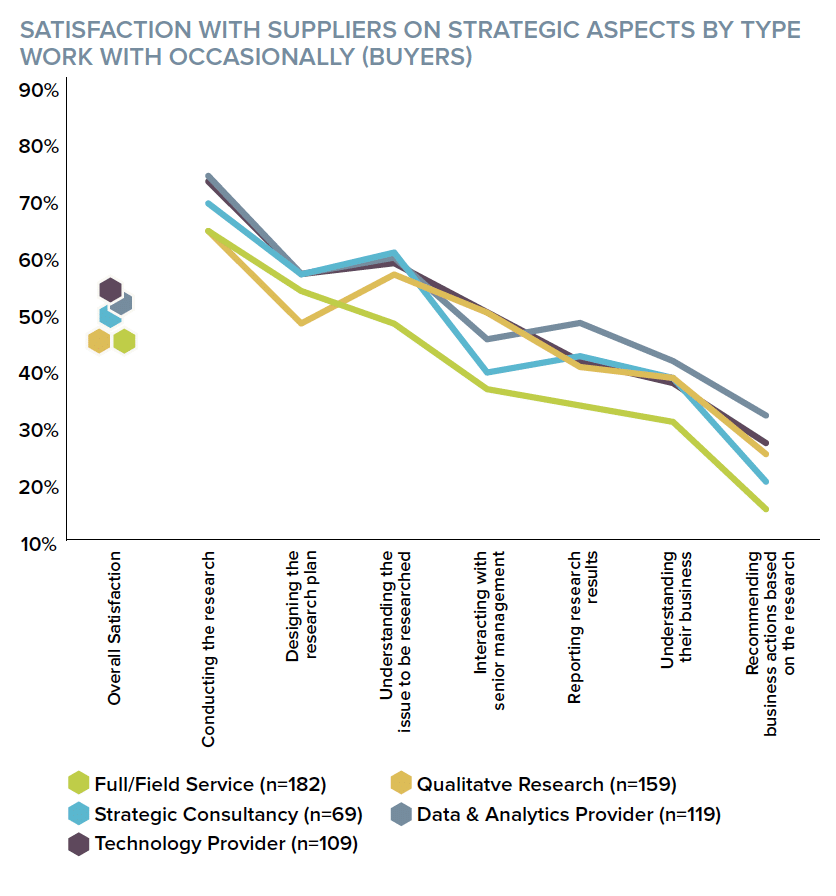
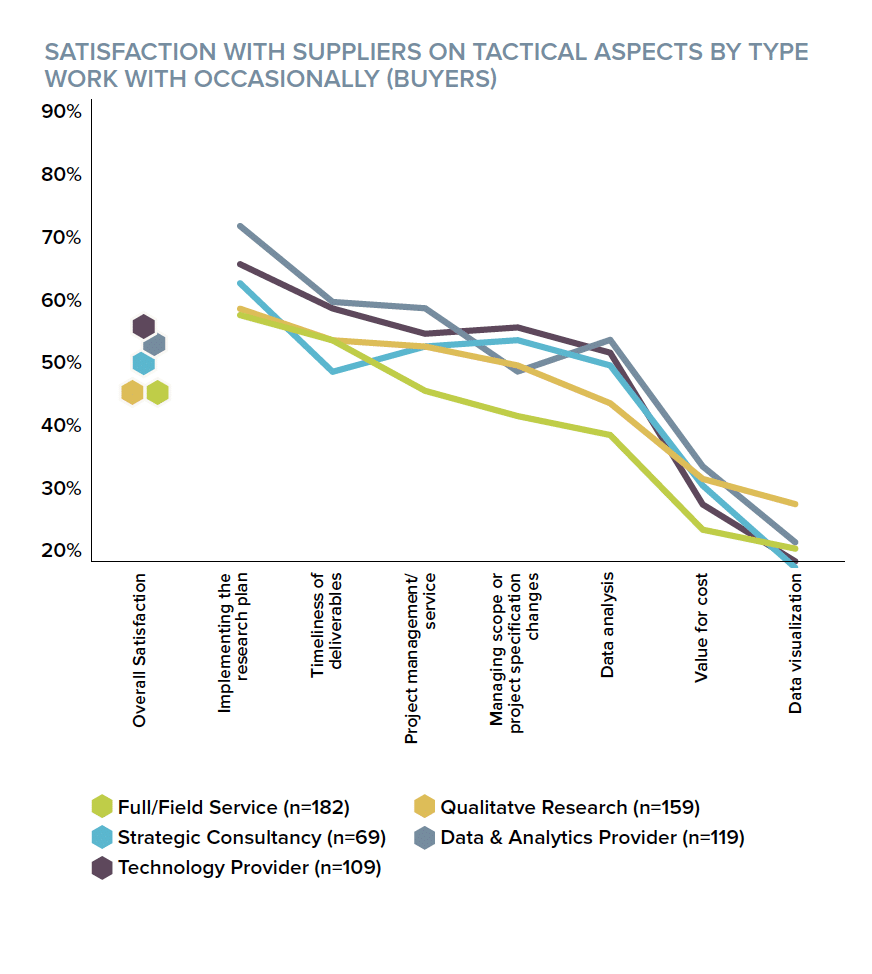
Charts 4 and 5 show satisfaction with strategic and tactical aspects again, this time broken out by which supplies are used occasionally. Buyers who work with strategic consultancies only occasionally do not have a distinct profile such as the one that the regular group shows. Full/field service agencies, indistinguishably in the center of things for Buyers who work with them regularly, now stand out in a more negative way for those who use them only on occasion. Lower satisfaction is evident for most of the strategic aspects: understanding issue to be researched, interacting with senior management, reporting results, understanding the business, and making recommendations. On the tactical side, these Buyers are also less satisfied with suppliers on project management/service, managing project scope/ changes, data analysis, and value for cost.
Clearly, there are different levels of satisfaction in different aspects of service driven by how a Buyer works with particular types of suppliers, and GRIT is just scratching the surface of it now. The analysis by regular use shows that when strategic consultants are a regular part of the mix, good (or, at least, better) things happen. However, only 23% of buyers work with them regularly, and GRIT analysis has not progressed far enough yet to understand the context in which this occurs. For example, do these Buyers work regularly with strategic consultants and only occasionally with other types, or does the regular use of strategic consultancies work for them because it is good to complement to their other regular partners?
The occasional analysis reveals that Buyers are less satisfied when full/field service agencies are used occasionally, yet we know, based on the data, that if they are not working with full/field service agencies occasionally, they are very likely working with them regularly. This suggests a hypothesis that Buyers are more satisfied with suppliers if they have a go-to full/field service provider, perhaps complemented by a go-to supplier from one or more of the other types. At this point, GRIT can offer these few insights and some hypotheses, and those will have to be addressed via our ongoing analyses.

 How Suppliers Rate Themselves
 How Suppliers Rate Themselves
Suppliers were told We’ve asked research Buyers a series of questions about their satisfaction levels with research providers. Now we’d like to know how research Suppliers think the industry performs. Subsequently, they saw a similar series of questions as Buyers, asking them to rate how well Suppliers like them (e.g., of the same type – full/field service, technology providers, etc.) meet the needs of clients. Suppliers were dramatically under confident at the top level: only 35% thought that providers did very well or met needs completely, compared to the 55% of Buyers who were very or completely satisfied.
Suppliers were also under confident on managing project scope/changes, which they rated 15 percentage points lower than Buyers, understanding the issue to be researched (11 points lower), interacting with senior management (10 points lower), understanding their business (8 points lower), and timeliness of deliverables (7 points lower). On the other hand, they were dramatically overconfident on data analysis (8 points higher than Buyers), reporting results (7 points higher), value for the cost (6 points higher), and recommending business actions based on the research (5 points higher). Given that Suppliers answered a somewhat
different question, how comparable are Top 2 Box satisfaction and Top 2 Box meets needs? If we rank each aspect by Top 2 Box score, the same two aspects come out as 1-2: conducting the research and implementing the research plan. In fact, 8 more of the remaining 12 aspects are within 2 rank positions of each other. The most disagreement occurs regarding:
- Reporting research results (tied for #6 among Suppliers but 10th for Buyers)
- Data analysis (#3 for Suppliers but only #7 for Buyers)
- Managing scope or project specification changes (#8 for Buyers, #11 for Suppliers)
- Understanding the issue to be researched (#3 for Buyers but tied for 6th for Suppliers)
The key takeaway seems to be that Buyers and Suppliers have a good understanding of Supplier strengths and weaknesses, but Suppliers might need to spend more time understanding Buyer needs for data analysis and reporting. Considering the two topics together, it might be that Buyers don’t question Suppliers’ technical prowess, but may feel like the analysis misses the mark (leading to poor reporting).
It might seem odd that Suppliers could miss the mark with data analysis when Buyers rate them so much more highly on understanding the business issue to research, but both Suppliers and Buyers give them low marks for understanding the clients’ business. Perhaps Suppliers are better at devising and marketing solutions to topical business problems than they are at customizing the solutions for individual clients.
 Suppliers were asked to evaluate how well their reference group meets needs, and there were some differences across Supplier types.
Technology providers differed the most, rating their group lower for meeting needs with respect to strategic aspects including conducting the research, designing the research plan, and understating the issue to be researched, though they gave themselves the highest mark for reporting results. They also self-evaluated lower on tactical issues including implementing the research plan, project management/service, and data analysis. However, most technology providers said their primary business was licensing tools and platforms, so the lower ratings may reflect a lower involvement in traditional projects and relationships.
A few other differences stand out:
- Full/field service agencies rate themselves highly on designing the research plan and understanding the issue to be researched
- On tactical aspects, full/field service agencies indicated they were better at meeting needs for implementing the research plan, project management/service, data analysis, and managing the scope/changes
 The Big Picture
 The Big Picture
Traditional providers will continue to benefit from a focus on becoming more strategic, as strategic consultants, and excellence at strategic skills drives overall satisfaction. The drive to be more consultative is a worthy goal: generating insights that deliver real organizational impact can develop deep relationships. The more strategic the research, the greater the opportunity for partnership, while the more tactical the effort, the less opportunity.
For many providers, however, the relationship will continue to be far more transactional, driven by the rise of automation and DYI tools, the opportunity for most traditional Suppliers may be limited to winning the business based on the cheaper, faster, better rubric on a client-by-client basis. If the future is in technology and analytics platforms, those vendors have significant work to do to become true strategic partners.
Especially in light of this last point, it is worth reflecting on the hypothesis that client satisfaction with suppliers may be at its highest when they have optimized a complementary portfolio of trusted partners with whom to work with on a regular basis. In that context, it is important to understand how a prospective (or current) client structures its portfolio and how your service would fit in and enhance it.