Learn several analytical data sources you should tap into within your lead-generation, e-commerce and other online contexts, and how to quickly synthesize and share the insights
As a digital marketer, you clearly need customer insights to drive your tactics and strategies. And these insights will likely come from a variety of data streams. But to avoid drowning in these data streams you’ll need some good tools and a systematic analysis approach.
In this post I highlight several analytical data sources you should tap into within your lead-generation, e-commerce and other online contexts, and how to quickly synthesize and share the insights you’ll glean from them.
Download our Premium Resource – Google Analytics Strategy Guide
We’ve designed the Google Analytics guide to provide value for people of all skill levels. Early sections will introduce features that more advanced users will be familiar with, whilst later sections will help advanced users to become power users.
Access the Google Analytics Strategy Guide
Review Your Google Analytics Data
If you don’t already have Google Analytics (GA) or another analytics app integrated into your website, you should one installed soon. This will serve as your ‘Analytics 101’ course, allowing you to the see the visitor interactions that lead to your downstream conversion actions. Speaking of which, while getting GA integrated, make sure that you tag all key visitor interactions (events) so that you can later track and report on these interactions – and your conversion goals – in the preset GA reports.
Since analytics apps can access your previous visitor usage data after installation, you’ll soon be able to get a good sense of who’s visiting your site, from where, from what devices, etc. Most importantly, from a conversion perspective, you’ll see things like:
- Top exit pages
- Page with high bounce rates
- Click-through rates for conversion-related actions (e.g. add-to-carts, product views, chat usage)
- Where your prospects are dropping out of your funnel
When I do a ‘conversion audit’ at the start of my client engagements I always start by reviewing these data. Within an hour or so I’ll have a ‘big picture’ sense of where the user experience is failing to deliver on its conversion goals. The next step is to determine why these bailouts are happening so that you can brainstorm how to fix them.
Gather Some Clickstream Analytics
Once you’ve got your basic analytics tool installed, it’s time to plug in access to some clickstream analytics. These visual analytics show specifically where your experience isn’t matching your visitors’ intents, mindset and motivations. You can then use these data to inform updates to your creative and your split testing hypotheses.
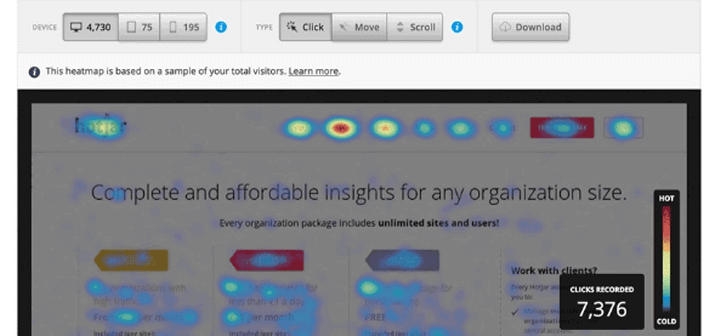
Clickstream data from vendors like CrazyEgg and ClickTale used to require a significant amount of time and budget. Now, subscriptions to tools like HotJar and LuckyOrange cost less than $90 a month for many websites, and they give you a range of analytics including:
- Heat maps – showing where visitors scroll and click
- Form analytics – showing how visitors interact with your forms
- User test recruiting – inviting selected visitors to participate in user tests
- Conversion funnels – showing how your visitors move down your funnel
- Session recordings – showing actual visitor interactions and navigation
- Feedback polls – allowing you to pose simple questions clarify visitor intent or expose concerns.
In my experience, session recordings and feedback polls provide the most useful insights. Session recordings show you what your visitors are actually doing, and actions speak louder than words when it comes to user research. And by reviewing the responses to one-question feedback polls you’ll quickly discover the unaddressed questions and concerns that are lowering your conversion rate and revenues.
While click and scroll heatmaps don’t show exactly where visitors look, they do roughly correlate with visual attention. So they give you a good sense of what your visitors are noticing. If you want to get a more accurate assessment of eyeball fixation, though, you’ll need to invest in an eye tracking hardware setup (EyeTracking.com offers a good one), or use an eye gaze simulator (EyeQuant.com is a good option for this).
Review Your Chat Analytics
Consider this scenario: you have paid several Adwords dollars to acquire a new prospect. You’ve nurtured that prospect via email marketing. (Of course, both of these marketing campaigns cost you administrative time and budget.) Your prospect viewed a couple of your videos on Facebook. So she now trusts your brand enough to come directly to your website.
After browsing around a bit, she views the product page for an item she’s interested in. But she has a question – a question that’s important to her – but that she can’t get answered. So she bails out, never to return. You’ve just lost both this customer and the associated revenues.
If your website offered chat, with some capable agents behind it, there’s a good chance this wouldn’t have happened. So, if you don’t have it already, get chat installed ASAP. You are virtually guaranteed to get a high ROI on this investment.
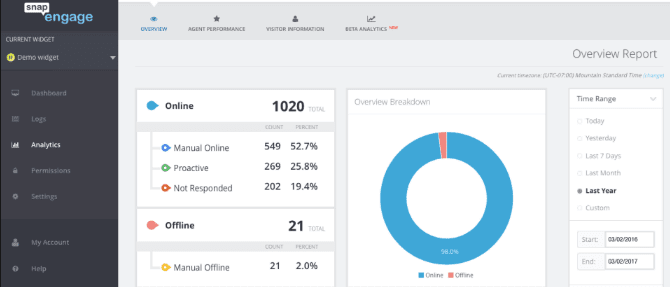
You’ve got chat installed now, right? Okay, now you can start getting some valuable analytics from it. After your agents have logged at least three hundred chats, start reviewing your chat logs. Note the most common questions that keep coming up (or variations on this theme). Then come up with clear answers to each of these questions. Don’t just slap the questions and answers on an FAQs page and call it done. Instead, brainstorm ways to weave these answers – and the catchy, question-related headers – directly into your user experience.
f this process becomes too cumbersome, let technology come to the rescue. Today dozens of chat ‘text mining’ tools are available to comb through these online discussions. In addition to summarizing the top keywords and other usage metrics, some of these tools even use artificial intelligence (AI) to predict question trends – so that you can build future user experience fixes into your product roadmap.
Here’s an article that highlights some of the most popular text mining tools now available.
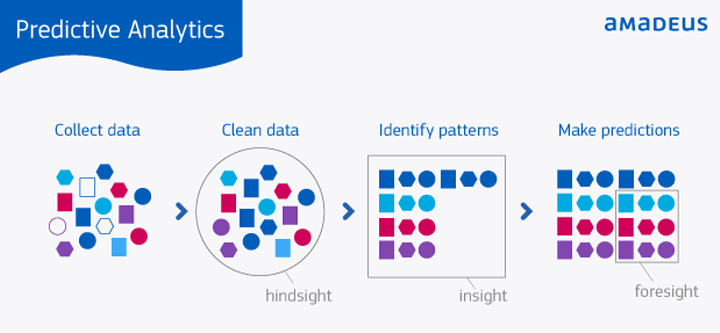
See The Future with Predictive Analytics
Predictive analytics, machine learning, and big data – what comprises Artificial Intelligence, or ‘AI’ – are all the rage these days. Smart people with access to reams of data from a range of sources combine to give you amazingly accurate predictions of future visitor expectations and behaviors. Think of the movie ‘Moneyball’, but on a digital, user experience level.
By discerning visitor segments, and their intents and motives, these apps can offer your visitors exactly what they want, when they want it, and according to the business rules you set. So it’s a win-win; your visitors will be happier and your profit margins will grow.
If you don’t have larger streams of transactional or behavioral data, or haven’t yet hired a data scientist, you can still dabble with these AI-based tools:
- Chatbots (AI-informed chat agents). These tools, when configured properly and monitored carefully, allow you to handle chats with fewer agents, freeing up your human agents to serve more-highly-engaged prospects.
- Split testing tools. Traditional split testing vendors like Visual Website Optimizer (VWO) and Optimizely are now moving upscale, providing more full-featured optimization platforms.
- Dynamic personalization apps. Tools from vendors like DynamicYield, Evergage and Adobe Target integrate with your website and tailor the experience based on previous behavior or purchases, often in real-time.
Just as importantly, the personalization tools include reports that allow you to quickly see how visitor actions correlate with key engagement and conversion metrics like RPV, AOV. In effect, these reports tells you which user experience design ‘levers’ to pull on the most to lift your conversions.
It’s definitely an exciting time for personalization and predictive analytics. Even if you don’t have grand plans in this area, taking a free online ‘predictive analytics’ course or bringing in a data science consultant may prove a very wise investment.
Report Your Findings
Collecting the most awesome data in the world won’t help if you don’t reserve time for making sense of it. So be sure to schedule in some analysis and synthesis time on a regular basis. In most cases, you’ll have collected a ‘critical mass’ of data within 30 to 45 days of installing your analytics apps.
Start to organize your data in high-level buckets like:
- Prospects vs. customers
- New vs. repeat visitors
- Top purchases by Zip Code
- Any another other criteria that stand out
Then drill down into specifics so you can see trends and correlations. Most of the latest tools support segmenting and ‘slicing and dicing’ your data in a variety of ways.
Next, summarize your findings and share them with your colleagues and executive team. If you’ve done other qualitative research, this is good time to share both your ‘quant’ (quantitative) and ‘qual’ (qualitative) findings. By doing this, and with enthusiasm, you’ll inspire your team and leadership to learn even more and become more customer centric. Don’t just stop there; provide monthly or bi-monthly updates with new data sources, insights and ‘a ha’ revelations.
Don’t assume that your colleagues have great memories. Post your findings to an internal website or blog so that everyone can see easily access them and add their comments. Also, be sure to include an archive of previous findings and presentation so that readers can go deeper, if desired.
Start Driving Some Insights
If your company talks about being a ‘data-driven organization’, it’s time to start living out that mantra. Turn on as many analytics streams as you can. Then monitor the data coming in on a regular basis, either manually or with the help of any intelligent tool, so that your team can distill out key insights as quickly as possible.
Finally, if you have the data volume and budget, seriously consider bringing in a data scientist and/or predictive analytics expert – someone to help you plug in the tools, algorithms, and analyzes that are most suitable for your business. In little time your company will truly be data-driven, and you’ll see your customer engagement, conversions and loyalty rise as a result.