- By
- Last updated:

If you want to add extra credibility to your posts, the more data you’re able to provide the better.
However, this raises an issue of how best to present this data. Endlessly listing your figures and statistics makes it hard for users to comprehend your message, and of course, it’s boring. Most people find data easier to digest when it’s presented in a visual format. I’m talking about graphs and charts.
Despite the boost to your authority and credibility of including visual data in your posts, graphs and charts are something most webmasters overlook. When you do see a graph, it’s usually just an image that’s been inserted, rather than a dynamic one.
Now, using an image will still get your message across — that’s fine if you are never planning to update your data. If numbers are liable to change, or you plan to add the latest figures as and when they become available, this tactic simply won’t work. For this, you’ll need to create a dynamic graph.
Fortunately, there are a number of fantastic plugins available to simplify the process of creating great looking, dynamic graphs and charts. If you’re looking for a way to boost sales by including some data to back up your sales pitch, check these out.
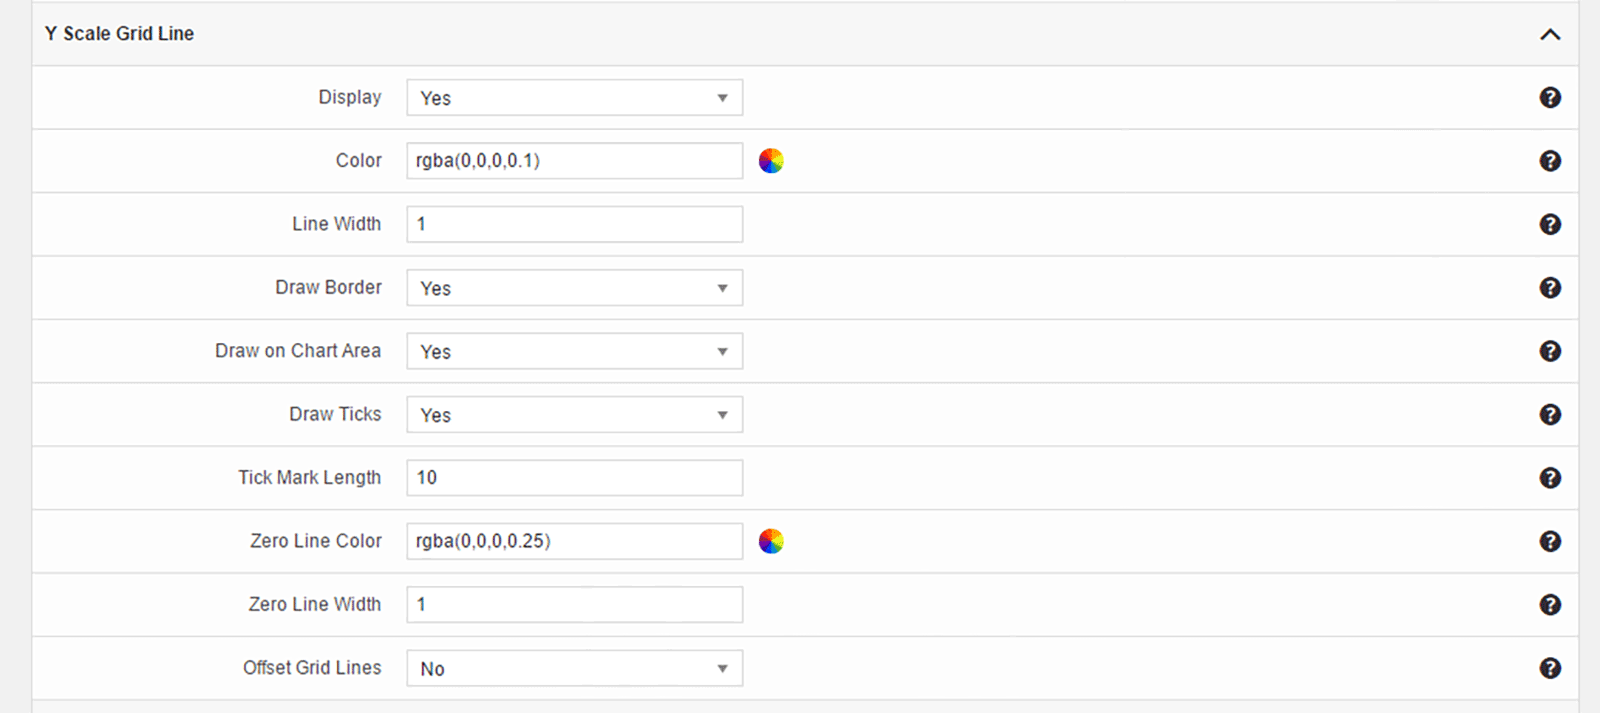
WordPress Charts is an easy to use charts solution that is free to download. It uses Chart.js and HTML5 to create animated charts.
Six charts are available: Pie chart, doughnut chart, polar area chart, bar chart, line chart, and radar chart. You can insert charts into your website using shortcodes or via a widget.
You will find the shortcodes area under the Media menu in your WordPress admin area. An example shortcode is provided for each type of chart and underneath is a list of dozens of shortcode attributes that can be used to build your charts.
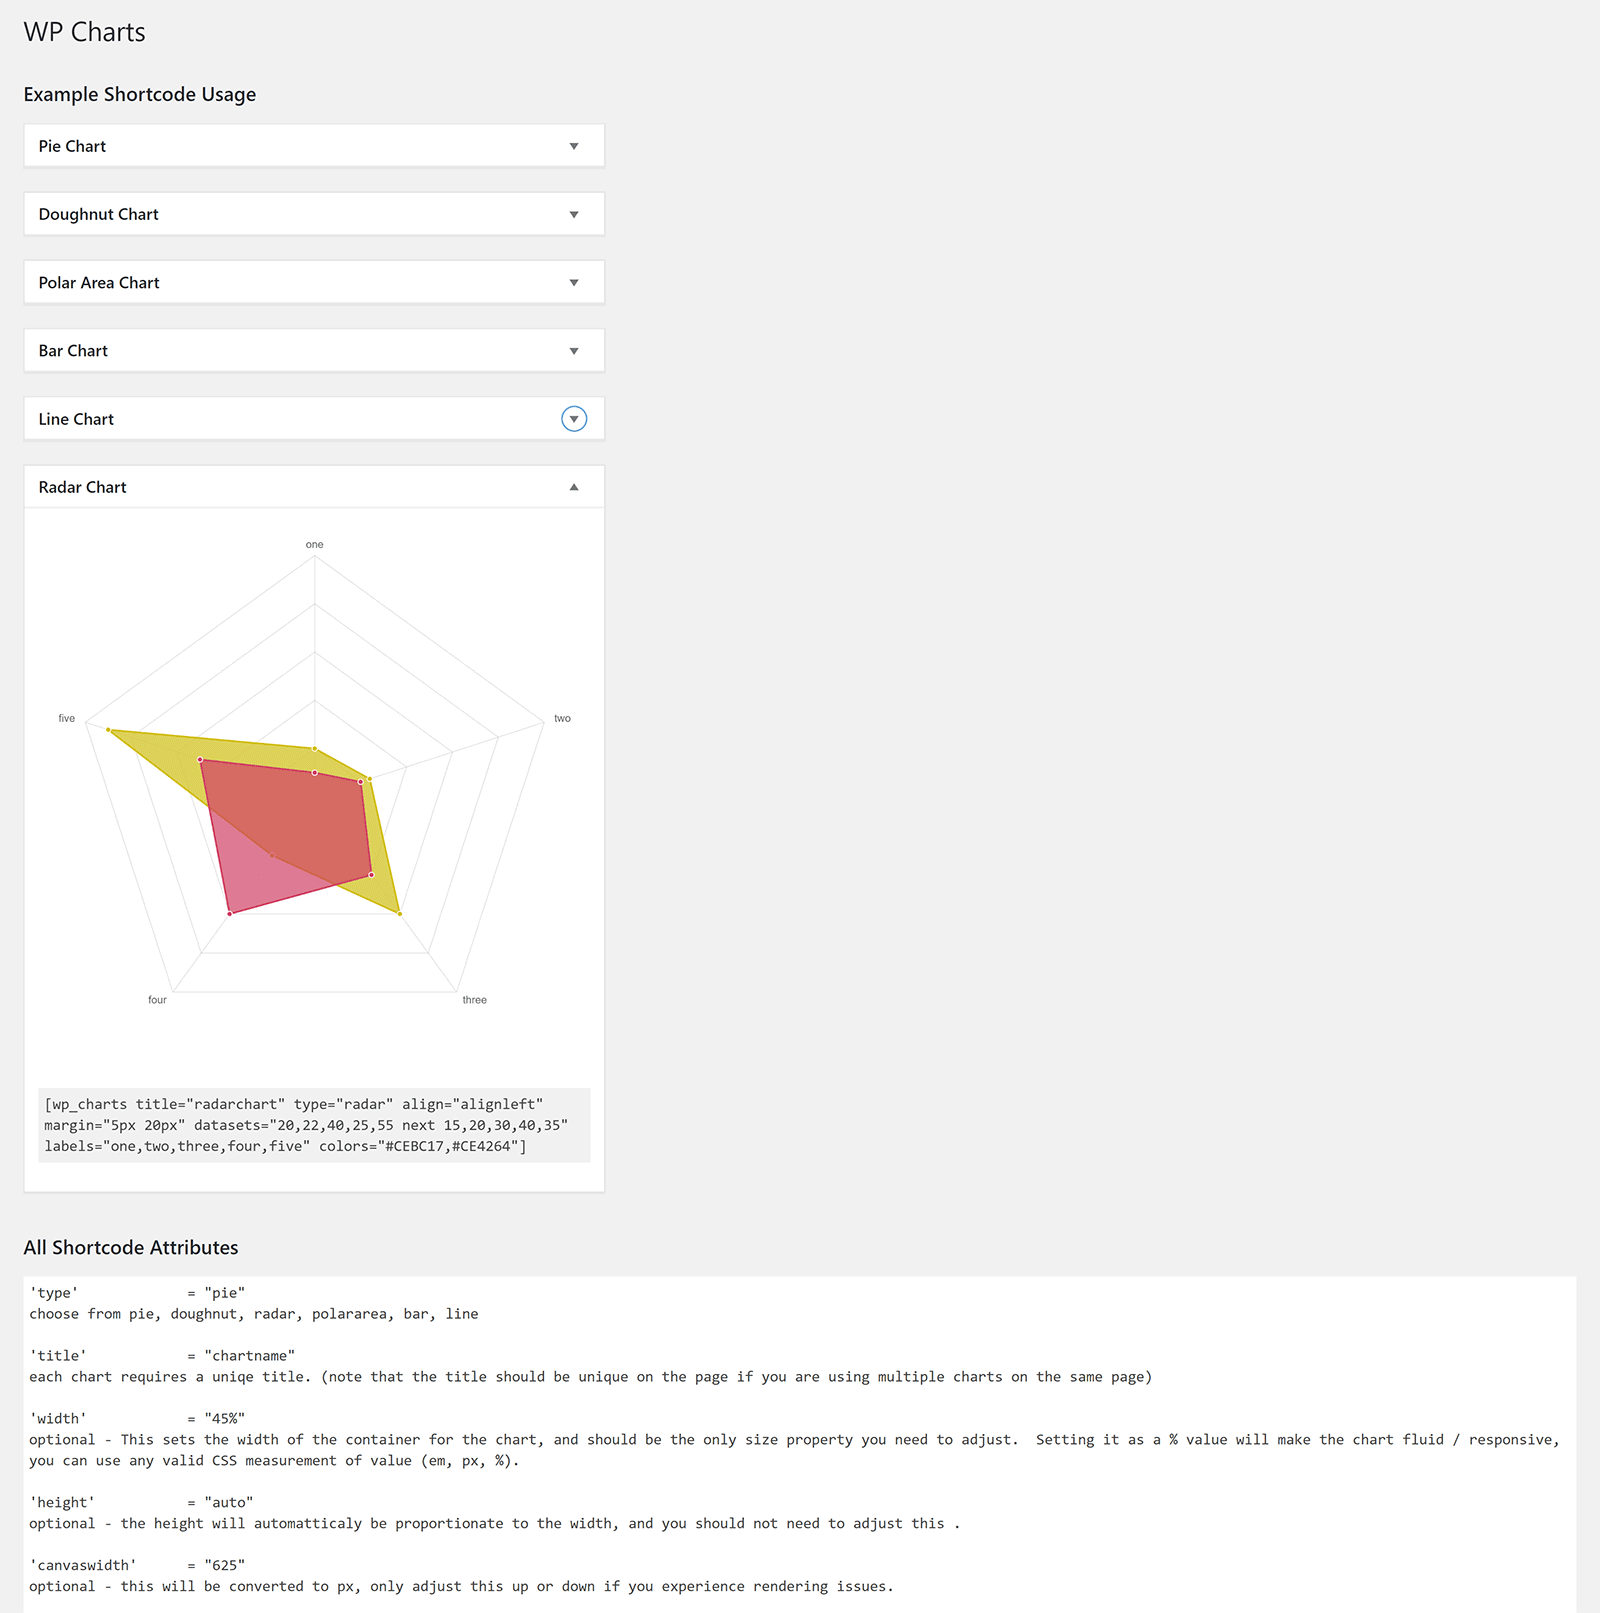
Charts look fantastic. They are fast loading and are animated when they first load on your page. It looks very professional.
To change any aspect of your chart, you simply need to modify the values and attributes in the chart shortcode.
If you are looking for a simple chart solution, WordPress Charts is a good option as it makes adding basic charts a breeze.
Those of you who are looking to add more complex charts may find the shortcodes system, and lack of options, a little frustrating; so I recommend looking for a more advanced solution.
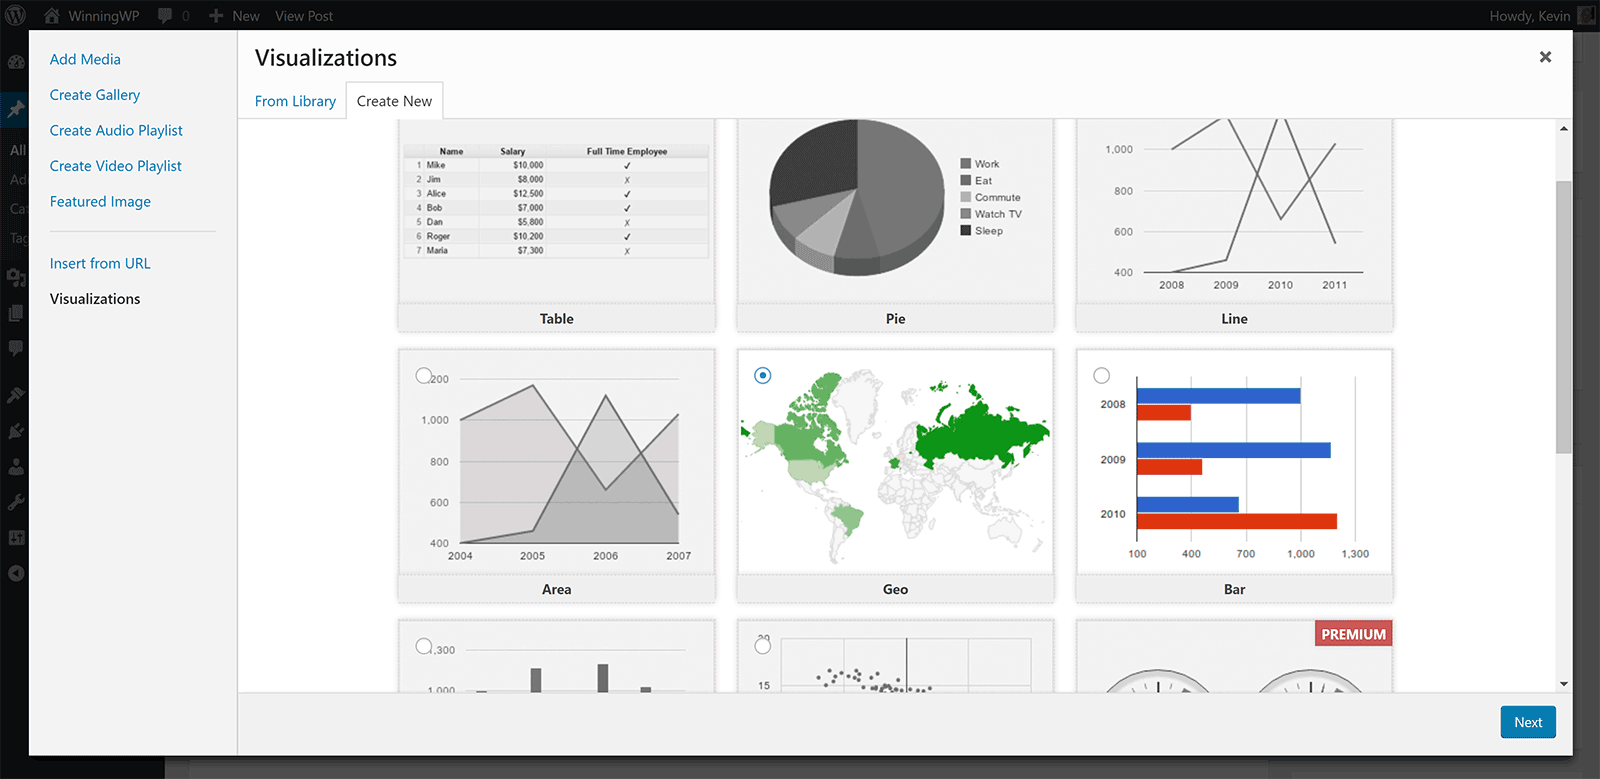
Visualizer is a versatile charts and tables solution from ThemeIsle.
In the free version you can create tables, pie charts, line charts, area charts, geo charts, bar charts, column charts, and scatter charts.
If you are using the WordPress classic editor, you will see a button for Visualizer in the toolbar. When Gutenberg is used, Visualizer will be available in the main block menu. Make sure “Visual Editor” mode is selected in both setups in order to see the Visualizer button.
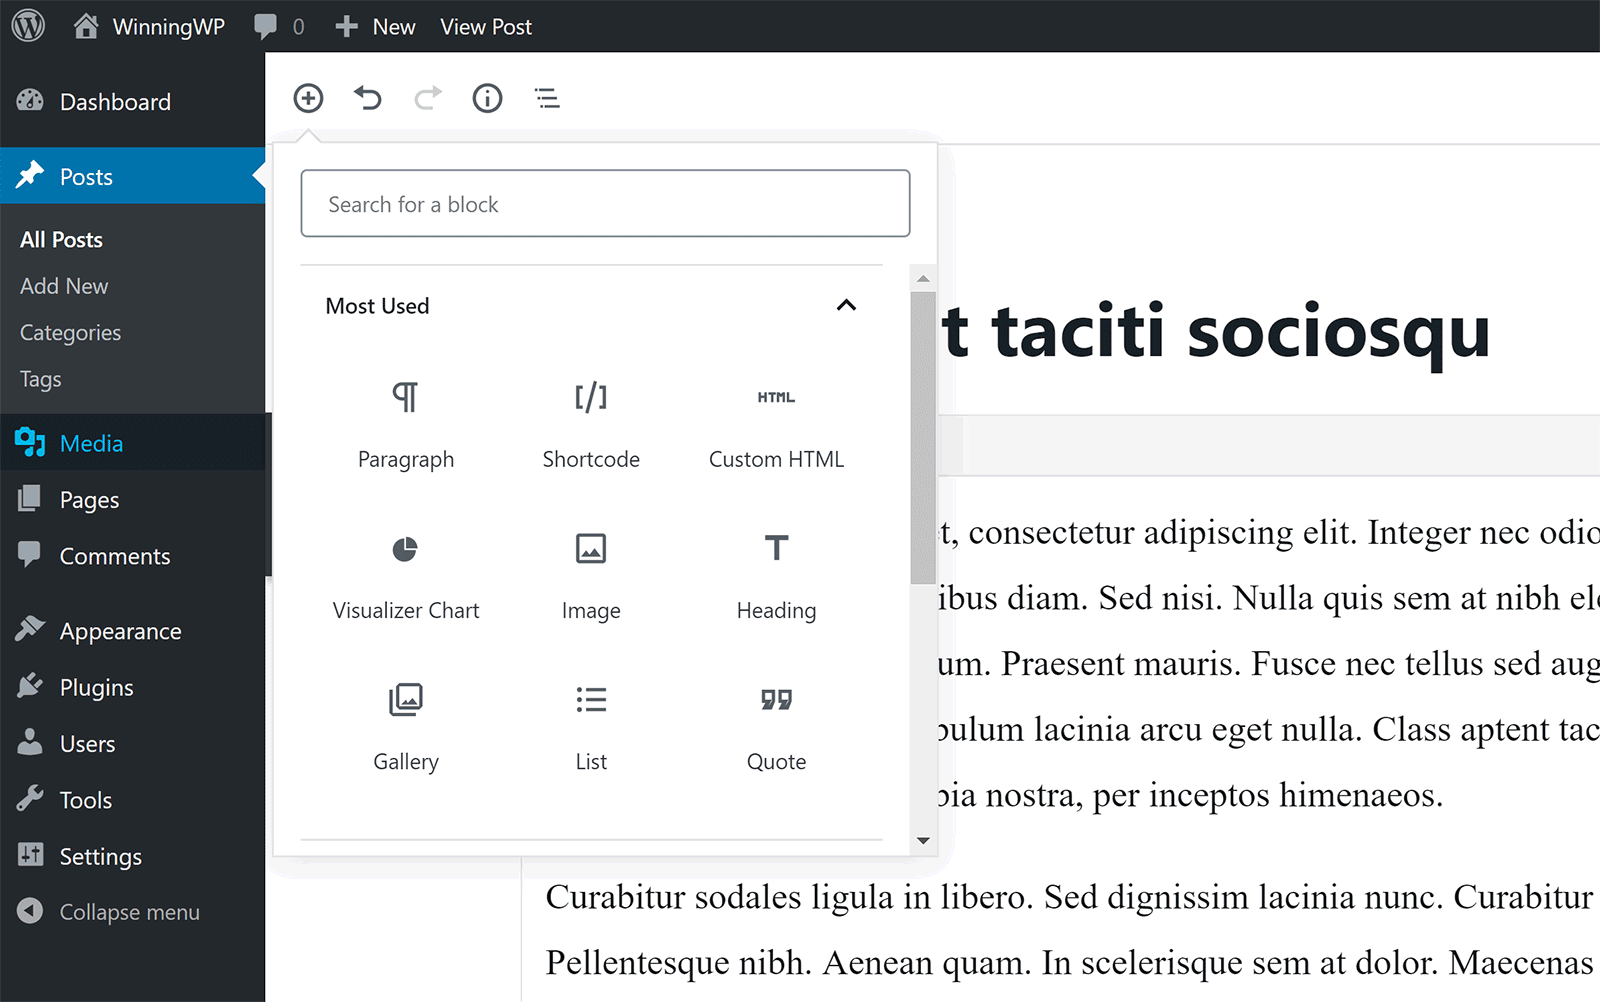
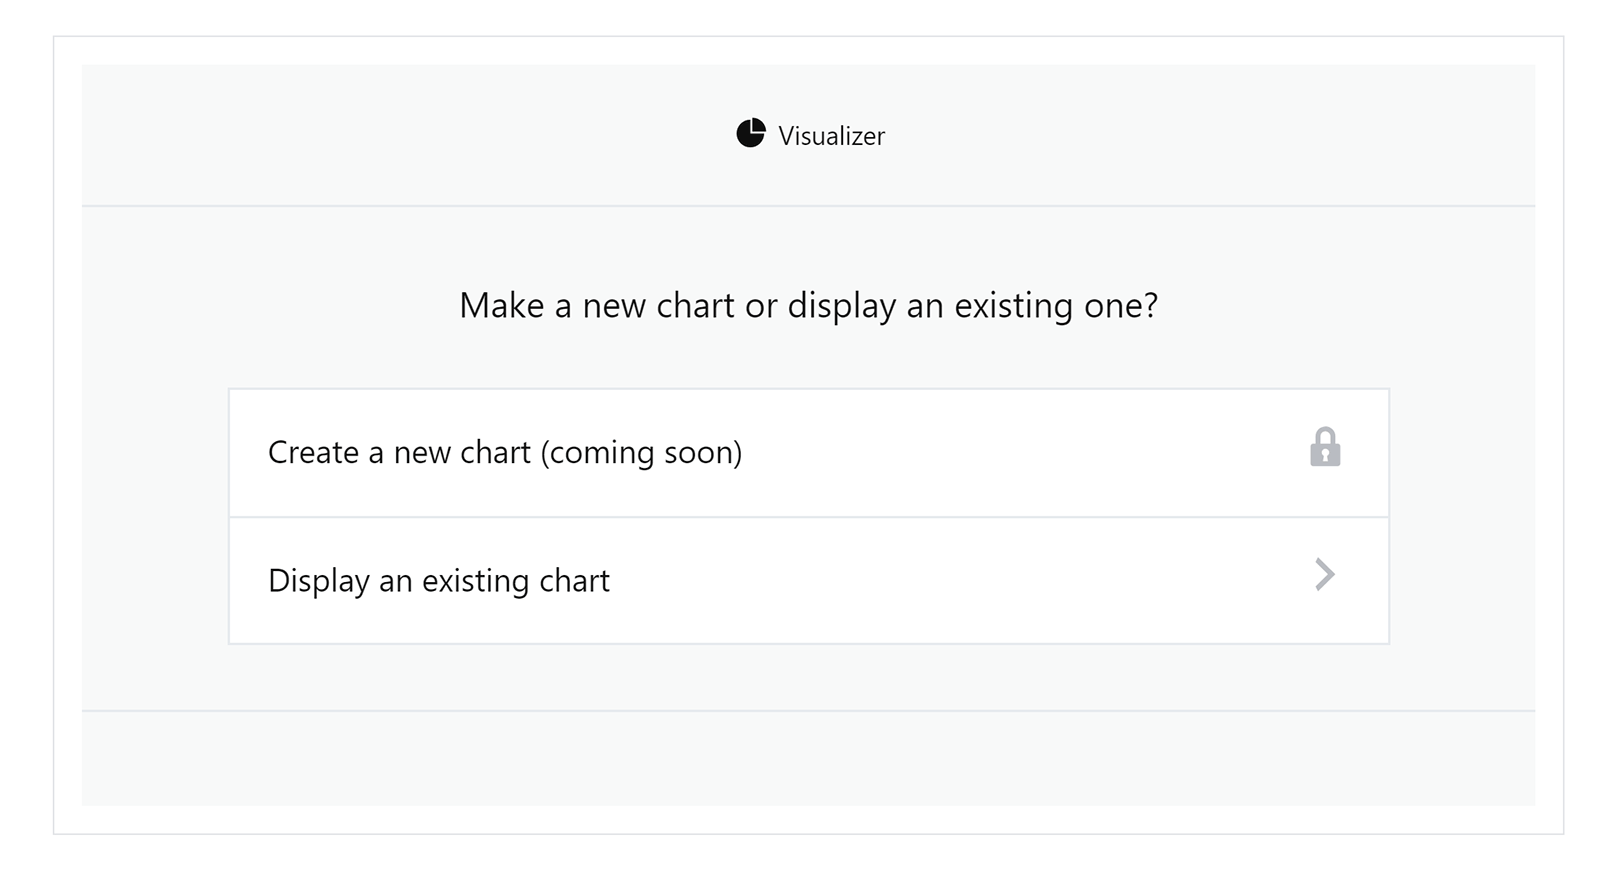
Unfortunately, when Gutenberg was being used I was unable to create a new chart. I had to switch to the classic editor in order to see available charts.
Bizarrely, you can insert charts you created previously when Gutenberg is activated. You just cannot create new charts.
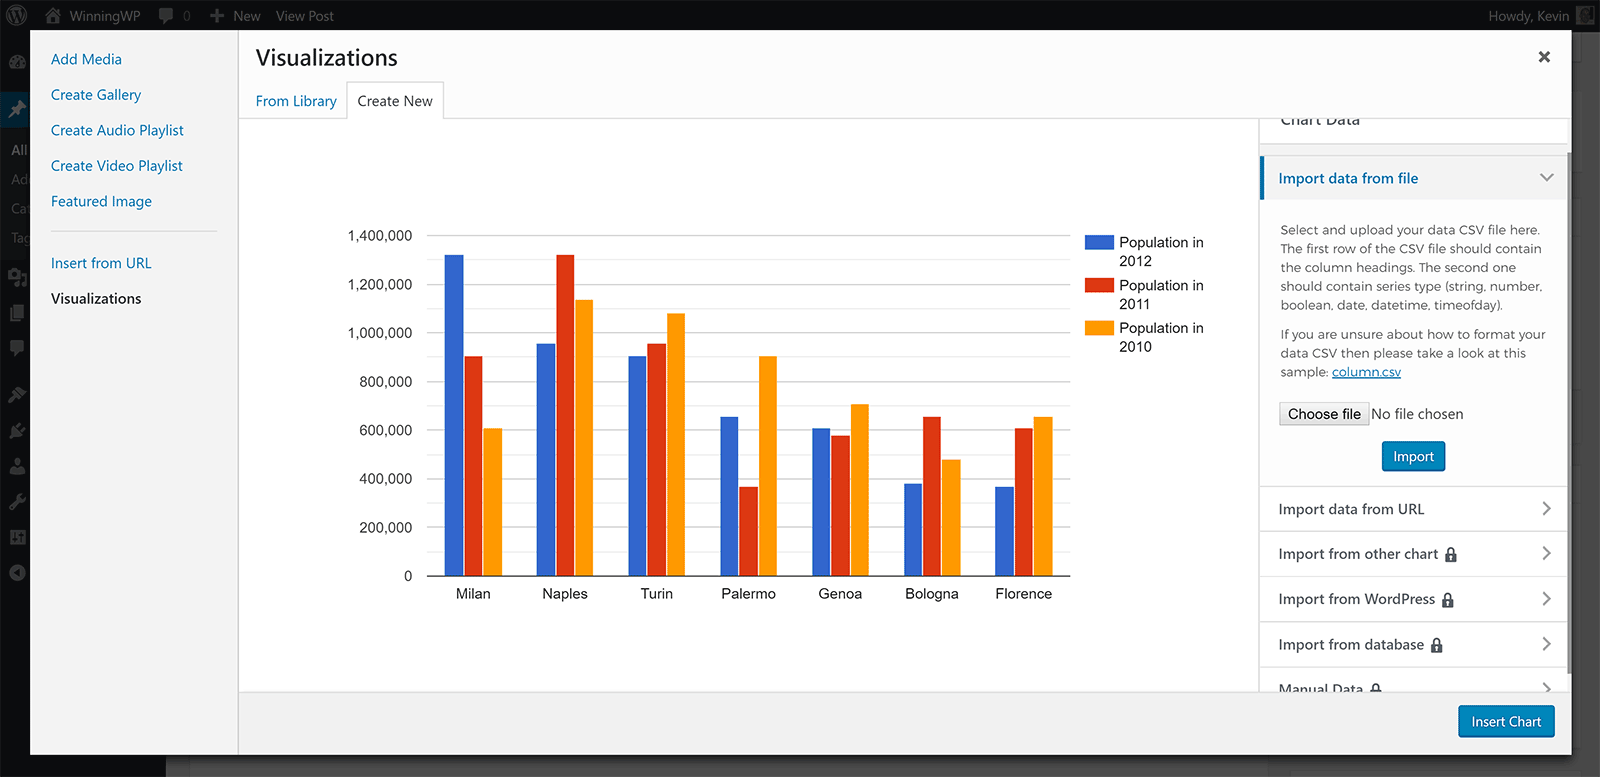
Switching to the classic editor will allow you to see all chart options. Premium chart options not available in the free version are listed here too.
Data can be uploaded for your table or chart from a CSV file. You can upload this directly or import from a URL.
A premium version of Visualizer is available from £57 per year. It adds four more chart types: Gauge, candlestick, timeline, and combo.
One of the coolest features of the premium version is the ability to create charts from posts, pages, and other custom post types. Additional options are made available for charts too and it adds functionality to create private charts and for users to edit charts.
Whilst the premium version of Visualizer adds many useful options, I suspect most WordPress users will be happy with the features available in the free version.
Easy Charts is a free charts solution that was developed using the uvCharts Javascript library.
A total of 12 chart types are available: Bar chart, stacked bar chart, step up bar chart, percent bar chart, area chart, stacked area chart, percent area chart, line chart, pie chart, donut chart, polar area chart, and waterfall chart.
Charts are added as a custom post type. You add data through a customisable table that lets you easily change figures. Columns and rows can be added at the click of a button.
A shortcode is displayed for your chart. If you prefer, you can insert charts using the Easy Charts button from the editor page. Then you simply select the chart you want to insert.
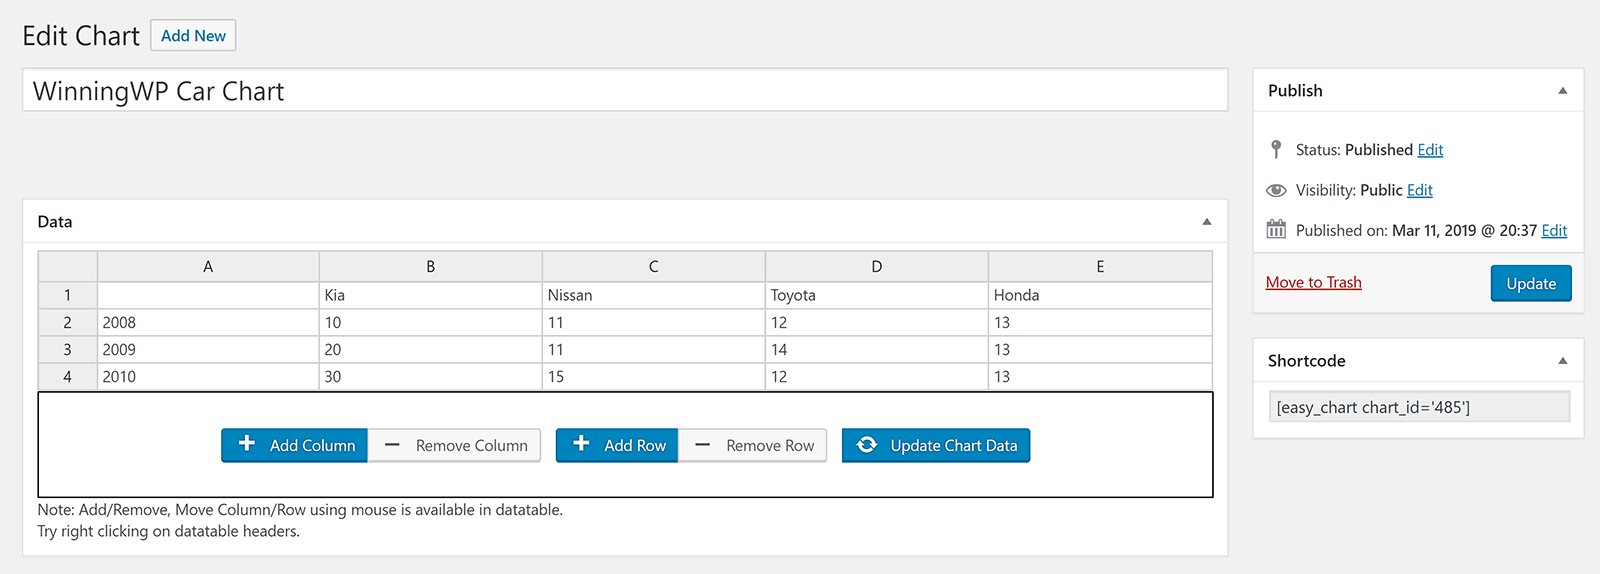
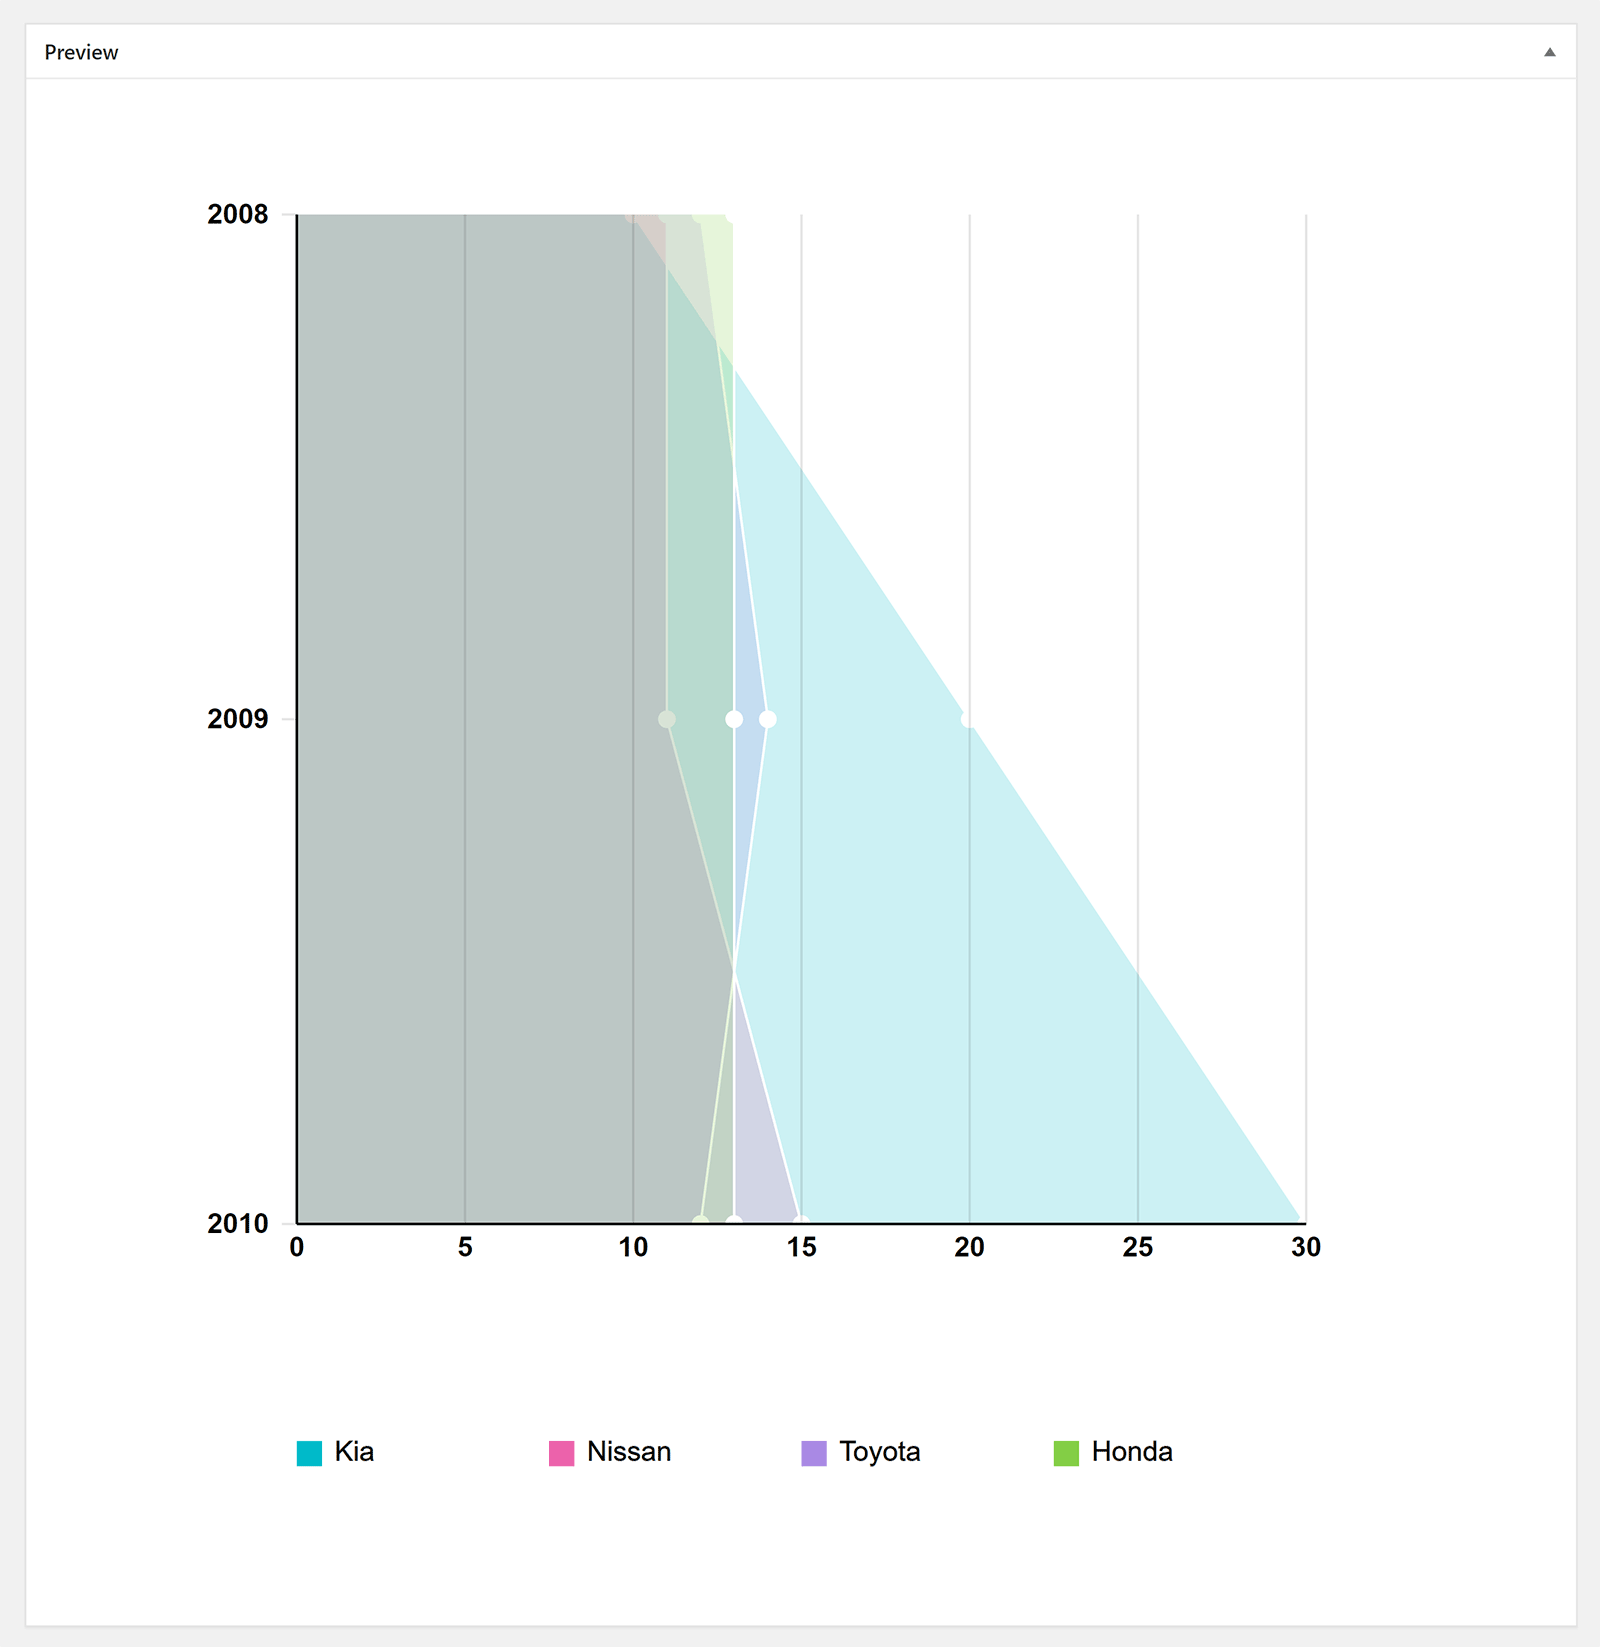
As long as you have saved your data, you will be able to see a preview of your chart.
By changing the chart type in the configuration area and then saving your chart again, you can see how your data looks in all 12 chart types.
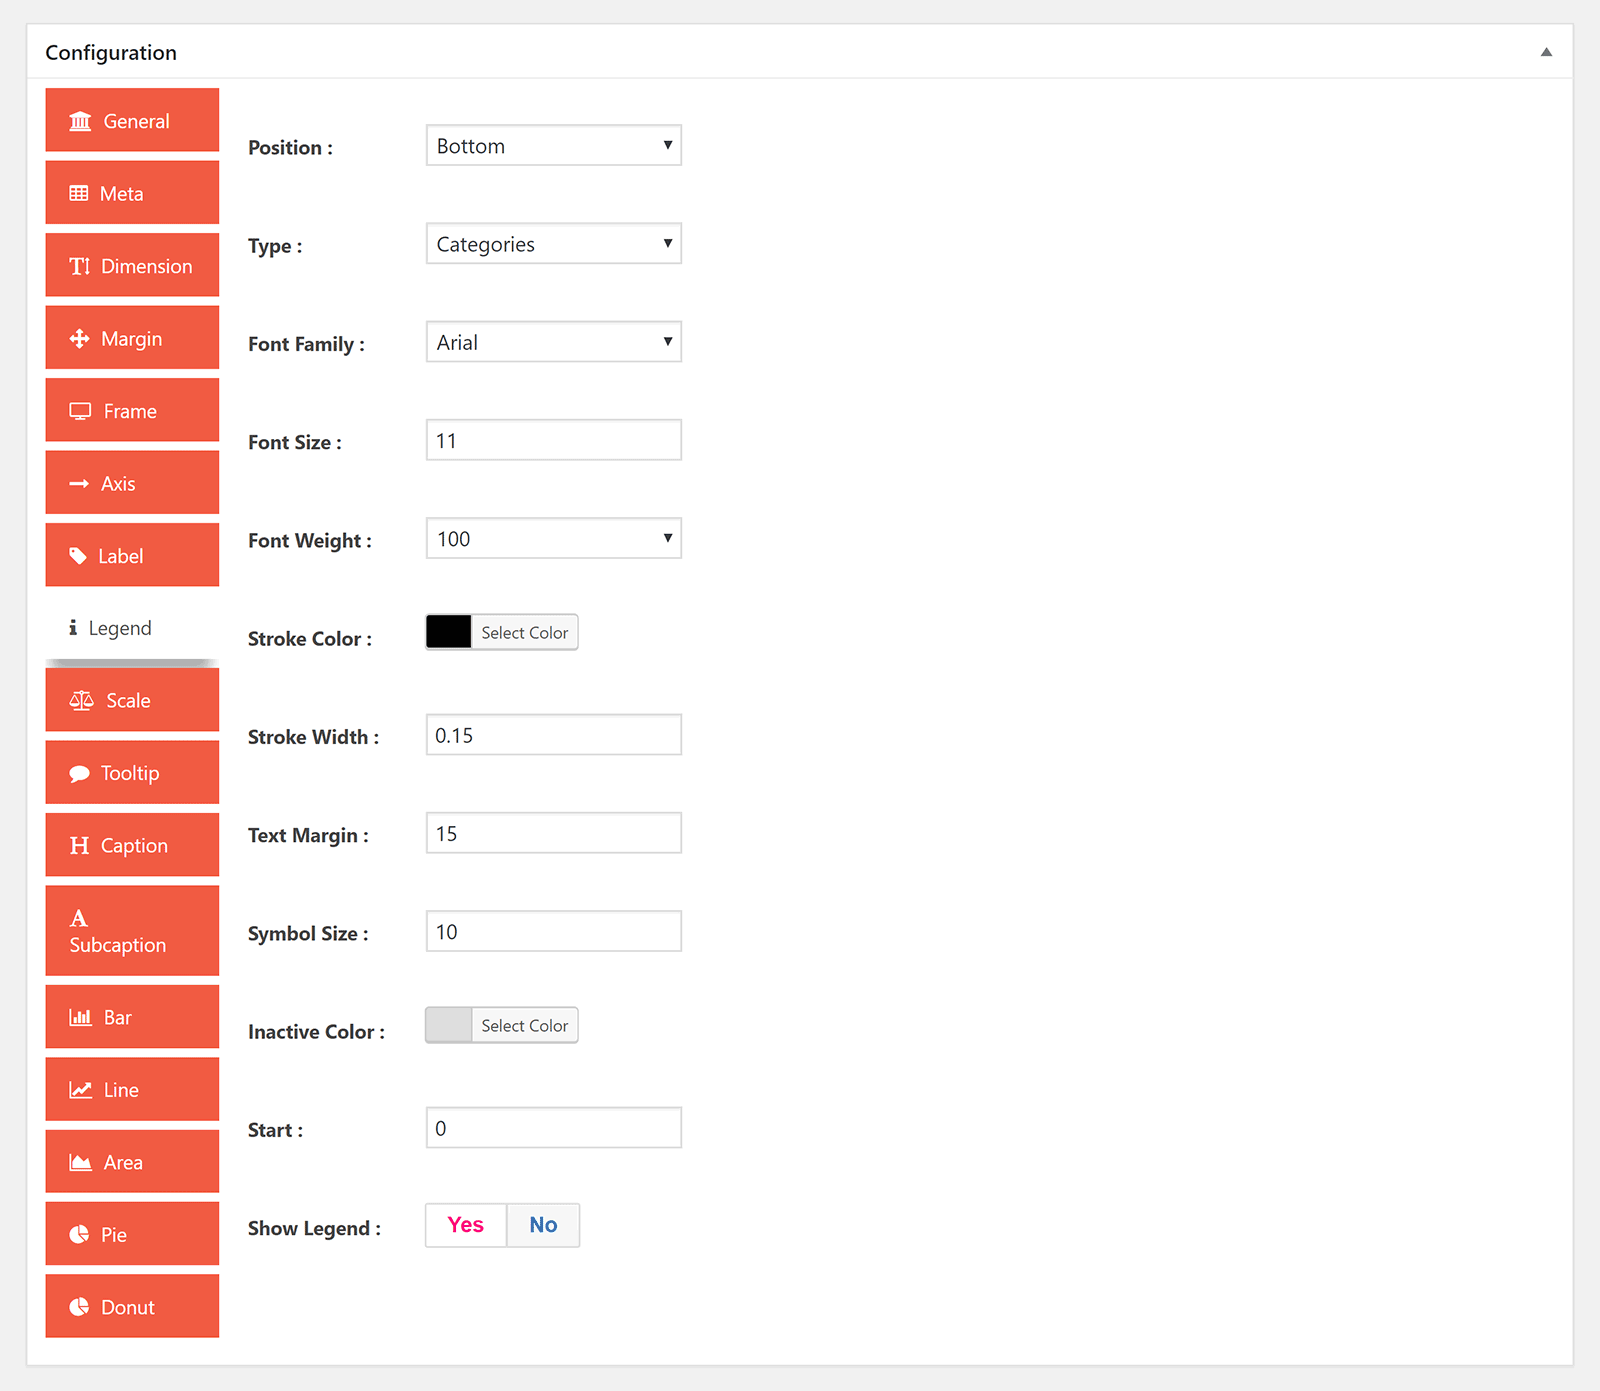
The number of customisation options available in Easy Charts is incredible. Every aspect of your chart can be modified, whether it be styling, margins, labels, typography, or captions.
There is no general settings area available for Easy Charts, however there is an information page that details features such as the ability for users to download charts as images.
With a ton of options, 12 chart types, and several pre-made colour schemes, Easy Charts is a great choice.
Developed using HTML5, the Vue.js Javascript framework, and Chart.js, WordPress Graphs & Charts is a simple solution that supports eight chart types.
The available chart types are pie chart, doughnut chart, polar chart, bar chart, line chart, radar chart, bubble chart, and scatter chart.
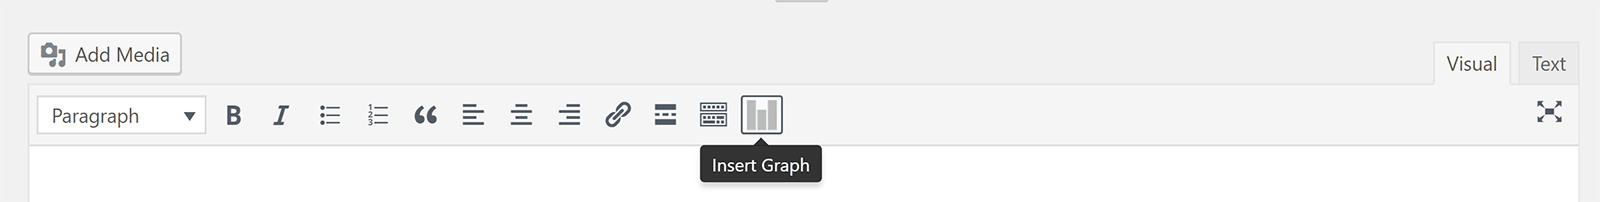
If the classic editor is activated, you will see a button to “Insert Graph” in your editor toolbar. Unfortunately, when Gutenberg is active, there is no block available for WordPress Graphs & Charts. This is obviously an issue that needs to be resolved since Gutenberg is active by default in WordPress now.
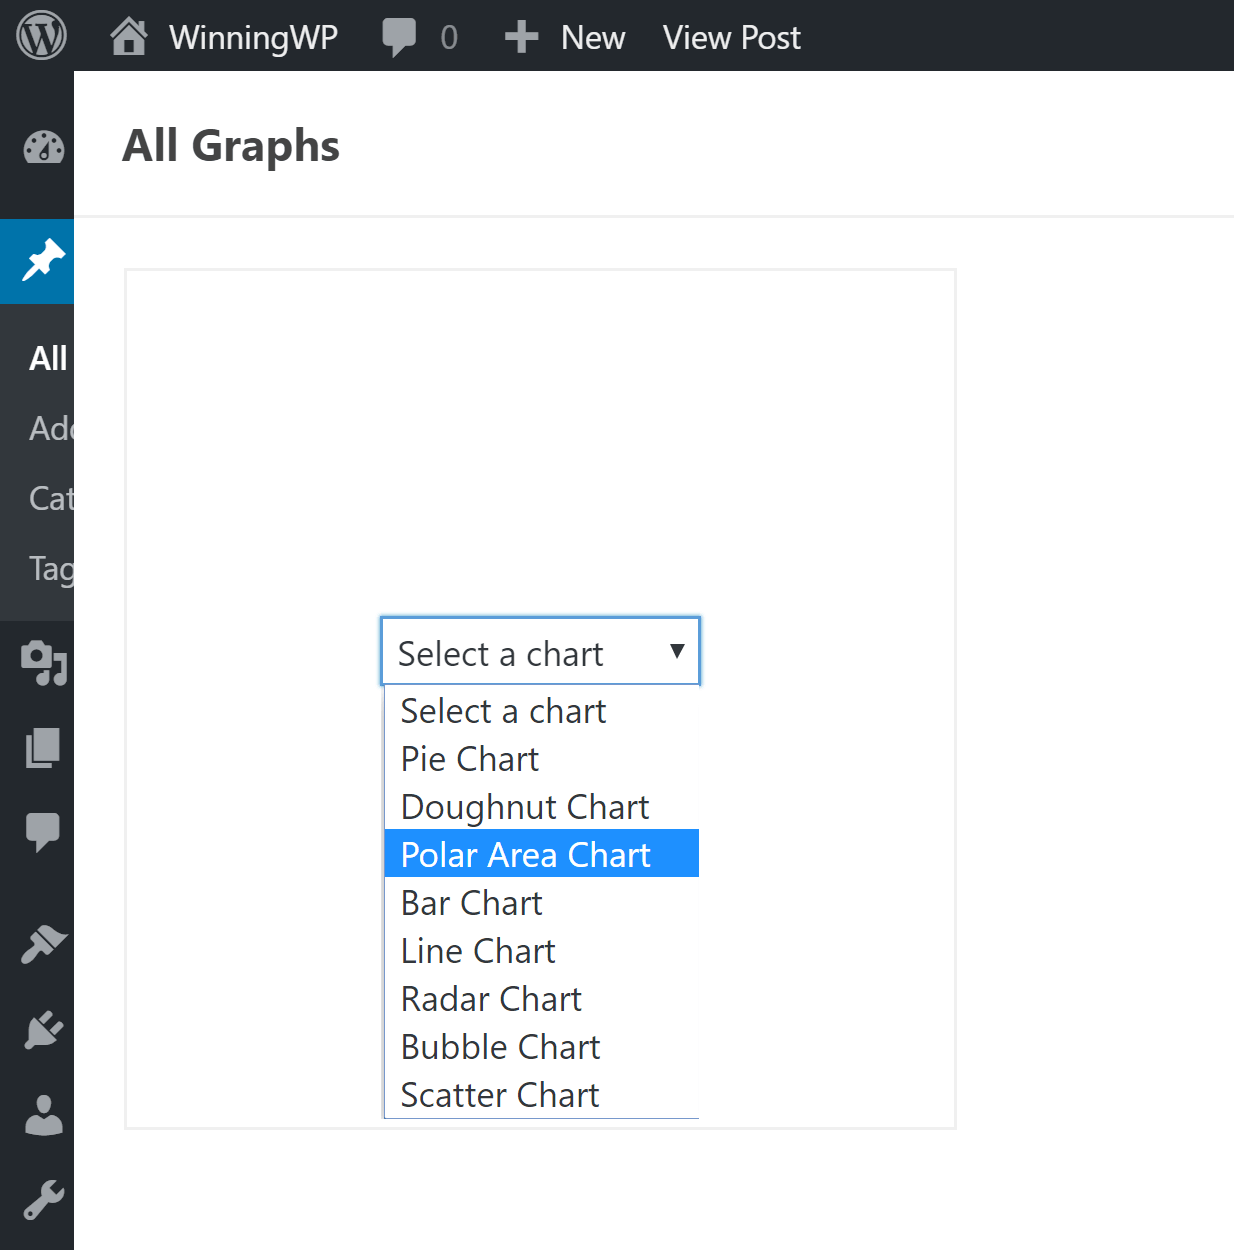
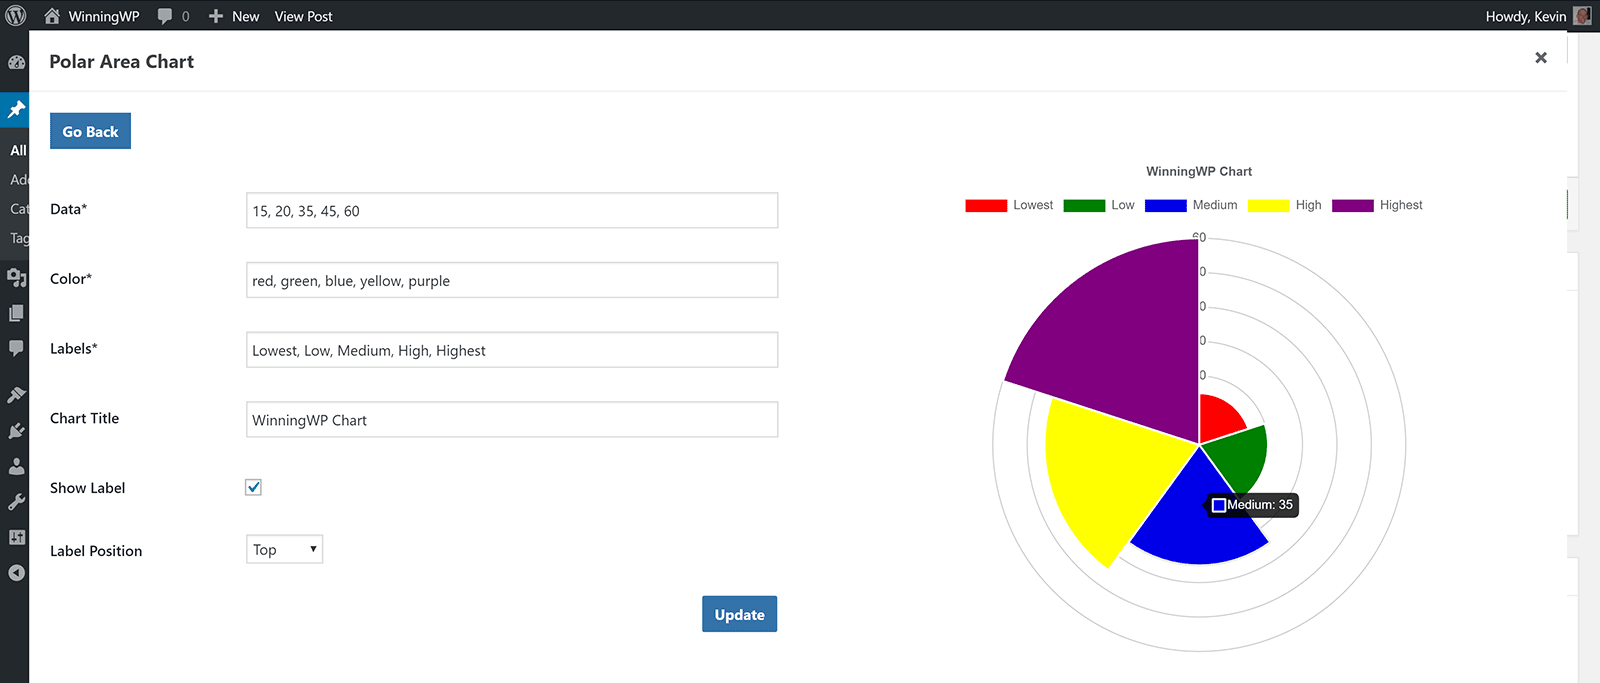
When you click on the “Insert Graph” button you will be invited to add a graph. You can then select the type of graph you would like to use.
I love how the plugin lets you add data to a chart. Whenever you add data, define labels, or change colours, the modifications are immediately updated in the chart preview at the right-hand side. In this regard, it works in a similar way to the WordPress customiser.
When you are finished, the chart will be inserted into your content area via a shortcode. You can go back and edit your charts at any time by clicking on the “Insert Graph” button again. A list of your created charts will be displayed there.
WordPress Graphs & Charts is a good alternative to WordPress Charts. It’s a basic plugin that does not allow you to change the chart type of charts you have created. Nor does it allow you to upload data via CSV files.
Despite these limitations, it is easy to recommend WordPress Graphs & Charts to anyone who is just looking to add simple charts and graphs into their content. Hopefully they will add support for Gutenberg in the future.
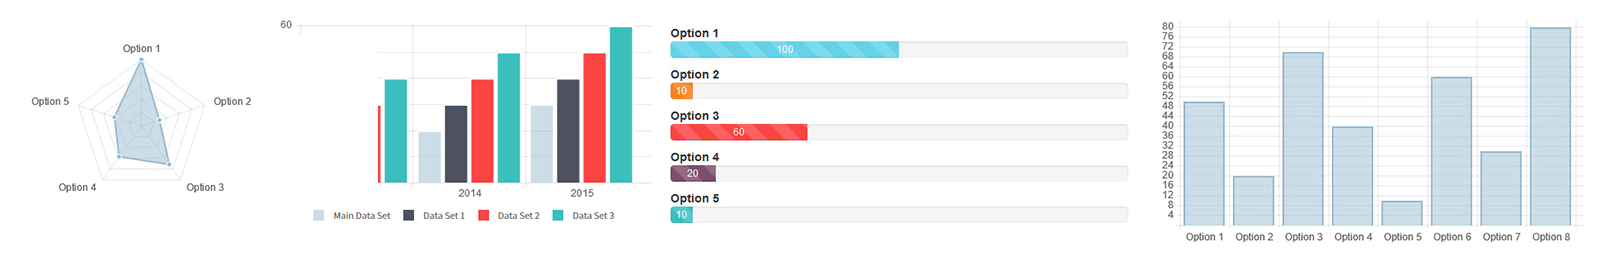
Responsive Charts is an affordable chart solution that lets you create seven animated chart types.
All charts are created using Charts.js. The seven chart types are pie chart, doughnut chart, bar chart, line chart, polar chart, radar chart, and bootstrap progress bars.
Charts can be inserted into your content using shortcodes or directly into page templates using PHP. In the chart settings area you can name your chart, select your chart type, and define the width of the chart.
There is a large style settings area with dozens of options too. From here you can change margins, padding, typography, and colours.
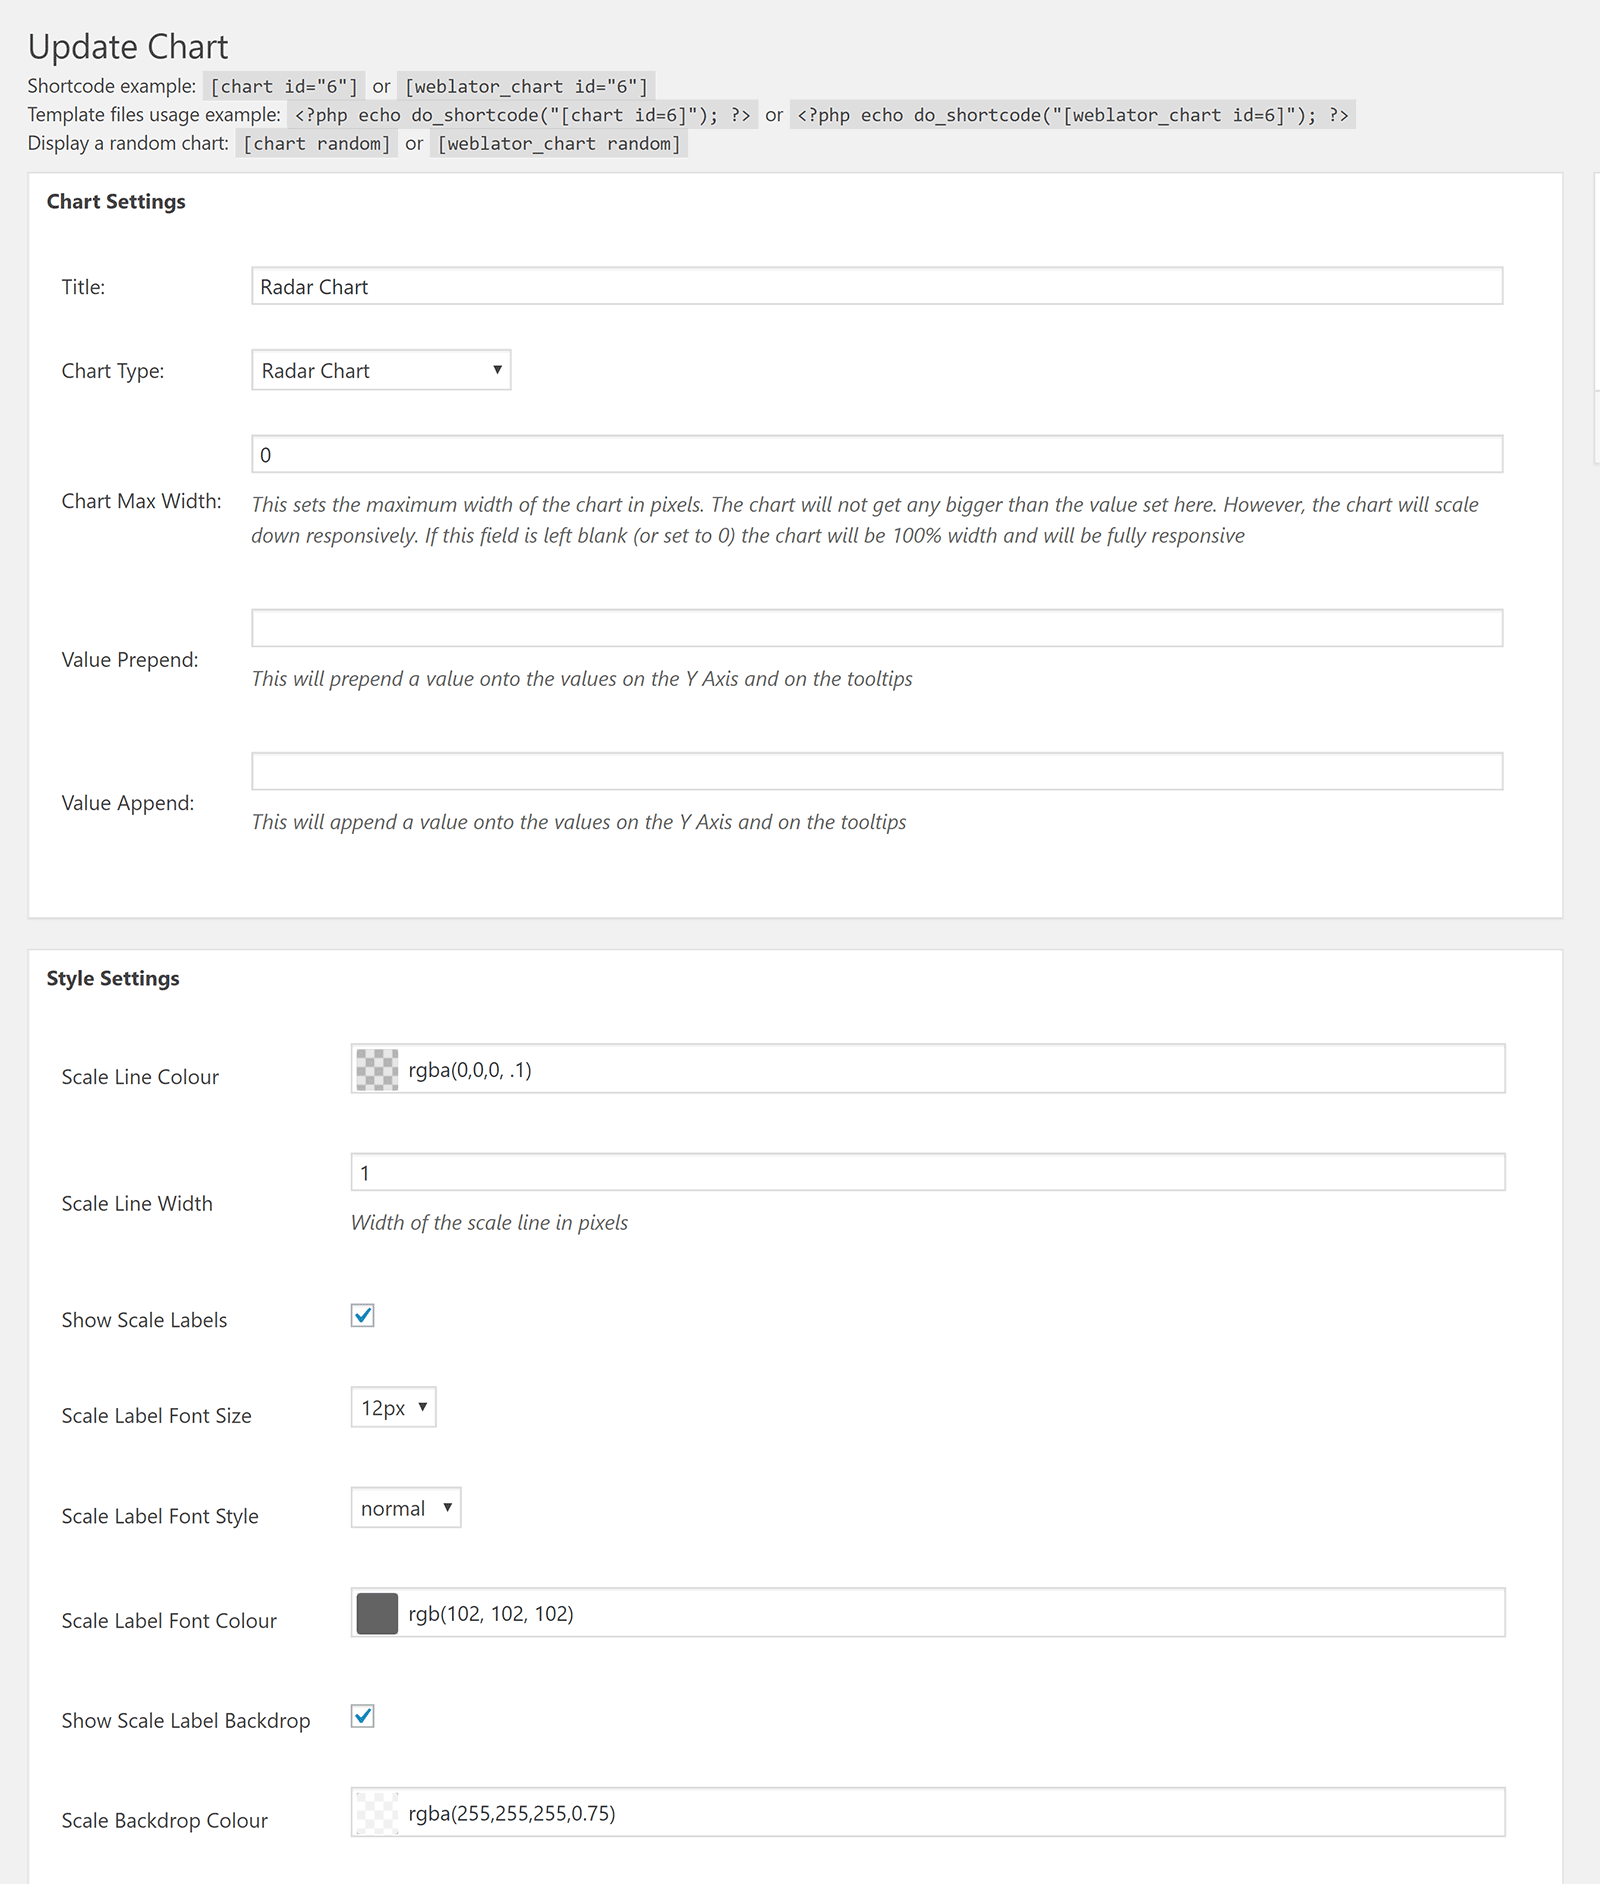
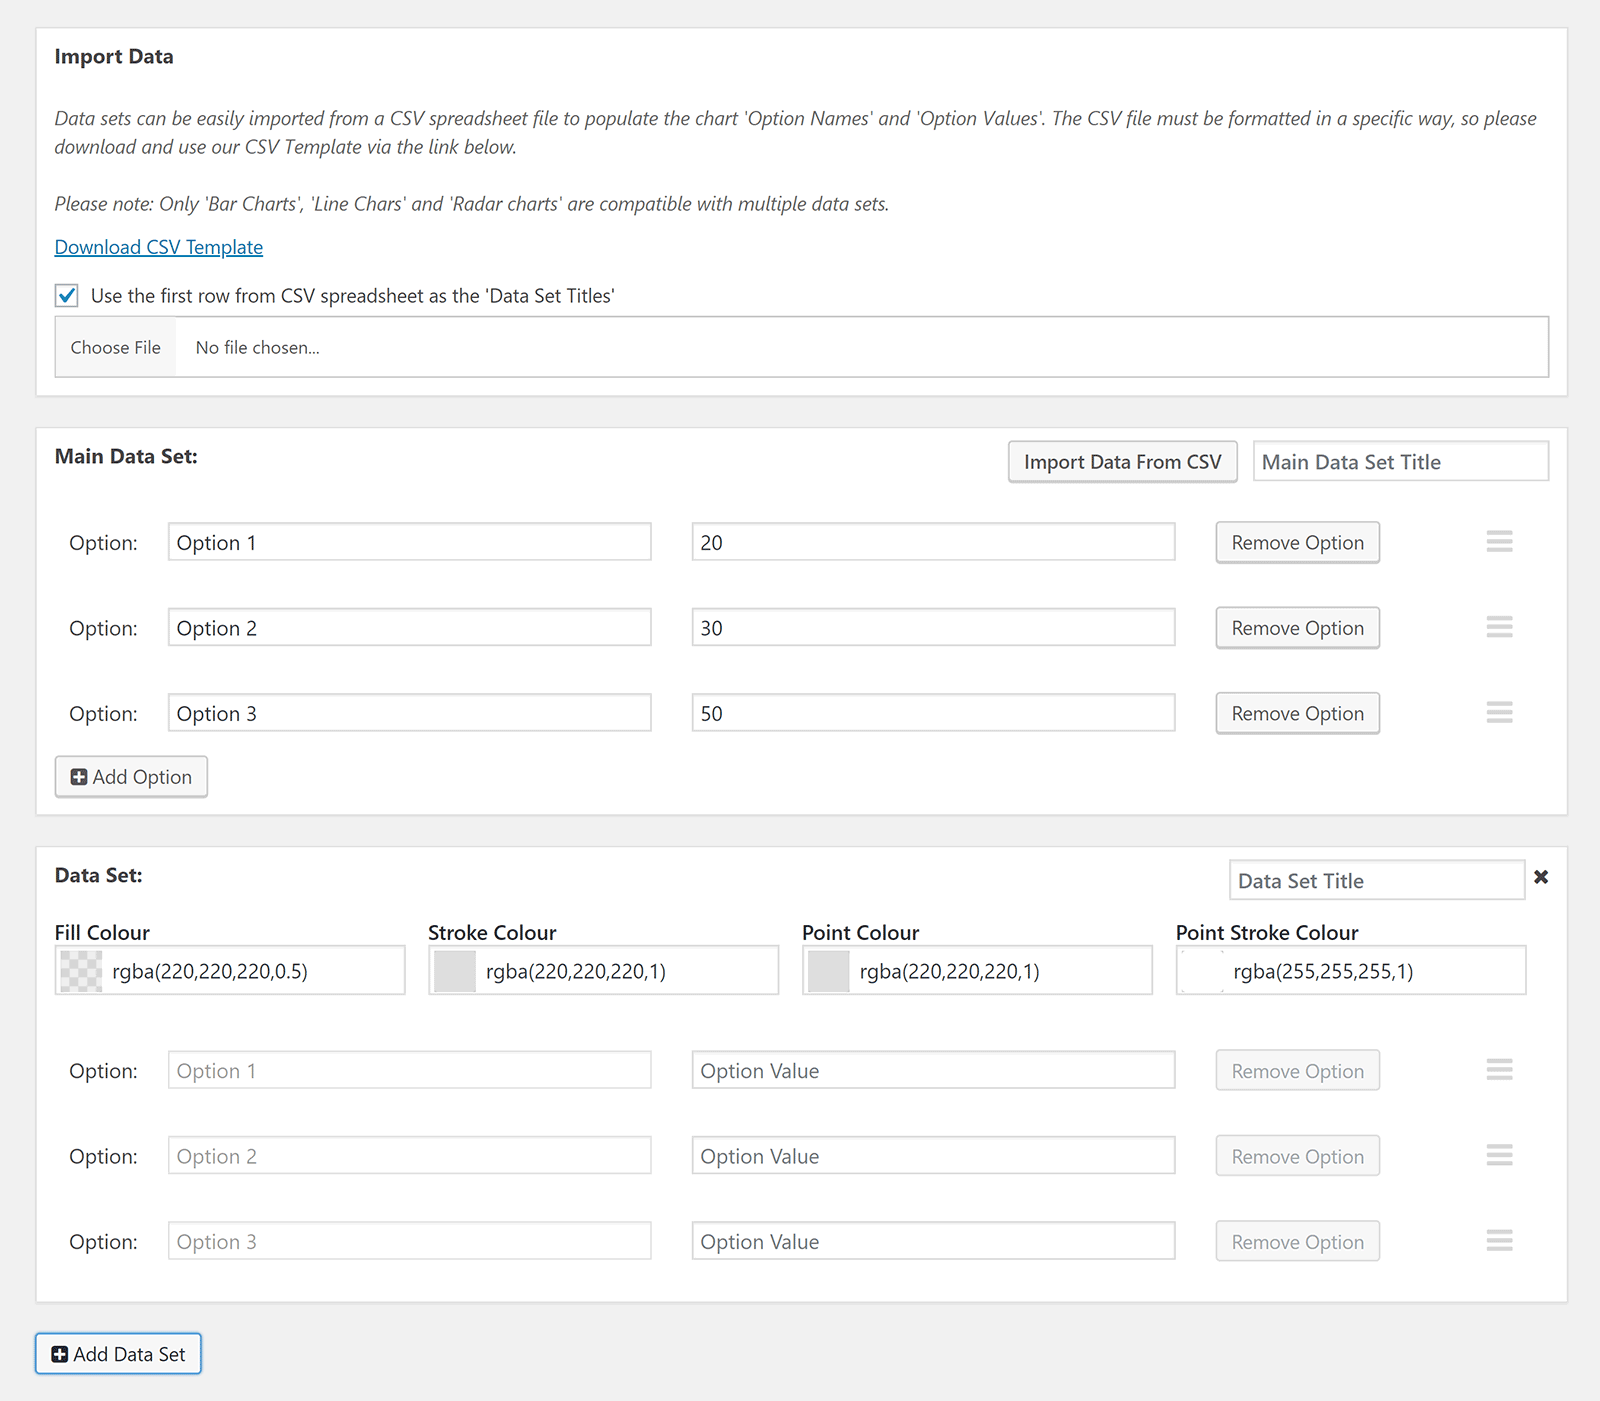
Data can be inserted manually at the bottom of the page in multiple data sets.
If you prefer, you can upload data directly via a CSV file. A CSV template is provided to help you see how the data can be organised before uploading.
Unfortunately, there is no way to preview your chart whilst creating it. You need to insert the shortcode into your content area to preview the chart and see any changes you made.
Thankfully, the charts that are inserted into your website look great.
Whilst it is not free to download, at $16 Responsive Charts is a fairly affordable solution. It has a lot of useful styling options and lets you upload large amounts of data using CSV files.
Be sure to check out the admin demo of Responsive Charts to get a better understanding of what the plugin can do.
In comparison to other charts plugins in this article, AmCharts: Charts and Maps is geared more towards advanced WordPress users than beginners. The plugin was developed by the charts and maps Javascript service amCharts.
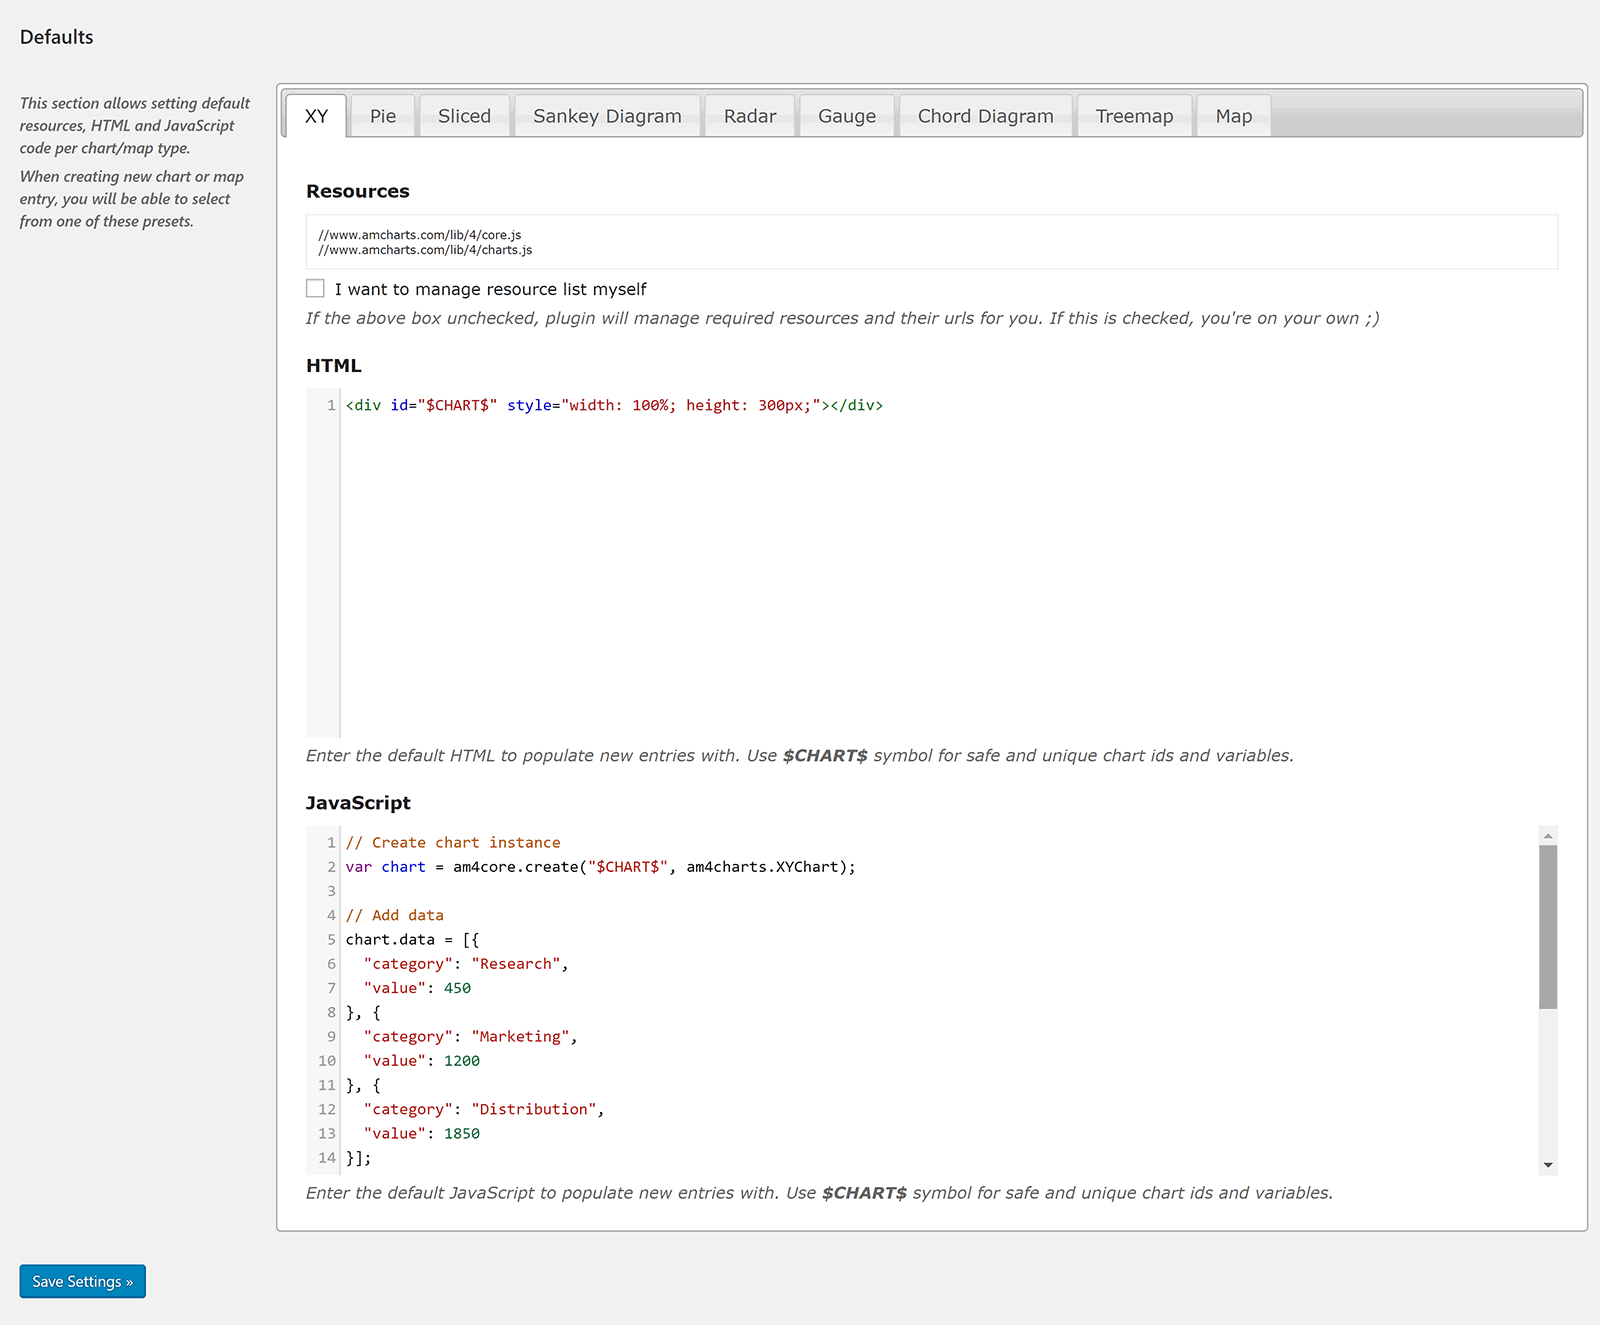
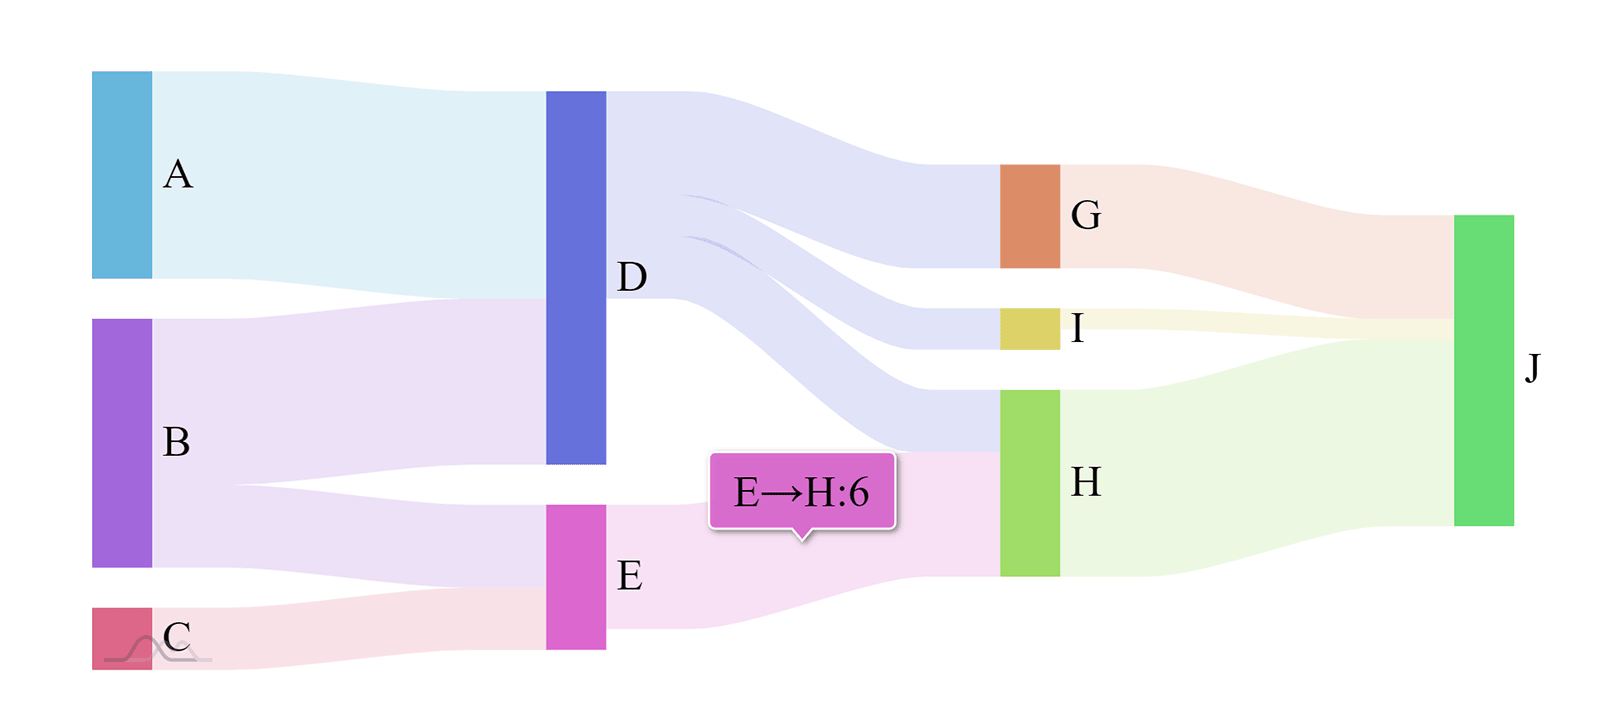
Nine types of charts are available: XY chart, pie chart, sliced chart, sankey diagram, radar chart, gauge chart, chord diagram, treemap, and map.
In the plugin settings area you can choose whether resources are stored remotely or locally. You can also add custom resources to the existing extensive list of Javascript libraries.
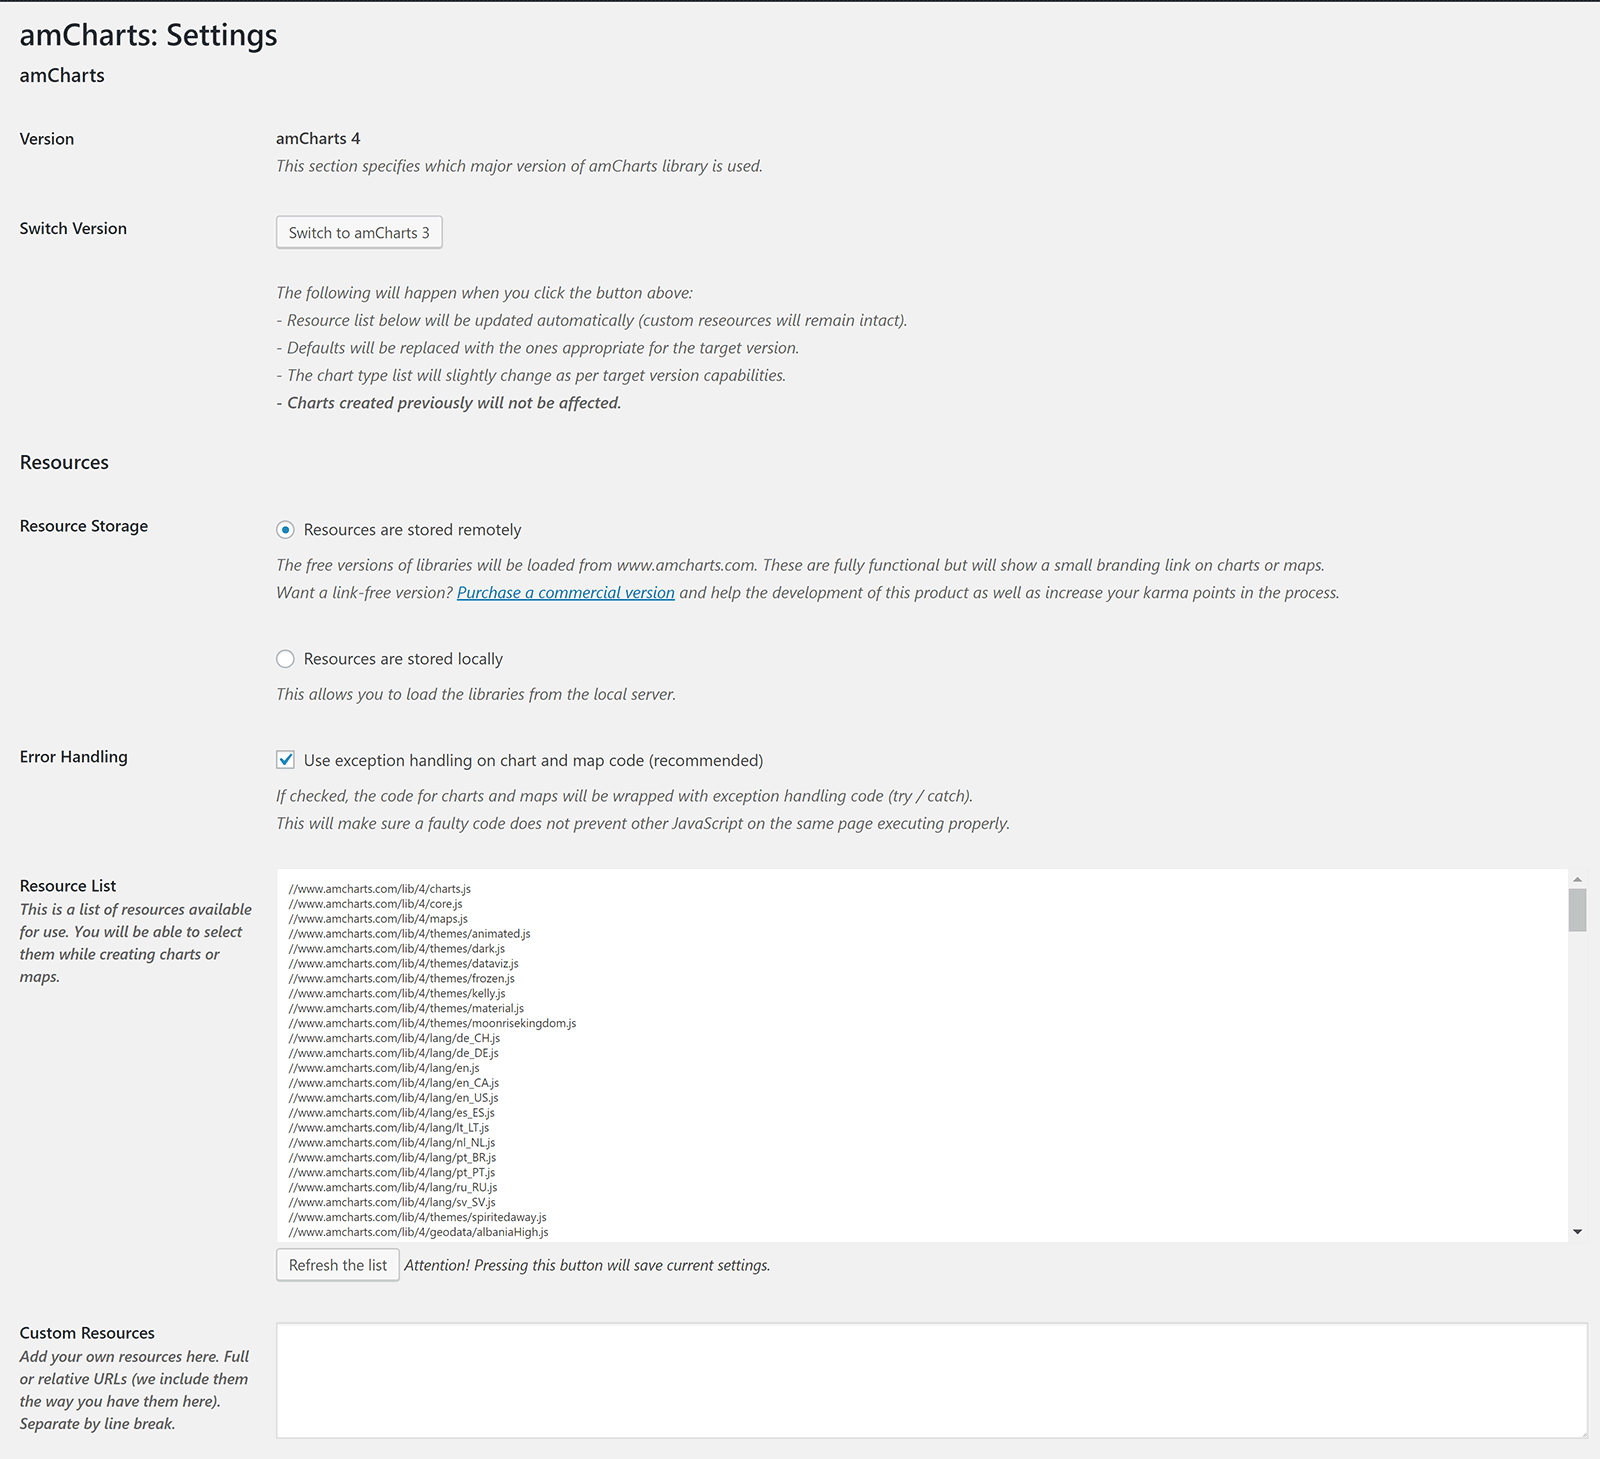
For each type of chart you can define the default Javascript resource libraries, HTML, and Javascript, that is used. These settings will be used as a starting point for whatever new chart you select. You can then modify the data as you see fit.
Once you know how it works, you will appreciate how powerful amCharts can be.
You can change a chart from one type to another at any time, but be aware than when you do this, all the data in the resources box, HTML box, and Javascript box, will revert back to the settings you defined in the main plugin settings page for that particular chart type.
AmCharts: Charts and Maps is one to check out if you are an advanced user who wants more control over the Javascript libraries that are used.
If you do use the main amCharts service, you should also check out the amCharts Embed WordPress plugin from Rami Yushuvaev that lets you embed amCharts charts you have created.
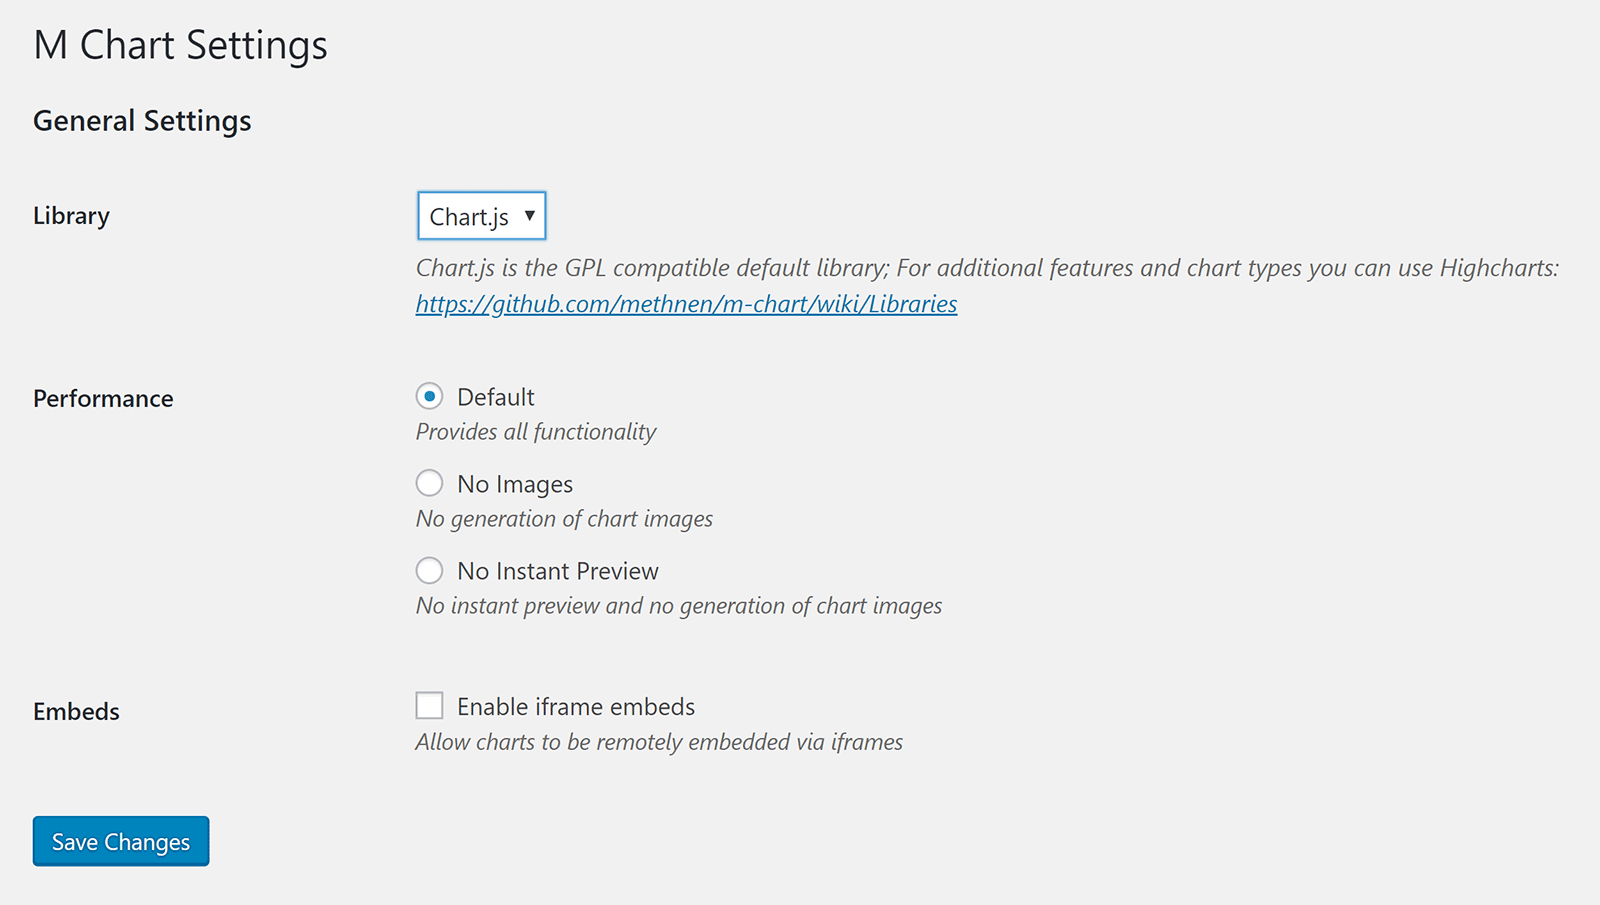
M Chart is a free WordPress plugin that lets you use either Chart.js or Highcharts libraries.
The general settings page lets you decide whether charts are previewed and whether remote embedding of charts is allowed.
Only four chart types are available: Line chart, column chart, bar chart, and pie chart.
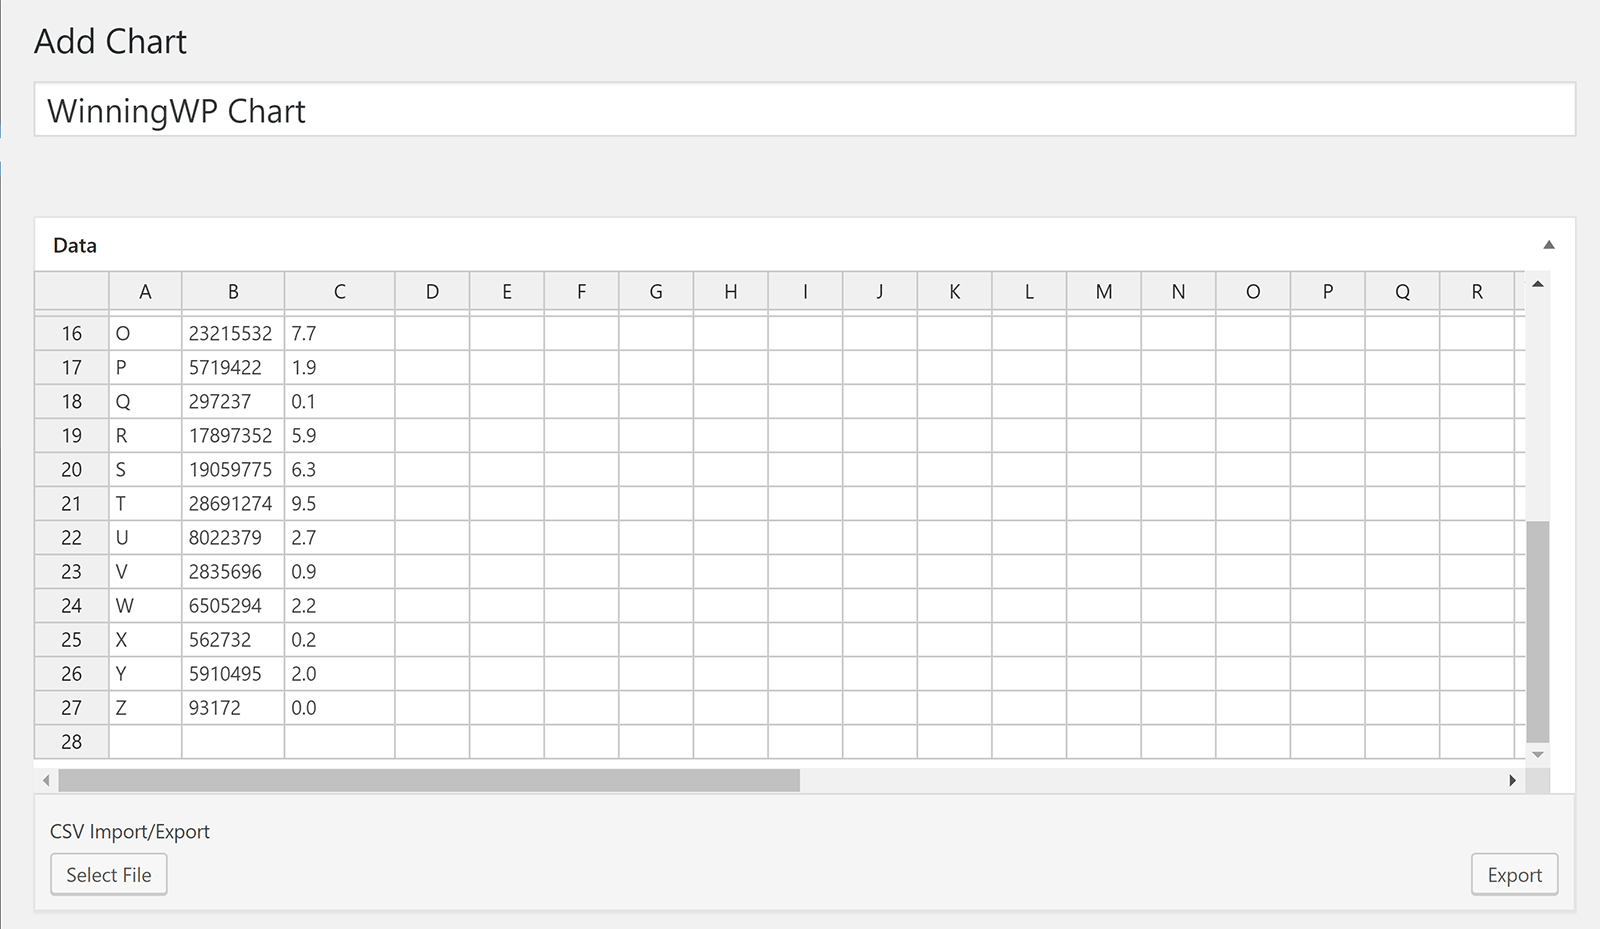
Data can be easily added to your chart by adding your values to a table. You simple double-click on a cell and then enter your data.
If you prefer, you can upload data using a CSV file.
There is also an option to export chart data to a CSV file. This is a great feature and something that is missing from most other chart plugins.
A preview of your chart is dislayed underneath the data section. When you change your chart type in the section below the preview area, the preview is automatically updated.
The height of your chart can be defined and you can choose to display a legend.
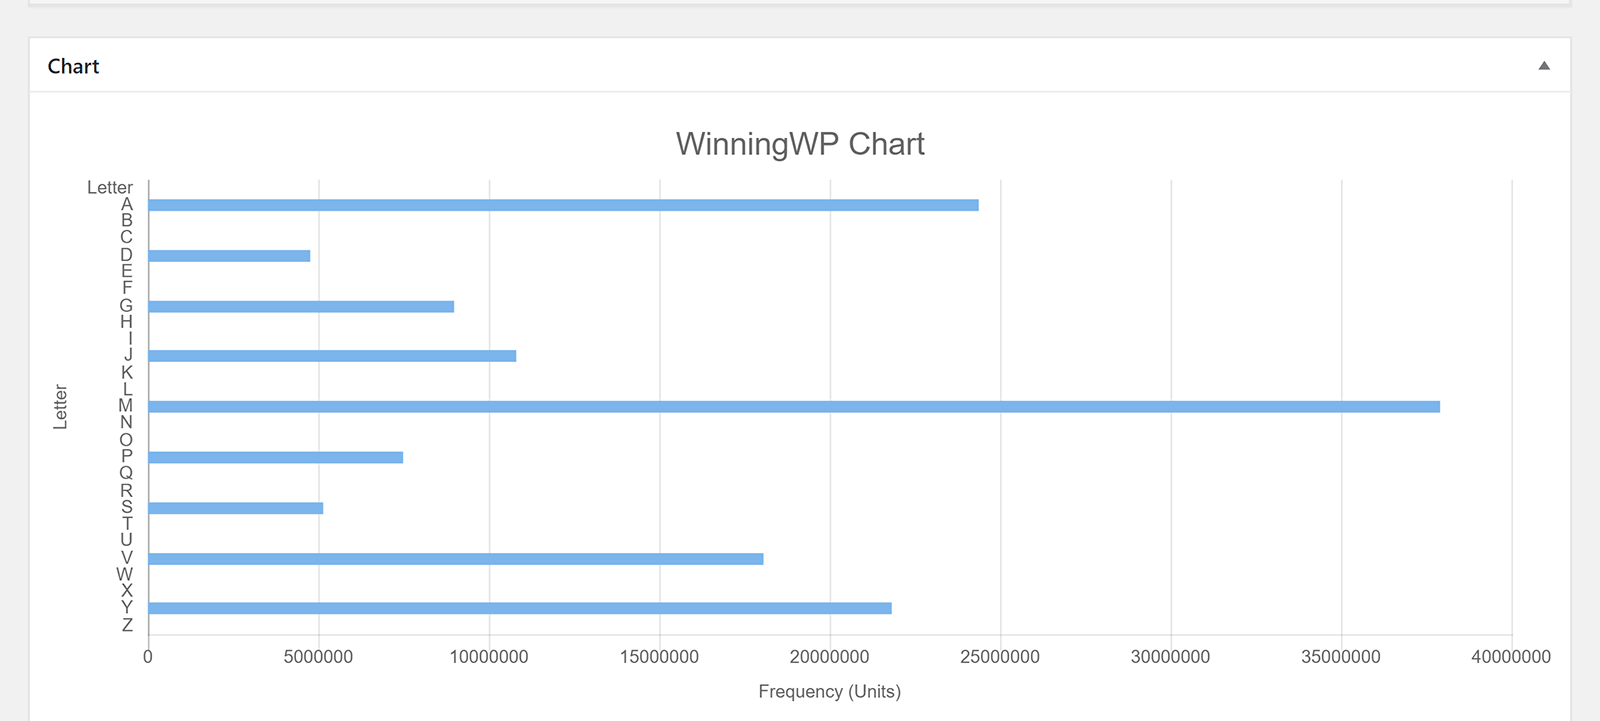
For each axis you add a title and select a unit. You can select from dozens of types of units including distance, currency, website traffic, and more.
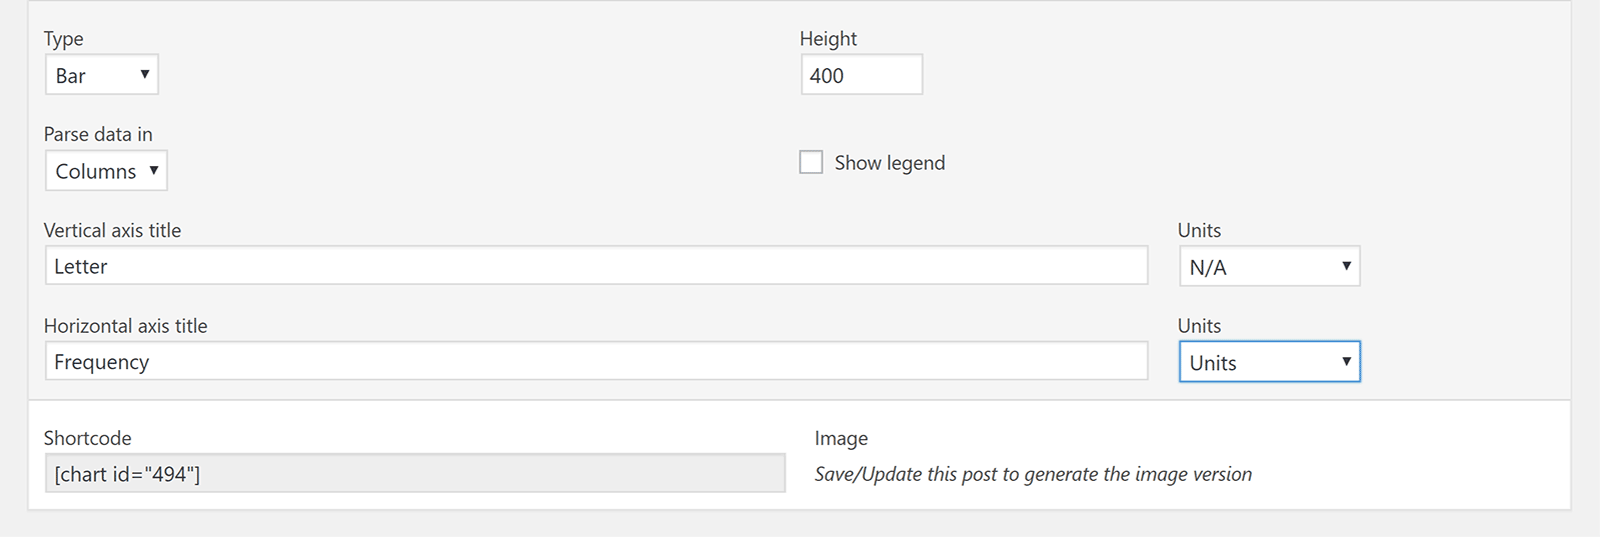
M Chart is a great free chart solution. It is easy to add data and insert completed charts into your content using shortcodes.
I do feel, however, that with only four types, you may want to look at some alternative chart solutions first.
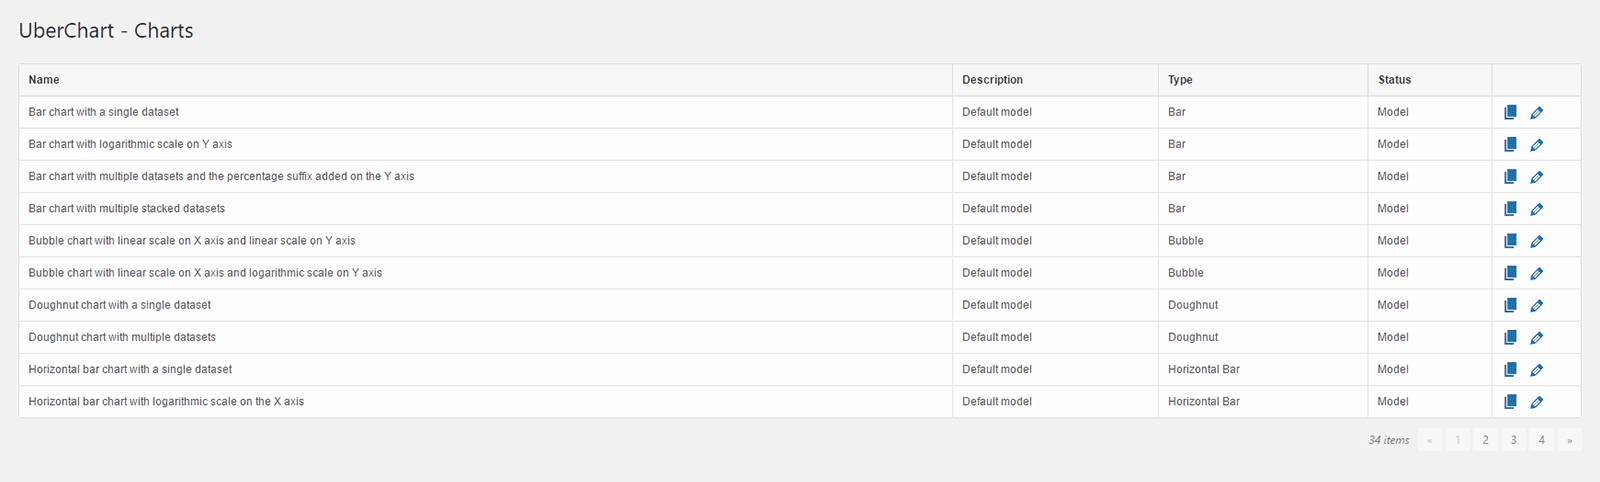
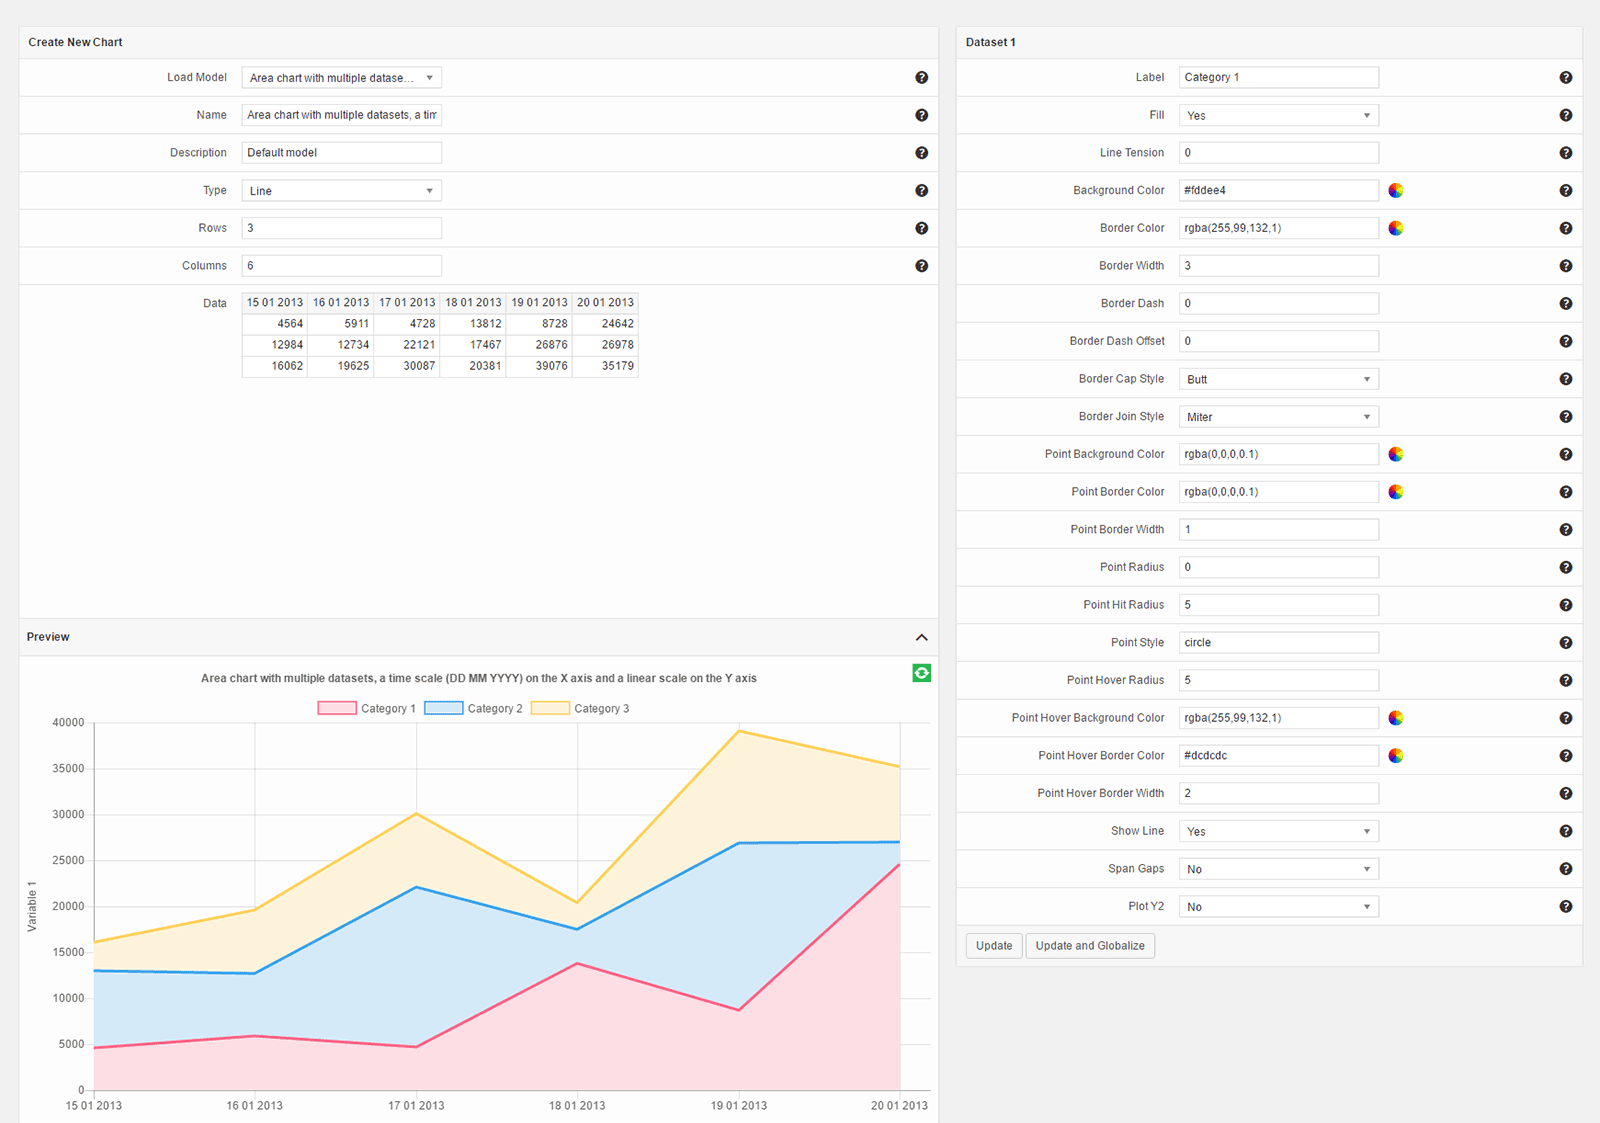
Retailing at $30, UberChart is an advanced chart solition that offers 240 customisable options per chart and 30 customisable options per data set.
A total of ten chart types are available: Line charts, area charts, bar charts, horizontal bar charts, pie charts, doughnut charts, radar charts, polar area charts, scatter charts, and bubble charts.
Any charts you create can be easily modified later at the click of a button. You can also duplicate charts and use them as a template for new charts.
Data can be imported via a CSV file or copied and pasted directly into the data area from spreadsheet software such as Excel.
There are a ton of styling options including padding, margins, colours, radius length, and more. A preview of your chart is displayed in the heart of the settings page.
Many users will just use the default styling setup, but if you want to customise your chart designs, you can change everything from tooltips, to titles, to chart legends.
With hundreds of options, a good selection of chart types, and support for multiple languages and WordPress multisite, UberChart is one of the best chart solutions available today.
Check out the UberChart examples page to see the quality of charts and graphs that can be created using the plugin.
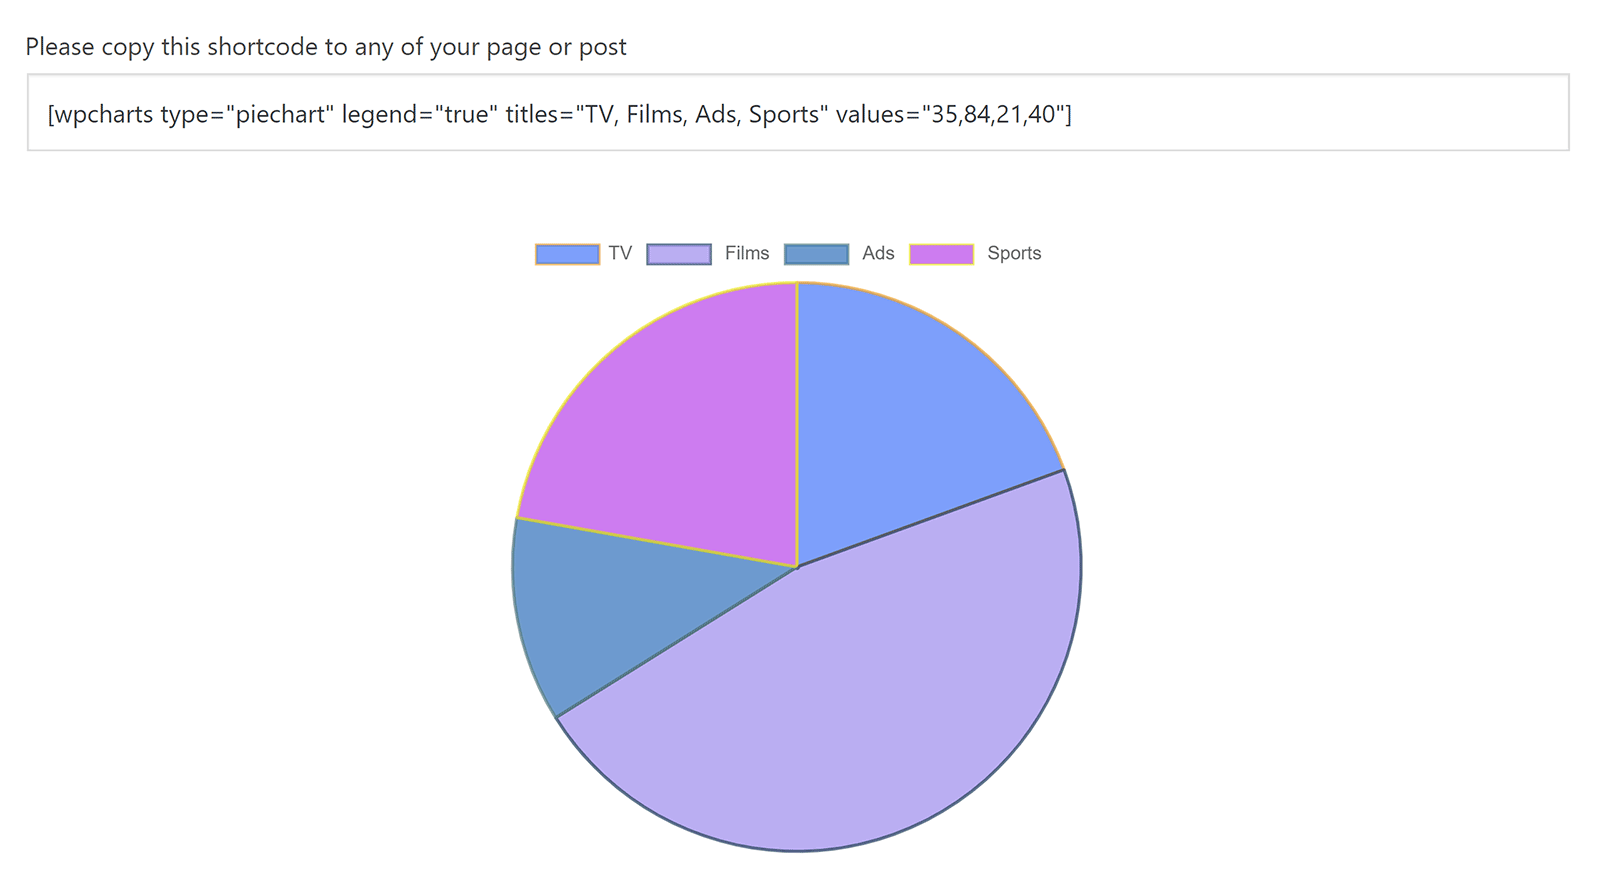
Last on our list is the free plugin WP Charts and Graphs. This basic plugin supports six chart types: Pie chart, polar chart, doughnut chart, line chart, bar chart, and radar chart.
All you need to do is add titles and their corresponding data. You then click the generate button.
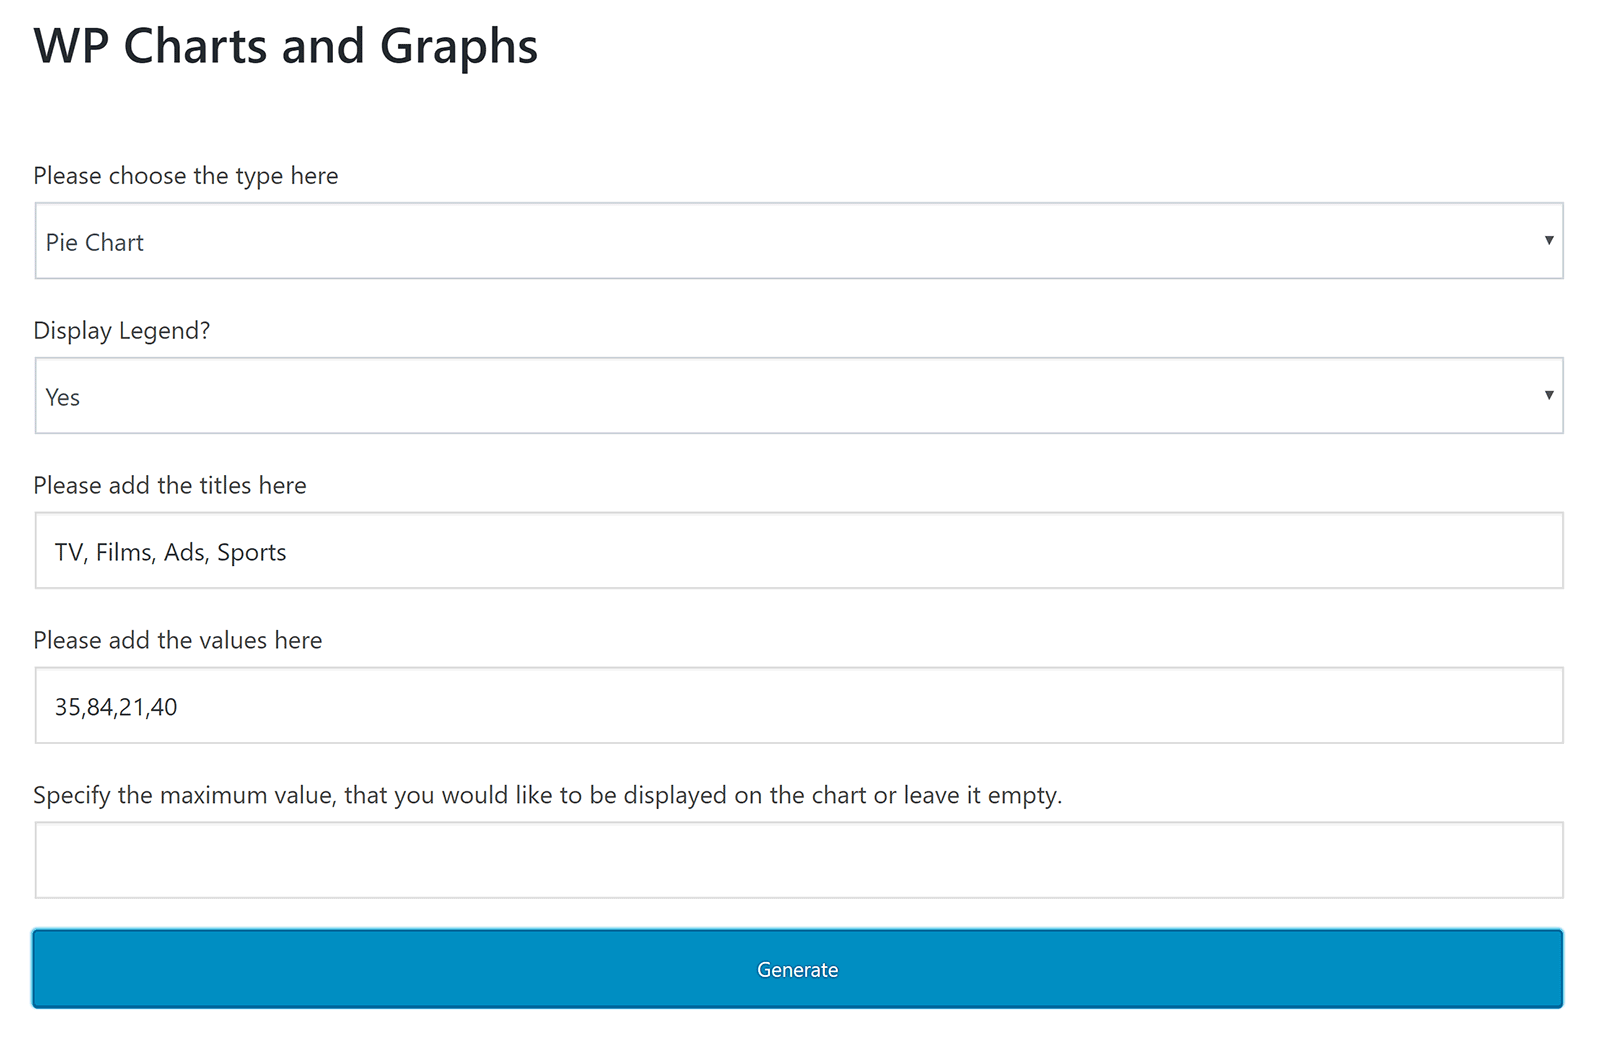
When you click the generate button, a preview of your chart will be displayed alongside the shortcode that you need to insert into your page in order to display it.
You can make quick edits to your chart later on by simply modifying the values within the shortcode.
WP Charts and Graphs is unashamedly basic. There is no dedicated settings page, no page that lists previously created charts, and no way to change the colours that are used in your charts.
If you can accept the limited set of customisation options on offer, you will appreciate how quick and easy the plugin is to use.
Honourable Mentions
A number of WordPress plugins fell short of being included in this list of the best charts and graphs plugins for WordPress.
Whilst I regard the plugins noted above to be generally better, I do appreciate that everyone’s situation is different, therefore you want to have a look at some of the solutions that did not make the cut.
Charts Ninja and Infogram are two solutions you may want to check out. These WordPress plugins were omitted from the final list as they require you to sign up to an external service to use them.
I believe it is better to store charts in your own WordPress database, so I was reluctant to include any solution that relies on a third-party service to function. If you do not mind using an external service, I highly recommend checking them out.
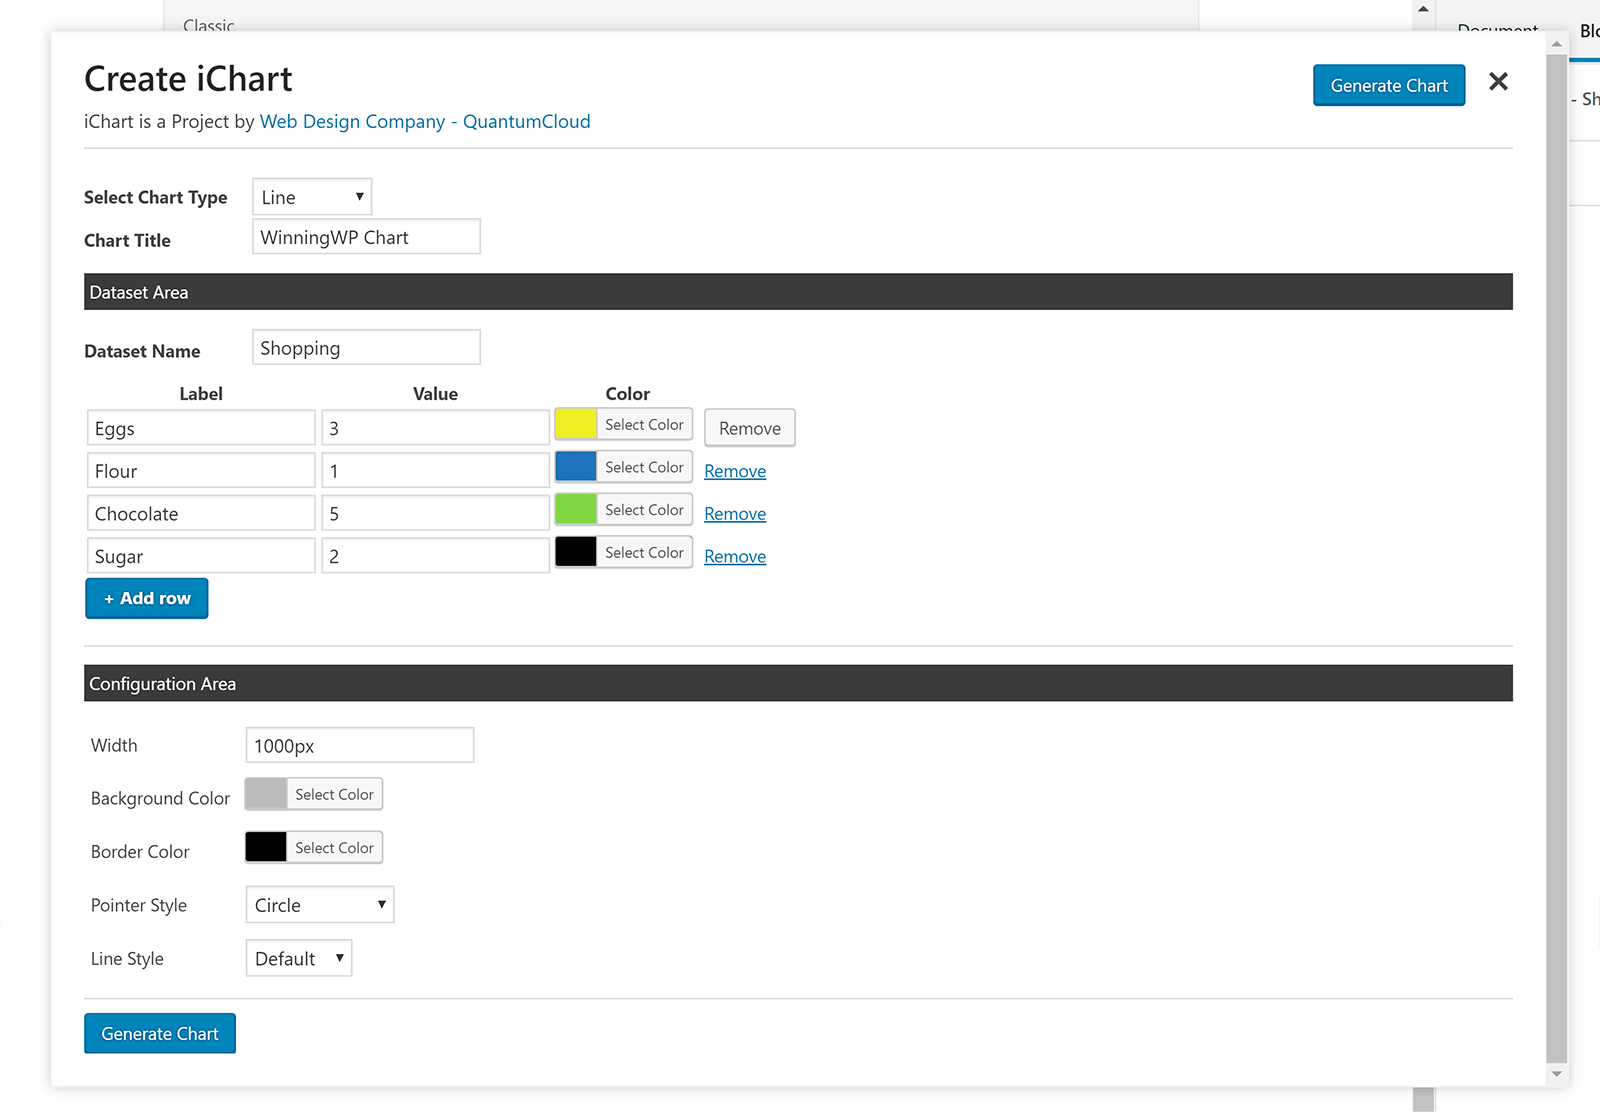
One WordPress plugin I liked was iChart. It is a simple chart solution that offers six chart types: Line charts, bar charts, radar charts, polar area charts, pie charts, and doughnut charts.
Another solution I liked was Chartli. Retailing at $25, it is one of the most stylish chart and graphs WordPress plugins available and boasts 15 chart types.
Unfortunately, neither of these plugins allow you to edit charts or graphs after you have created them. You cannot even modify data via the shortcode.
Due to this, it is hard to recommend them as mistakes will inevitably happen during the chart creation phase.
If you use Gravity Forms, check out MaxiCharts . The plugin can be used to create charts from form submissions and CSV files.
The Blazing Charts chart plugin lets you create chart code snippets from popular Javascript libraries. Advanced users may find this useful, but it is not user-friendly for beginners and intermediate users.
If you are primarily looking to create tables and then compliment them with charts and graphs, there are a few options available.
TablePress, which is the most popular table solution for WordPress, has an extension available for it called Chart Extension that uses Chartist.js to create responsive charts from your tables.
The pro version of Data Tables Generator by Supsystic, which retails from $39, adds the ability to create charts and diagarms from your table data. It is an effective way of enhancing your existing tables.
Final Thoughts
I encourage you all to try out the charts and graphs plugins that have been detailed in this article. I have no doubt that you will be pleasantly surprised by how easy these solutions are to use.
If you are looking for a way of adding basic charts and graphs to your website, I recommend using either WordPress Charts, WordPress Graphs & Charts, or WP Charts and Graphs.
Visualizer is easy to recommend too. It is just as easy to use as the solutions mentioned above, but also allows you to import data via CSV files.
AmCharts: Charts and Maps is one that advanced WordPress users will find useful, but others should avoid.
If options and styling customisation is a priority for you, I recommend using either Easy Charts or UberChart. Since Easy Charts is 100% free to download and use, that is the one I would encourage you to look at first.
As always, I encourage you all to do as much testing as possible before selecting a solution for your live website. To help you do this, I recommend searching for websites which offer example CSV files. These sample files can help you populate tables and charts with sample information to get a better understanding of what the plugins can do.
Use/using any of these plugins? Know of any other great plugins for charts and graphs?
![]()