If I gave you $1 to spend in your business, where would it go?
Your first instinct might be to invest in Facebook ads, or maybe to sock it away and save for the latest marketing software.
But the highest return on investment (ROI) might come from a surprising source: your email marketing.
The Data & Marketing Association said that in 2015, for each $1 spent on email marketing, companies made $38 in return.
That’s a 3,800% ROI!
If you want to achieve this result (and who wouldn’t?), you need to figure out if your emails and campaigns are ACTUALLY driving business-building results.
To do that, you need to pay attention to four email marketing metrics. Yes, just four. 🙂
These email metrics are UNIVERSAL and will help you measure the success of your emails so you can create effective email marketing campaigns no matter…
- … your email list size (whether it’s a fledgling or a full-grown eagle)
- … your type of business (from ecommerce to brick-and-mortar)
- … the email platform you use (from MailChimp to Maropost)
Today, I’m sharing…
- … the only four email metrics you need to track («but you must track them for every email you send)
- … how to use the metrics to track the two categories of emails («they couldn’t be more different)
- … and – most importantly – how to figure out if your email performance is good or bad («so you can actually improve your email marketing!)
Let’s get right to it!
What You MUST Track for Every Email
So why only four metrics?
Each of these metrics corresponds with a specific, high-leverage part of your email.
 If performance dips, reviewing which of these numbers changed can help you understand EXACTLY what happened and HOW to fix it.
The four metrics are…
- Deliverability
- Open rate
- Click-through rate
- Disengagement rate
Let’s dig into each of these and go over what they are and how you’ll use them in your own email marketing.
Email Marketing Metric You Must Track #1: Deliverability
First off, we have Deliverability, also known as delivery rate, which is calculated by dividing Delivered Emails by Sent Emails.
 Deliverability tells you what percentage of emails sent actually make it to the inbox. In other words, it clues you into how likely people are to GET your email.
In general, deliverability gives you a sense of how well your emails pass the “spam test” for Email Service Providers (ESPs) like Gmail and Yahoo.
If your emails don’t use flagged words and are well received by your audience, your deliverability should be quite high. A healthy deliverability percentage should be in the upper 90th percentile.
Be sure to pay attention to emails with low deliverability. This is a great way to identify language that ESPs don’t like, such as…
- No Investment Needed
- Zero Risk
- No Money Down
The next metric is one most people are familiar with…
Email Marketing Metric You Must Track #2: Open Rate
Your email’s Open Rate tells you how likely people are to READ your email and is determined by dividing Unique Opens by Received Emails. 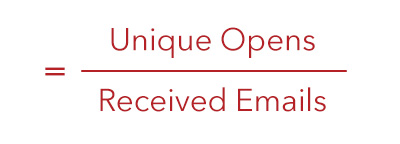
This measures the frequency with which your emails are opened, and thus read.
Open rate is one of the easiest metrics to affect, making it a well-known metric that is a frequent blog topic, including for us.
Open rate describes how well your subject line encourages your email list to actually take the time to read your email.
Since you’ve got roughly 30 characters to catch someone’s eye with a subject line, punchy copy can be the difference between 700 and 7,000 people reading your email.
You should use open rate as a barometer of how well your messaging resonates with your target audience. 
The third metric is arguably the most crucial because it most closely correlates with sales…
Email Marketing Metric You Must Track #3: Click-Through Rate
Click-through Rate tells you how likely your audience is to ENGAGE with your email, which means it indicates the likelihood that someone will click on a link within your email.
The formula to calculate click-through rate is the number of Unique Clicks divided by the number of Unique Opens.
 Click-through rate is so important because it measures whether or not people are actually taking the desired actions with your emails.
Clicks in an email are what drive…
- Visits
- Engagement
- And ultimately… sales
A low click-through rate usually indicates that your email copy is falling flat and is a sign of a weak or unclear call-to-action (CTA).
An easy fix to improve click-through rate is to avoid over-selling your products or services through email and instead focus on getting people to click your link.
The email body’s only job is to sell the click.
Trying to sell your product in there as well means you’ll come up with subpar performance every time.
(RELATED: 4 Emotional Triggers that Increase Email Click-Through Rate)
The last metric is one almost no one thinks about but may give you the most insight into how your email list feels about you and your email strategy.
Email Marketing Metric You Must Track #4: Disengagement Rate
Disengagement Rate tells you how likely people are to HATE your email.
 This can be computed by adding Spam Complaints to Unsubscribes and dividing the sum by Unique Opens.
Your emails will always drive some people away – you can’t please everyone and trying to will leave your business stuck in neutral.
However, you do need to make sure that the vast majority of readers on your list like what you have to say.
That’s why you want to make sure you keep an eye on your disengagement.
With disengagement rate, you can pinpoint messaging that doesn’t work, and cut that out of your toolbox.
You absolutely must keep your average disengagement rate below 0.15% for your emails, or you’ll start to see your deliverability drop.
You’ve got your four metrics, as well as the basic uses for each of them! Now that you know what you should be tracking, let’s talk about how to actually make that happen.
How to Track Email Performance (and the Two Categories of Email)
Not all emails you send are the same – and the distinction is key when it comes to measuring our four metrics.
There are two different categories of email, but this distinction has nothing to do with the content of the emails. Instead, these categories describe how emails are delivered to customers.
The two categories are broadcast emails and automated emails.
Let’s start with…
Email Category #1: Broadcast Emails
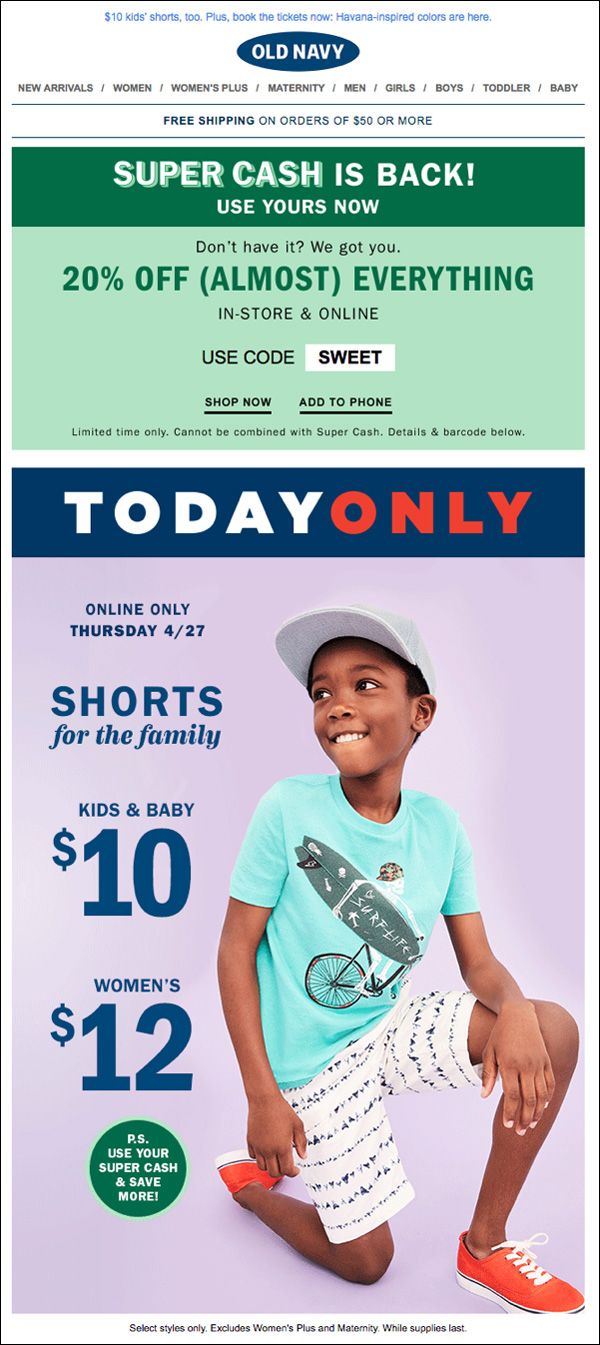
Broadcast emails are manually set up, scheduled, and sent out of your email marketing software to many people at once.
These are mass communication emails, closer to a piece of mail you get from your favorite clothing store with a 20% off coupon, like this one from Old Navy with the subject line, “SNAGGED IT: $12 SHORTS”:
And from a metrics perspective, broadcast emails are easy to evaluate; since all the emails are sent at the same time, data about these emails is reported in aggregate.
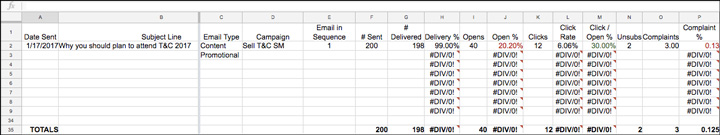
Here’s an example of a broadcast email report we would get out of our email client, Maropost.
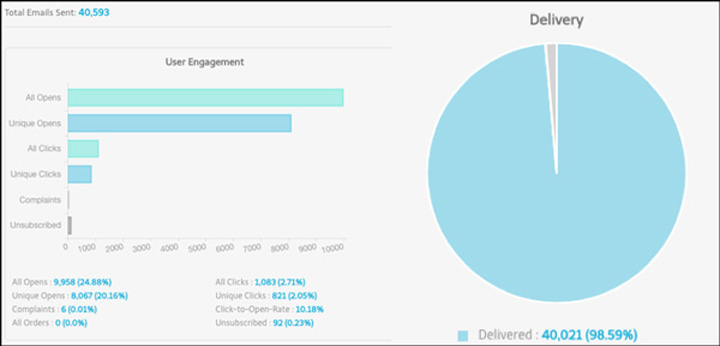
You can see three of our four metrics are automatically generated…
- Deliverability
- Open rate
- Click-through rate
And while the platform doesn’t actively provide Disengagement rate, it can be easily calculated from the formula provided earlier.
Next is…
Email Category #2: Automated Emails
Automated emails, on the other hand, act more like a personal letter.
They are customized to the individual recipient, usually containing more details about a customer and their interests.
These emails are sent out based on actions customers have taken – they can be triggered to send when customers do things like…
- Fill out a form
- Purchase a product
- Visit a certain webpage
Here’s an example of an automated email from Paragon Apparel with the subject line, “Did you see something you liked?” after visiting one of their product pages:
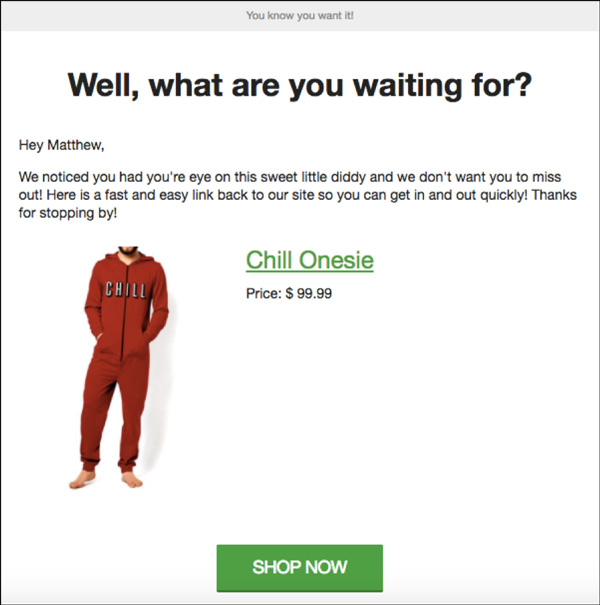
While the higher personalization means these emails typically perform better than broadcasts, they are also more difficult to track and evaluate because data isn’t always automatically aggregated for these and reporting is provided at a contact level.
Here’s an example of what I mean:
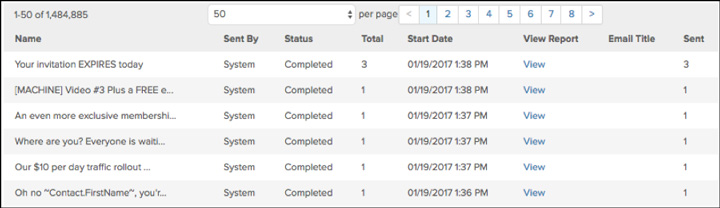
This granular reporting makes it hard to see the big picture and evaluate performance because you have to compare hundreds or thousands of individual reports.
But you need to track BOTH of these kinds of emails if you want to level up your email marketing.
To level up your email marketing, you MUST track it…
Tracking Email Performance with Metrics
We’ve covered why tracking broadcast emails is actually quite easy, meaning your only job with broadcasts is to put the metrics into your email marketing data warehouse (more on this later).
But tracking automated emails, or broadcast emails without proper reporting, is much trickier.
Since tracking isn’t happening within the platform, we have to look to other solutions to get our answers…
If you want fast and easy tracking and don’t mind spending a little money, there are two great solutions from which to choose.
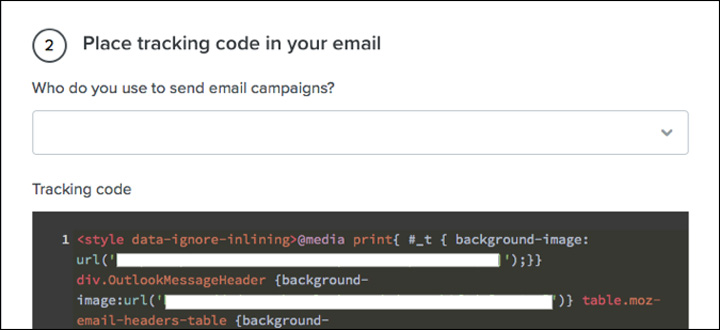
Both Litmus and Email on Acid provide aggregated, in-depth analytics for all your emails. To get started, simply add an HTML snippet to your email template…
Email on Acid is the more robust of the two options, with click tracking included in the service.
Unfortunately, neither piece of software reports on deliverability, but even so, these are the fastest and easiest way to get the bulk of your analysis up and running.
If you’re using a lean startup model and don’t want to shell out the money for these platforms, there is a free workaround you can set up using Google Analytics and Bitly, two free tools.
You can use event tracking in Google Analytics to report on email opens, meaning you’ll have your email performance data right there alongside your website information.
This great article from Dyn walks through how to set this tracking up step-by-step.
To track clicks, we’ll turn to Bitly, friend of social media managers everywhere because of its ability to shorten links.
Of course, email marketers can use it to track link clicks as well as shorten links.
Create a Bitly for every link you include in your email – the Bitly platform walks you through how to do this when you sign up for your free account.
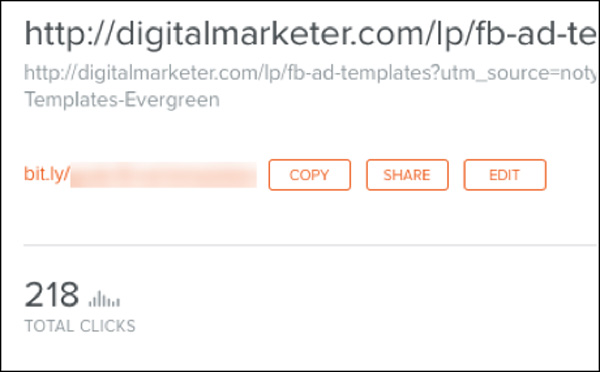
By doing this, you’ll be able to compare total clicks, as tracked in Bitly, to total opens, as tracked in Google Analytics, giving you click-through rate.
And you can compare opens to emails sent, which should be easy to pull out of any email platform.
Deliverability and disengagement won’t be possible, but you’ll have WAY MORE insight than most with this information.
Now that you know how to track all the information, we need to discuss how you’re going to store all of it, and how this will help you avoid a mistake many marketers make…
(NOTE: Want a plan for truly effortless automated email marketing? Check out DigitalMarketer’s Email Marketing Mastery — on sale for 90% off! Generate at least 200% more sales and conversions from the list you already have… even if it’s tiny! Learn more now and take advantage of this sale!)

Why You Absolutely, Positively MUST Own Your Own Email Marketing Data
When your email platform provides all of the metrics for analysis in a neat package, it’s easy to conclude that all your work is done – just check individual email metrics and move on to the next thing.
 This is a HUGE trap (that many people fall into) when it comes to email marketing because it feels efficient at the time.
To build a sustainable, long-term email strategy, you need to take any data you get in your business and hold it yourself.
There are two key reasons this is critical.
1. Being Prepared for Migrations
The first is that platforms come and go.
Your business will grow and its needs will change over time, meaning that a migration is almost assuredly in your future. Storing data externally makes it easy to be prepared when the time comes.
Take us for example…
Since 2011, DigitalMarketer has leveraged FOUR different email platforms.
If I wanted to compare a campaign we ran in 2011 or 2012 to one we ran today, or just see what the year-over-year trend in open rate was, I’d be out of luck without our platform-agnostic historical data.
2. Turning Your Email Marketing Metrics into Decision-Making Tools
Keeping all your information in one place, ideally one that lends itself to data modeling, helps you turn your data into a decision-making tool.
A simple chart looking at dates and deliverability can help you track how we’ll you’re maintaining compliance over time and whether or not you need to adjust your messaging.
The other important reason is that having a unified place where all this data lives makes it much easier to analyze and evaluate big chunks of data. You can track trends over time, by category or content of email.
Clearly, it’s important to have somewhere you can track these four metrics and the emails they represent that…
- isn’t tied to any one platform…
- and can be used to explore your data to find trends and opportunities…
…but that doesn’t mean it has to be complicated, as we’ll talk about next.
Storing Email Marketing Metrics Can Be Simpler than You Think
The fancy term for this external storage is a “data warehouse,” but it can be as simple and low-tech as a spreadsheet.
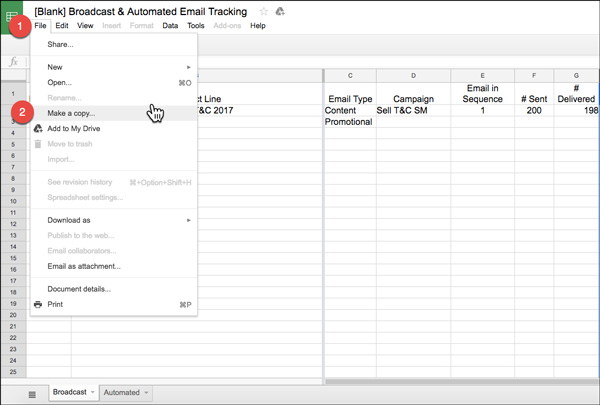
Here’s what the data warehouse DigitalMarketer uses looks like:
You can grab a copy of the tracking sheet DigitalMarketer uses here.
Just visit that link, then click File > Make a Copy, and you’ll have one you can edit added to your Google Drive!
This sheet will make it EASY to track BOTH broadcast and automated emails and get you started with your very own data warehouse.
Tracking broadcast emails is self-explanatory – you just plug the performance for each individual email into each row.
For automated emails, you’ll want to add an update to the sheet every time you get 100 new clicks on each email. That way, you’ll have enough data to give you representative performance metrics.
Now that you know your metrics and your tracking and organizing them, there’s one step left.
What Does Success Look Like? How to Benchmark Your Performance
Figuring out how your emails stack up can be very tricky.
The biggest question I get from people about their email marketing metrics is, “How do I know if my results are good or bad?” Followed by, “What kind of performance do you see at DigitalMarketer?”
Unfortunately, that’s not too useful.
Looking at…
- different markets
- different products
- different email lists
…won’t help YOU decide how YOU’RE doing.
You need to look closer to home.
Thankfully, there are two great resources to help you define what success looks like.
Benchmarking Your Performance by Keeping an Eye on Your Peers
The first resource is other people in your industry.
If you’re a law firm, knowing how email marketing generally performs for other businesses offering legal services will give you a great benchmark for what success should look like.
This data will be more FAR MORE useful than the law firm comparing itself to a clothing store.
The same goes for all industries – if you know the general habits of people in your audience, you can evaluate your results.
So, how do you go about this? 
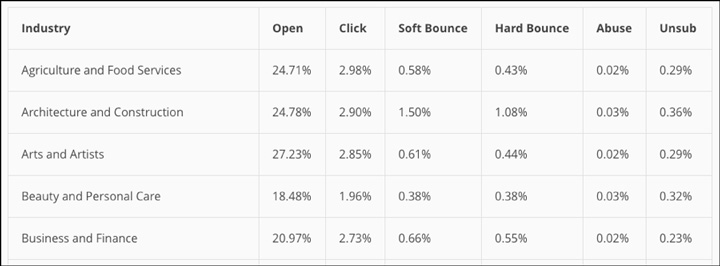
Luckily, Mailchimp has created the best resource ever for taking a peek into your peers’ email marketing metrics.
This resource provides averaged email performance data for 46 different industries, ranging from Arts and Artists all the way to Vitamin supplements.
And because Mailchimp sends over 10 billion emails a month, the information is extremely representative of behavior patterns.
Here’s a look at some of that data:
The other resource you should use to evaluate your performance is your own data…
Benchmarking Your Performance by Looking to the Past
Looking at past performance is one of the best ways to get a sense of where your email marketing program is at the moment.
To turn your historical data into something usable, you need to compile it.
This can be done pretty easily – generate averages for your four-metrics looking at the past…
- six months
- year
- and three years
…to see what direction performance is trending and to come up with benchmarks to compare current performance to.
 Whether or not your email marketing is where you want it to be today, the only way to start improving it is to understand where you are at the moment.
Leveraging these two different sets of data will give you reasonable expectations and help you understand how your email marketing shapes up.
In addition to the details on how to improve individual metrics, making your audience more or less specific is the next best way to improve performance.
To beat your baseline, try experimenting with a smaller list, targeted by topics you know they’re interested in.
And experimenting with the email’s subject line and body copy is a great way to boost performance.
(RELATED: [Swipe] Digital Marketer’s Best Email Body Copy)
Focus on improving one metric at a time – that way you can figure out what’s causing the lift.
What’s next, you might ask?
Well…
Prove, then Automate
Now that you’ve got the basics of tracking and using your email marketing metrics, you can take it one step further by leveraging your broadcast emails to improve your automated emails.
Once you have a good sense of what exceptional performance looks like, you can cherry-pick your best broadcast emails and turn them into automated emails.
That way, every time you send a broadcast, you’re also working in your email marketing laboratory – testing and improving your campaigns!
And by keeping a close eye on these four metrics, you can figure out how to create and maintain effective email marketing campaigns.
(NOTE: Want a plan for truly effortless automated email marketing? Check out DigitalMarketer’s Email Marketing Mastery — on sale for 90% off! Generate at least 200% more sales and conversions from the list you already have… even if it’s tiny! Learn more now and take advantage of this sale!)