
“Engagement.” It’s a term often dismissed as “fluffy” that lacks true value towards primary business goals.
But we live in a world where customers can engage with us in real time. And with this comes an expectation of delivering the best experience possible.
It’s not just about letting your customers feel heard. Engagement metrics, while often seen as “vanity metrics,” are important indicators of how well your marketing is performing.
In this article, I’ll share six engagement metrics you must measure throughout the funnel to ensure your marketing is working. I’ll also share actionable tactics on how to improve them and, as a result, your bottom line.
1. Content Reach
You put in the grind and work hours to create a superb piece of content. You know it will serve your audience, but…
Crickets.
While often considered a vanity metric, Reach is still a great indicator of your content’s performance. If you’re promoting visual media through social platforms or blog posts, Reach dictates how well it will perform.
A simple definition of Reach is: “the total number of people who see your content.” It’s a metric that indicates the unique users and readers who see the content you promote.
There are a few elements to consider when measuring Reach:
- Unique users: As explained above, this is the standard method of measuring the reach of your content. Typically, unique users are measured through a 30-day window (thanks to cookies.) Bear in mind that not all views are created equally: a visitor to a landing page for a lead magnet will be more valuable than blog post readership.
- Geo: Understanding where in the world people are consuming your content helps you allocate budget and resources effectively.
- Device: Are your users reading your content on a desktop or a mobile device? Understanding how people consume your content will help you optimize and format the design experience of your content.
Another metric to keep an eye on is social shares. Calculated as part of your Reach, shares can provide an indicator on how well your content is resonating with your audience.
How to Boost Content Reach
Thanks to algorithm updates, organic reach is now tougher than ever. Last month, we saw the biggest ever drop in Facebook organic reach to date.
So how do you combat this? The most obvious way is through paid promotion. Many brands are allocating budget to boost the reach of their content.
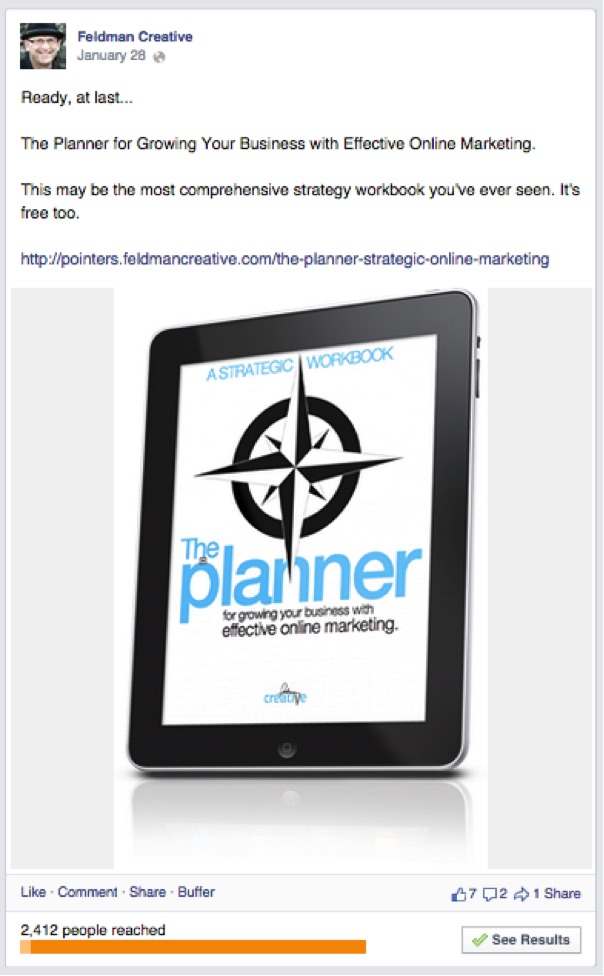
Sponsored posts on Twitter, Facebook, and LinkedIn, are more popular than ever. For example, Barry Feldman invested in sponsored Facebook posts to announce his new eBook. While this post only generated 100 organic views, his paid efforts reached over 2,400 users:
Amplifying content using sponsored social posts and other paid media can be an effective way of extending reach, as well as generating a fresh stream of traffic. When it comes to earned media, influencer marketing is more popular than ever. In fact, 84% of marketers planned on running at least one influencer marketing campaign in 2017.
Consider starting by engaging with micro-influencers first. Unlike celebrities or public figures, they’re individuals who operate in specific verticals.
Their follower size is between 1,000 to 100,000 – which makes them more affordable and accessible than traditional influencers with an audience of 1M or over. They also tend to have a much higher rate of engagement.
Stitch Fix uses Instagram as a method of collaborating with micro-influencers. In the example below, they linked to a Q&A post with a fashion blogger to add value to their community while tapping into a wider audience:
Identify the micro-influencers relevant to your brand, and then engage with them via social media before reaching out. Alternatively, get connected with influencers quickly using a platform like Upfluence or Hype Factory.
2. Time on Page vs. Scroll Depth
When you create an awesome piece of content, you want people to read it. However, if it takes ten minutes to read and users are only spending two minutes on the page, this might indicate a deeper issue.
“Average time on page” is a Google Analytics metric that helps you understand how users are engaging with your content. Before we cover this metric, it’s important first to understand average session duration.
Calculate average session duration by dividing total duration of all sessions (in seconds) by the number of sessions:
Total session duration (secs) / Number of sessions
The session duration for an individual user varies by how a user engaged with the last page of a session. For example, if a page contains a video, the session duration is tracked until the moment they hit “play.” Otherwise, the time spent on the page does not count towards the total session duration. Analytics Edge puts it best:
“If you track things like file downloads with events, and if a visitor downloads a file at the end of the last page, then the session duration is calculated to the time of that event (note: This does not happen if the event is a non-interaction type).”
So, why is “average time on page” such a tricky metric to measure?
“Time on page” and “time on site” are measured between timestamps of hits. So, if a user bounces, no time is recorded.
Furthermore, time on page is recorded even when a window or tab is inactive. This means that time on page is an average of users who didn’t bounce from that page.
Many marketers prefer monitoring scroll depth to time on page. It can provide a more accurate engagement metric for content, as the further someone scrolls through content, the more engaged they’re likely to be.
The truth is, you should measure both. Scroll depth alone can be misleading, as many users scroll through a page before deciding whether or not to continue reading.

You can access on-page metrics on Google Analytics using the Chrome extension (In-Page Analytics was removed from the GA interface this year.) Another solution is CrazyEgg or Hotjar’s Scrollmap technology, which shows you where on your page users are most engaged.
How to boost Content Engagement
The more time people spend on your content, the higher the chance they are to convert.
Start treating your content as a marketing asset. Run regular A/B tests on pages with the large opportunities. You can find these opportunities by identifying pages that generate large amounts of traffic with low engagement. Head to Behavior > Site Content > All Pages on Google Analytics to access this data.
When Alex Turnbull wanted to improve engagement on the Groove blog, he ran an A/B test to see what effect storytelling would have on readership:
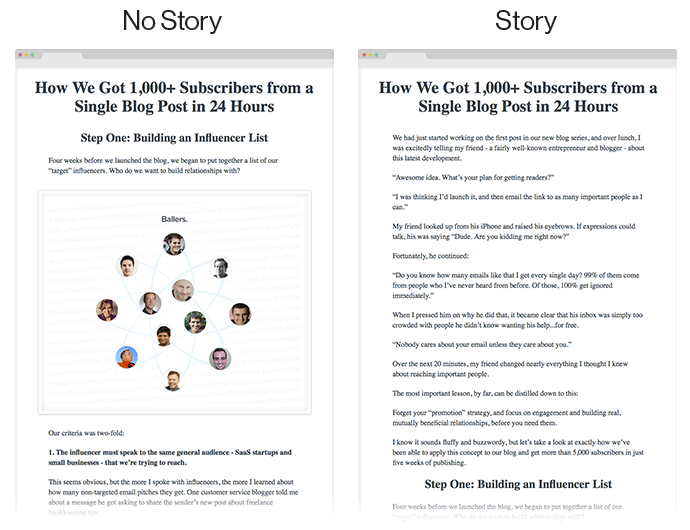
The result? A 300% increase in people scrolling to the bottom of the page.
Look at your content and put yourself in your user’s shoes. Where are you failing to get their attention? At what stages might they get bored of your content?
Identify these potential points of friction, and then experiment with different headlines, introductions, and design layouts to improve engagement.
3. Social Comments & Conversation Rate
Reach is a great indicator of how many eyeballs view your content. Engagement with that content is often neglected and is arguably the most important aspect of social media marketing.
Therefore, comments should be regularly measured. Not only that but the overall sentiment of the conversation (i.e., positive or negative.)
Comment count is an exciting metric but can be meaningless without context. You must also measure the conversation rate. Calculate your conversation rate using this formula:
Total comments / Followers * 100 = Conversation rate
For example, a post that generates 30 comments may not seem like much to some. But for a Facebook page of only 250 likes, this number is significant. Using the formula above, the conversation rate for this post is 12%.
However, not all of your followers may see your post, and the above calculation doesn’t account for “non-followers” who see your content. With this in mind, another way of calculating conversation rate is against total reach:
Total comments / Reach * 100 = Conversation rate
With the above calculation, you’re measuring engagement against the number of users who actually see your post i.e. total impressions.
This metric helps answer the question: is this post interesting enough to initiate a discussion around?
How to Boost Conversation Rate
Using the question above, you can assume that the higher the conversation rate, the more your social content can be considered “interesting.”
Therefore, to increase engagement with your brand on social media, your content must be more interesting!
Ok, great. But “interesting” is subjective. What may be interesting to one audience may be boring to another.
To find out what content to create, look at the data. Look at your social media analytics over the last year and see where the spikes in engagement and reach occurred. Ask yourself:
- What’s so interesting about this content?
- Does the caption/headline hook in your users?
- Is the image funny/inspiring?
- Was the topic topical, or emotionally driven?
Use Unmetric’s free Discover tool to uncover popular content around specific topics. Search for relevant keywords/hashtags, select “Organic” under Post Type and then sort by “Most Comments:”

Using this approach, you can let the market tell you what it finds interesting. Use the data available to you and do more of what works.
4. Brand Name Search
Many marketers consider “branding” another fluffy term. It’s still important, and can often be the first step towards a sale.
The fastest way to measure your brand awareness is through brand query searches. To uncover this metric, head to Google Search Console and navigate to the Queries page and select the “Impressions” box:
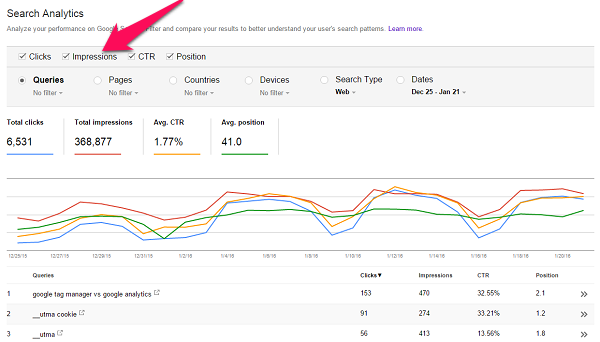
This page gives you an accurate estimate of how many people are searching for your brand name.
Other ways of measuring brand awareness include:
- Social mentions: Search your brand name on Twitter and look at the total number of tweets in contains. Alternatively, use a tool like Mention to monitor social posts that mention your brand.
- Inbound links: Using Webmaster Tools or Ahrefs can show you which pages link to your website.
- Reviews: Sites like GetApp and Trustpilot can give you an idea of how people rate your brand’s products and services.
How to Boost Brand Awareness
The more content you produce, the more your brand awareness will grow over time.
Use retargeting ads to maintain top-of-mind awareness. Use Google’s display network and Facebook Ads to serve ads to those who have visited your website.
Retargeting ads can also help increase conversions using the Facebook pixel. For example, Expedia uses Facebook retargeting to capture users who viewed hotels without booking:

Content creation and PR also helps with brand building efforts. If your content is useful, entertaining or insightful, you’ll increase brand awareness over time.
5. Email Marketing Engagement
Email marketing is still one of the most effective marketing channels. When it comes to measuring engagement, there are:
- Open rate: One of the top metrics measured by all marketers. Put simply; this tells you the total number of people who open your email.
- Clickthrough rate: The percentage of recipients who click on one or more links on your email. Calculated by dividing total (or unique) clicks by the number of delivered emails and multiplying that by 100.
- Conversion rate: The percentage of email recipients who clicked and completed an action on the landing page.
- Forwarding/sharing rate: The percentage of recipients who forward your email or click a “share” call-to-action.
Conversion rate is especially important. This metric is the biggest indicator of email marketing success. The ultimate goal of your email is to make a sale or persuade leads to take the next step in the funnel.
Using a tool like Return Path can help give you further insights into how your recipients are engaging with your emails. It shows you which devices and browser’s users use, as well as insights on when and where they view your emails.
Furthermore, it allows you to segment emails by demographics, mobile use, and custom tags.
How to Boost Email Engagement
The best approach to improving your email marketing results is to optimize each stage of the journey.
Open rates, for example, can be optimized by testing subject lines and which days of the week to send them. It’s also worth segmenting the users who open them most frequently and analyzing their behavior.
Many factors will affect clickthrough rates. For example, if your opening sentence doesn’t hook readers in, they’re less likely to read the rest of the email.
But your main focus should be on conversion rate. Test the following elements to improve conversions and, ultimately, ROI:
- Opening sentence: Hook the reader in and guide them towards the call-to-action
- Calls-to-action: Experiment with different text/buttons, e.g., “Click here” vs. “Get your free guide now.”
- Landing page: Ensure the copy of the landing page compliments the email copy. The journey should flow seamlessly.
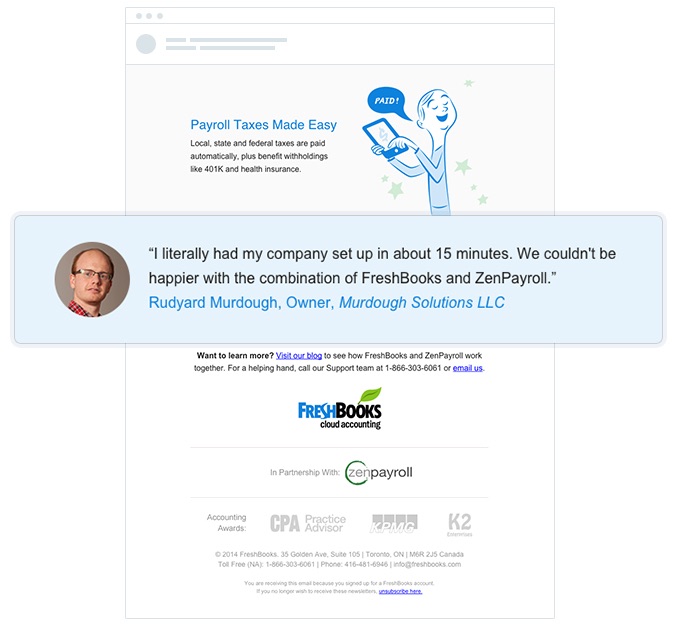
The example below from Freshbooks used social proof to reduce anxiety when releasing a new integration. It featured a testimonial from a customer, including a headshot to add an extra layer of personalization:
It’s the same approach you would take when optimizing a landing page. Test every element, from subject lines (headlines) to call-to-action text and buttons. Remove any unnecessary elements to make your emails as clear and persuasive as possible.
6. Net Promoter Score
As marketers, we’re always striving to make our audience happier. Net promoter score (or NPS) allows us to measure how happy they truly are.
Developed by Fred Reichheld of Bain & Company, NPS is a measure of how likely a customer is to recommend your brand.
Customers are categorized into three different segments: Promoters (score of 9 to 10), Passives (score of 7 to 8) and Detractors (score of 0 to 6.)

NPS can be calculated simply the question “How likely would you be to recommend our product/service?” Use this question within your website, SaaS platform or in an email survey.
How to Boost NPS
To improve NPS is to improve customer satisfaction. It’s a score that indicates how well your entire business is doing. Your goal is to generate more promoters, while converting passives and detractors into promoters.
It all boils down to delivering a delightful experience from the very beginning of the marketing funnel all the way to your product and service delivery.
NPS shows your product and marketing teams what users love about your product and where their pain points are. Use customer development to uncover where these sticking points are for your detractors.
So, then, the question is: what do you do with your promoters?
Referral and ambassador programs can turn happy customers into an entirely new acquisition engine.
Lululemon is a great example of this in action. They empower their ambassadors to lead yoga classes all over the world, and get support directly from the brand in the form of guidelines and content:
The key is to make them feel a part of something. Give your promoters the tools to easily create user-generated content (UGC) around your brand and to spread your message.
Conclusion
While engagement is often associated with “vanity metrics,” they can still be a key indicator for success.
The fact is your audience is active on many different platforms at once. Not just your blog, platform or website. The question is how do you get them onto your own media and into your marketing funnel?
Nurturing your audience on the platforms they’re active is the best way to do this. Improve each touchpoint on every channel you communicate with your audience on. This is how you convert attention into traffic & leads.
How do you currently measure the conversation with your customers? What are you doing to keep them engaged?
About the Author: Juuso Lyytikkä is the Head of Growth at Funnel.io. Funnel is a marketing analytics tool for online marketers that collects data from ALL advertising platforms and allows marketers to send and visualize this data anywhere. Book a demo to get a free trial.